ReSharper: Value Tracking
I already wrote about the new feature of the 5th Call Hierarchy Resharper . The logical development of Call Hierarchy is Value Tracking. Value Tracking was created to help the developer understand how the wrong data could arrive at a particular point in the program or where this data could go. As a result, it becomes easier to investigate the causes
Again, I will not deeply theorize, but will briefly show how and in what scenarios Value Tracking works.
Consider a simple example. In the method

If you independently start the analysis using the above example and navigate the results tree, you will find that the tree contains all the nodes interesting for the programmer:
This time we have an interface, its implementations, fields, field initializers, constructors. Let's try to figure out what values the method can display

In the results of Value Tracking we see:
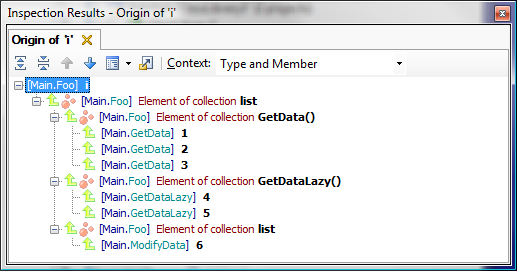
Now consider working with collections. Let's try to find out the set of all values that will be displayed on the screen with the following code. To do this, let's get down to using
We found both the explicit creation of the array, and the values that come from the lazy enumerator, and even the method call
And now let's try in the opposite direction, see where the number gets

Quickly enough, we found out that the number
In this and the previous examples, note that as soon as Value Tracking moves from value tracking to collection tracking, the corresponding nodes in the tree are marked with a special pink icon.
Lambdas, with them, especially if there are a lot of them and do not let them fight they are enclosed, problems constantly arise. Let's see how R # works in the following situation. In this case, let us now try to trace the values in both directions:
First, we will look for where the parameter values come from

Now let's try to find where the value returned by the lambda is used. Select

You can easily make a more complex example with nested lambdas yourself by replacing the output on the screen (
The analysis will still work and you can easily figure out where the value of the expression goes
NullReferenceExceptionor misconduct and conclusion. Again, I will not deeply theorize, but will briefly show how and in what scenarios Value Tracking works.
Simple example
Consider a simple example. In the method
VisitDatahappens NullReferenceException, let's find out where it comes from null. Place the caret to use the parameter dc in the method VisitData and run the analysis ( R # -> Inspect -> Value Origin ):public class Main
{
void Start()
{
Console.WriteLine(Do(new DataClass()));
}
void Start2()
{
Console.WriteLine(Do(null));
}
int Do(DataClass data)
{
var v = new Visitor();
return v.VisitData(data);
}
}
public class DataClass
{
public int GetData()
{
return 0;
}
}
public class Visitor
{
public int VisitData(DataClass dc)
{
return dc.GetData();
}
}
* This source code was highlighted with Source Code Highlighter .
If you independently start the analysis using the above example and navigate the results tree, you will find that the tree contains all the nodes interesting for the programmer:
- Direct use
dc(just the place where the exception occurs) - Passing a parameter
datato a methodVisitData - Calling a method
Dowith “good data” (in the tree, the data of interest to us is highlighted with a bold ) - Method call
Dowithnull- the problem you are looking for
- Skips minor steps, saving time
- Shows data in a convenient form, i.e. allows you to quickly, without losing concentration on the problem and not tracking with your eyes all the use of symbols, find the source of the problem.
Inheritance
This time we have an interface, its implementations, fields, field initializers, constructors. Let's try to figure out what values the method can display
Main.Start. To do this, select the expression dataProvider.Fooand call Value Origin on it:public interface IInterface
{
int Foo();
}
public class Base1 : IInterface
{
public virtual int Foo()
{
return 1;
}
}
public class Base2 : IInterface
{
private readonly int _foo = 2;
public Base2()
{
}
public Base2(int foo)
{
this._foo = foo;
}
public virtual int Foo()
{
return _foo;
}
}
public class Main
{
public void Start(IInterface dataProvider)
{
Console.WriteLine(dataProvider.Foo());
}
public void Usage()
{
Start(new Base2(3));
}
}
* This source code was highlighted with Source Code Highlighter.In the results of Value Tracking we see:
- An implementation of a method
Foothat returns a constant1 - An implementation of a method
Foothat returns the value of a field_foo, as well as all sources of values for this field:- Assigning a value to this field in the constructor
- Constructor call with parameter
3 - Initializer of this field with value
2
Collections
Now consider working with collections. Let's try to find out the set of all values that will be displayed on the screen with the following code. To do this, let's get down to using
iinside Console.WriteLineand run the Value Origin analysis:class Main
{
void Foo()
{
var list = new List();
list.AddRange(GetData());
list.AddRange(GetDataLazy());
ModifyData(list);
foreach (var i in list)
{
Console.WriteLine(i);
}
}
void ModifyData(List list)
{
list.Add(6);
}
private IEnumerable GetData()
{
return new[] { 1, 2, 3 };
}
IEnumerable GetDataLazy()
{
yield return 4;
yield return 5;
}
}
* This source code was highlighted with Source Code Highlighter. We found both the explicit creation of the array, and the values that come from the lazy enumerator, and even the method call
Add. Sumptuously!Collections in the opposite direction, or where the values go
And now let's try in the opposite direction, see where the number gets
5. Select it and call Value Destination:public class testMy
{
void Do()
{
int x = 5;
var list = Foo(x);
foreach (var item in list)
{
Console.WriteLine(item);
}
}
List Foo(int i)
{
var list = new List();
list.Add(i);
return list;
}
}
* This source code was highlighted with Source Code Highlighter. Quickly enough, we found out that the number
5:- Passed to method
Foo - Added to collection
- Collection is returned and used
- Collection items are displayed.
In this and the previous examples, note that as soon as Value Tracking moves from value tracking to collection tracking, the corresponding nodes in the tree are marked with a special pink icon.
Lambdas
Lambdas, with them, especially if there are a lot of them and do not let them fight they are enclosed, problems constantly arise. Let's see how R # works in the following situation. In this case, let us now try to trace the values in both directions:
public class MyClass

{

 void Main()

 {

  var checkFunction = GetCheckFunction();

  Console.WriteLine(checkFunction(1));

 }


 Func GetCheckFunction()

 {

  Func myLambda = x =>

              {

               Console.WriteLine(x);

               return x > 100; //искать будем отсюда

              };

  return myLambda;

 }

}


* This source code was highlighted with Source Code Highlighter.
First, we will look for where the parameter values come from
x. Select its use in the call Console.WriteLineand call Value Origin:- Found containing lambda parameter
- Further, the analysis tracked where this lambda is transmitted. Please note that all nodes in which we track lambda are marked with a special icon.
- In the last step, we see that lambda is called with an argument
1, this is the desired value forx
Now let's try to find where the value returned by the lambda is used. Select
x>100and call Value Destination ( R # -> Inspect -> Value Destination ):- Analysis keeps track of what expressions return as a result of lambda execution
- Next, R # tracked where lambda passed
- At the end, we see a method call
WriteLine, which uses the value returned by the lambda
You can easily make a more complex example with nested lambdas yourself by replacing the output on the screen (
Console.WriteLine) with two lines:Func, int, bool> invocator = (func, i) => func(i);
Console.WriteLine(invocator (checkFunction,1));
* This source code was highlighted with Source Code Highlighter. The analysis will still work and you can easily figure out where the value of the expression goes
x>100. Code with embedded lambdas is very difficult for an ordinary person to understand, which makes analysis even more popular. Moreover, you can try to create a collection of nested lambdas - and it will work! But I will leave such exercises to the reader and the hard real life.