AresDB Demo: Uber's GPU-based, real-time open source analysis tool
- Transfer
Thanks to real-time analysis, we, Uber employees, get an idea of the state of affairs and work efficiency and, on the basis of the data, decide how to improve the quality of work on the Uber platform. For example, the project team monitors market conditions and identifies potential problems on our platform; software based on machine learning models predicts passenger supply and demand for drivers; data processing specialists improve machine learning models — in turn, to improve the quality of forecasting.

In the past, for real-time analysis, we used database solutions from other companies, but none of them met all of our criteria for functionality, scalability, efficiency, cost, and performance requirements.
Released in November 2018, AresDB is an open source, real-time analysis tool. It uses an unconventional power source, graphics processors (GPU), which allows for an increase in the scale of analysis. The GPU technology, a promising real-time analysis tool, has advanced significantly in recent years, making it ideal for real-time parallel computing and data processing.
In the following sections, we describe the structure of AresDB and how this interesting solution for real-time analysis allowed us to more effectively and more rationally unify, simplify and improve solutions for Uber databases for real-time analysis. We hope that after reading this article, you will test AresDB as part of your own projects and also make sure that it is useful!
Uber applications for real-time analysis
Data analysis is crucial for the success of Uber. In addition to other functions, analytical tools are used to solve the following tasks:
- Build dashboards for monitoring business metrics.
- Making automatic decisions (for example, determining the cost of a trip and identifying cases of fraud ) based on collected metrics.
- Create random queries to diagnose, troubleshoot problems in business operations.
We categorize these functions with different requirements as follows:

Information panels and decision-making systems use real-time analysis systems to create similar queries on relatively small, but highly important, data subsets (with a maximum level of data relevance) with high QPS and low latency.
Need for another analytic module
The most common problem for which Uber uses real-time analysis tools to solve is the computation of sets of time series. These calculations give an idea of the interaction with users so that we can improve the quality of services accordingly. Based on them, we request indicators for certain parameters (for example, day, hour, city identifier and trip status) for a certain period of time for randomly filtered (or sometimes combined) data. Over the past years, Uber has deployed several systems aimed at solving this problem in various ways.
Here are some third-party solutions that we used to solve problems of this type:
- Apache Pinot , an open source distributed analytic database written in Java, is suitable for large-scale data analysis. Pinot uses the internal lambda architecture for querying packet data and real-time data in a column store, an inverted bit index for filtering, and a star tree for caching aggregate results. However, it does not support key-based deduplication, update or insert, merge, or advanced query functions, such as the geospatial filtering feature. In addition, since Pinot is a JVM-based database, querying is very expensive in terms of memory usage.
- Elasticsearch is used in Uber to solve various stream analysis problems. It is based on the Apache Lucene library , in which documents are stored, for full-text keyword search and an inverted index. The system is widely distributed and extended to support aggregate data. The inverted index provides filtering, but is not optimized for storing and filtering data based on time ranges. Records are stored in the form of JSON documents, which imposes additional costs on providing access to the repository and requests. Like Pinot, Elasticsearch is a JVM-based database and, accordingly, does not support the merge function, and query execution takes up a large amount of memory.
Although these technologies have their strengths, they lacked some of the features necessary for our use case. We needed a unified, simplified and optimized solution, and in its search we worked in a non-standard direction (more precisely, inside the GPU).
Using the GPU for real-time analysis
For realistic rendering of images with a high frame rate, graphics processors simultaneously process a huge number of shapes and pixels at high speed. Although the trend towards an increase in the clock frequency of data processing units has diminished over the past few years, the number of transistors in a microchip has increased only according to Moore's law . As a result, GPU computing speed, measured in gigaflops per second (Gflops / s), is increasing rapidly. Figure 1 below shows a comparison of the theoretical speed trend (Gflops / s) of the GPU from NVIDIA and the CPU from Intel over a number of years:
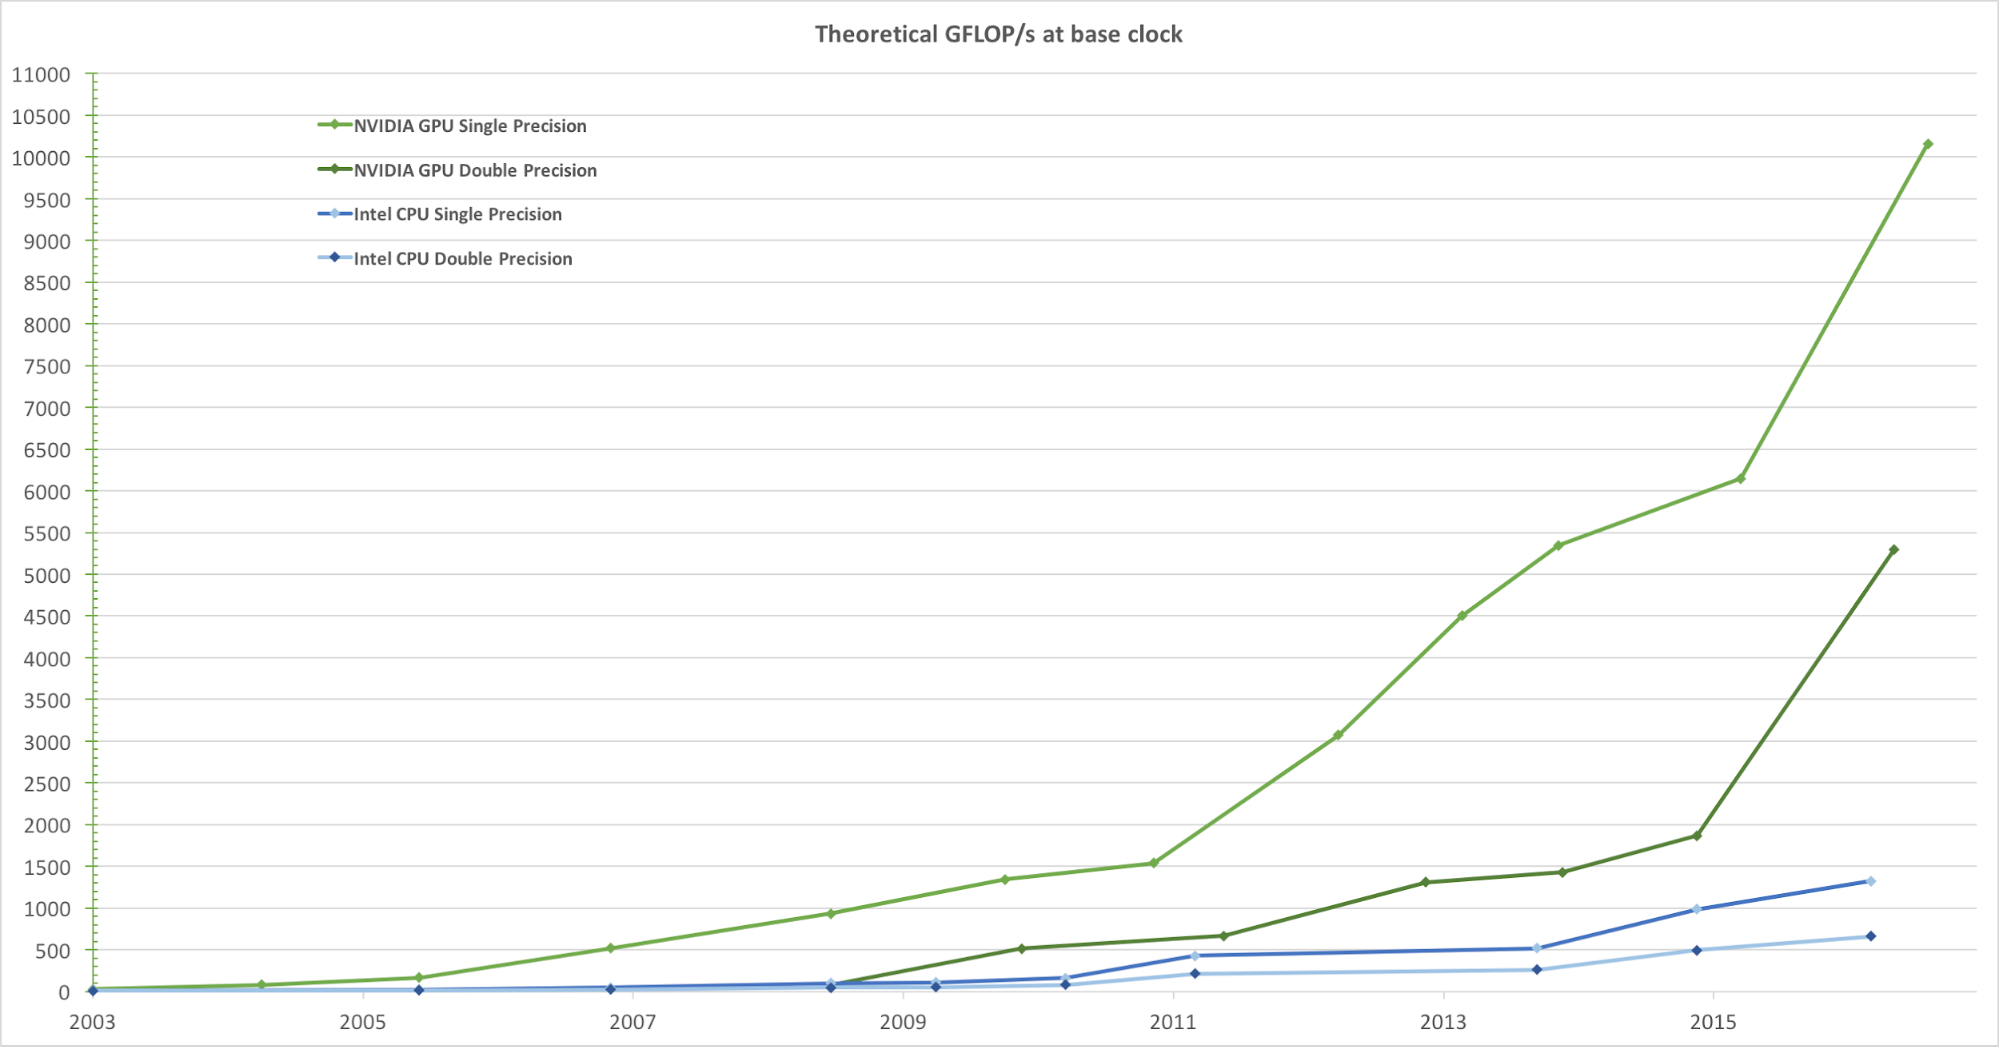
Figure 1. Comparison of CPU and GPU performance on single-precision floating point over several years. The image is taken from Nvidia's CUDA C Programming Guide.
When developing a real-time analysis request mechanism, the decision to integrate the GPU was natural. In Uber, a typical real-time analysis request requires processing data for several days with millions, or even billions of records, then filtering and summarizing them in a short period of time. This computational task fits perfectly into the general-purpose GPU parallel processing model, since they are:
- Process data in parallel with very high speed.
- Provide a higher computation speed (Gflops / s), making it perfect for performing complex computational tasks (data blocks) that can be parallelized.
- Provide better performance (no lag) in data exchange between the computing unit and storage (ALUs and global GPU memory) compared to central processing units (CPUs), making them ideal for processing parallel I / O tasks related to memory, which requires a significant amount of data.
Focusing on the use of a GPU-based analytical database, we - from the perspective of our needs - evaluated several existing analytical solutions that use GPUs:
- Kinetica , a GPU-based analytic tool, hit the market in 2009, initially for use in US military and intelligence agencies. Although it demonstrates the high potential of GPU technology in analytics, we found that for our conditions of use many key functions are missing, including schema modification, partial insertion or updating, data compression, configuration of disk memory and memory at the column level, as well as connection geospatial relationships.
- OmniSci , an open source SQL-based query module, seemed like a promising option, but when evaluating a product, we realized that it lacked some important features for use in Uber, such as deduplication. Although OminiSci unveiled the open source code of its project in 2017, after analyzing their C ++-based solutions, we concluded that neither changing nor ramifying their code base is practically feasible.
- GPU-based real-time analysis tools, including GPUQP , CoGaDB , GPUDB , Ocelot , OmniDB, and Virginian , are often used in academic institutions. However, given their academic goals, these solutions are focused on the development of algorithms and the verification of concepts, and not on solving real problems. For this reason, we did not take them into account - in terms of our size and scale.
In general, these systems demonstrate a huge advantage and potential of data processing using GPU technology, and they inspired us to create our own real-time GPU-based analysis solution adapted to the needs of Uber. Based on these concepts, we developed and opened the AresDB source code.
AresDB Architecture Overview
At a high level, AresDB stores most of the data in the host memory (RAM, which is connected to the CPU), uses the CPU to process the received data, and drives to recover the data. During the request period, AresDB transfers data from host memory to GPU memory for parallel processing to the GPU. As shown in Figure 2 below, AresDB includes storage, metadata, and disk:

Figure 2. AresDB's unique architecture includes storage, disk, and metadata storage.
Tables
Unlike most relational database management systems (RDBMS), AresDB does not have a database or schema scope. All tables belong to the same scope in the same cluster / AresDB instance, allowing users to access them directly. Users store their data in the form of fact tables and dimension tables.
Fact table
The fact table stores an endless stream of time series events. Users use a fact table to store events / facts that occur in real time, and each event is associated with an event time, while the table is often requested by an event time. An example of the type of information that is stored in the fact table is trips, where each trip is an event, and the trip request time is often referred to as an event time. If several time stamps are associated with an event, only one time stamp is specified as the event time and is displayed in the fact table.
Dimension table
The measurement table stores the current characteristics of the objects (including cities, customers and drivers). For example, users can store information about a city, in particular the name of a city, time zone and country, in a dimension table. Unlike fact tables, which are constantly increasing, dimension tables are always limited in size (for example, for Uber, the city table is limited to the actual number of cities in the world). Dimension tables do not require a special time column.
Data types
The table below shows the current data types that are supported in AresDB:
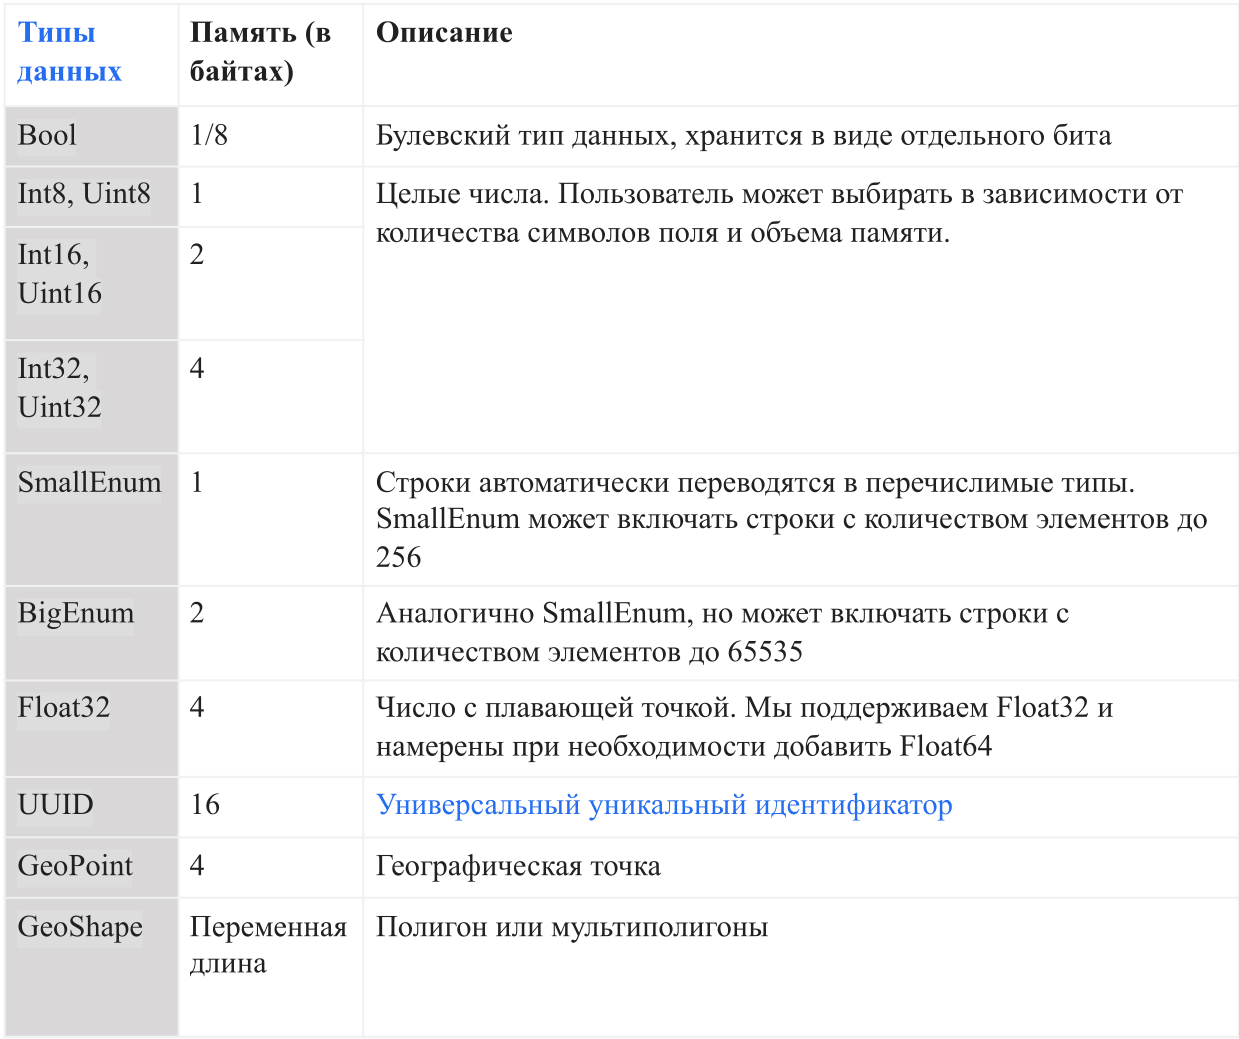
In AresDB, strings are converted to enumerated types (enums) automatically before entering the database, in order to increase the convenience of storage and query efficiency. This allows equality checking to be case sensitive, but does not support advanced operations such as concatenation, substrings, masks, and regular expression matching. In the future, we intend to add the full line support option.
Main functions
The AresDB architecture supports the following functions:
- Compressed column based storage to increase storage efficiency (less memory usage in bytes for data storage) and query efficiency (less data exchange between CPU memory and GPU memory when processing a request)
- Real-time update or insertion with primary key deduplication to improve data accuracy and update real-time data within seconds
- Processing requests using a GPU for highly parallel processing of data on a GPU with a low latency request (from a fraction of a second to several seconds)
Columnar Storage
Vector
AresDB stores all data in a column format. The values of each column are stored as a vector of column values. The confidence / uncertainty marker of the values in each column is stored in a separate zero vector, and the confidence marker of each value is represented as one bit.
Active storage
AresDB stores uncompressed and unsorted column data (active vectors) in the active repository. Data records in the active repository are divided into (active) packages of a given size. New packages are created when data is received, while old packages are deleted after archiving records. The primary key index is used to locate records for deduplication and updates. Figure 3 below shows how we organize active records and use the primary key value to determine their location:
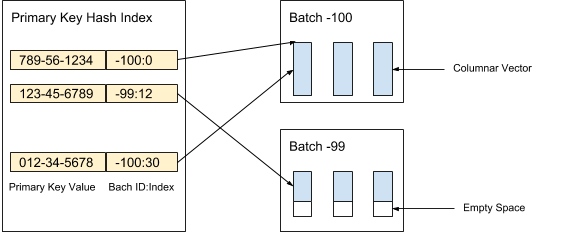
Figure 3. We use the primary key value to determine the location of the packet and the position of each entry within the packet.
The values of each column in a batch are stored as a column vector. The confidence / uncertainty marker of the values in each value vector is stored as a separate zero vector, and the confidence marker of each value is represented as one bit. In Figure 4 below, we offer an example with five values for a column city_id:
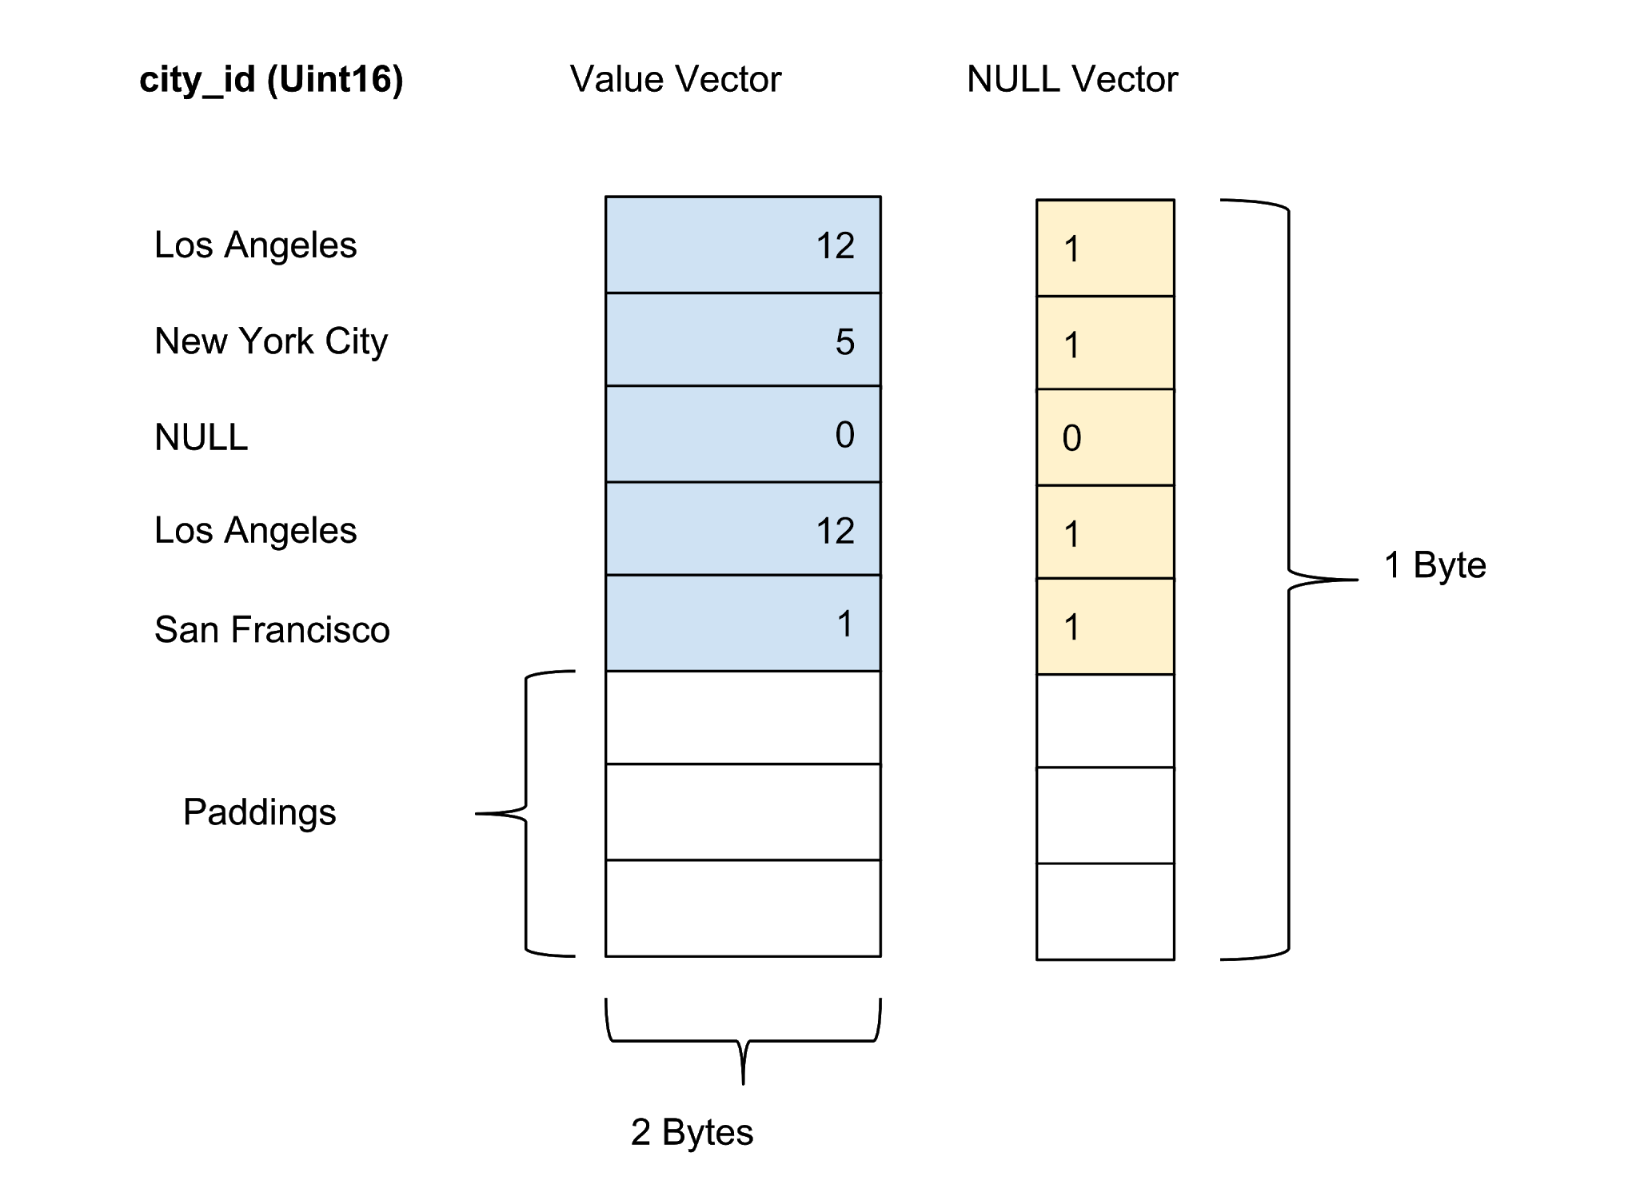
Figure 4. We store values (actual value) and zero vectors (confidence marker) of uncompressed columns in the data table.
Archive storage
AresDB also stores complete, sorted, and compressed columnar data (archive vectors) in archive storage through fact tables. Records in the archive repository are also distributed into packages. Unlike active packages, the archive package keeps records for the day, Coordinated Universal Time (UTC). An archive package uses the number of days as a package identifier since Unix Epoch.
Records are stored in sorted form in accordance with the user-defined column sort order. As shown in Figure 5 below, we sort by column first city_idand then by state column:
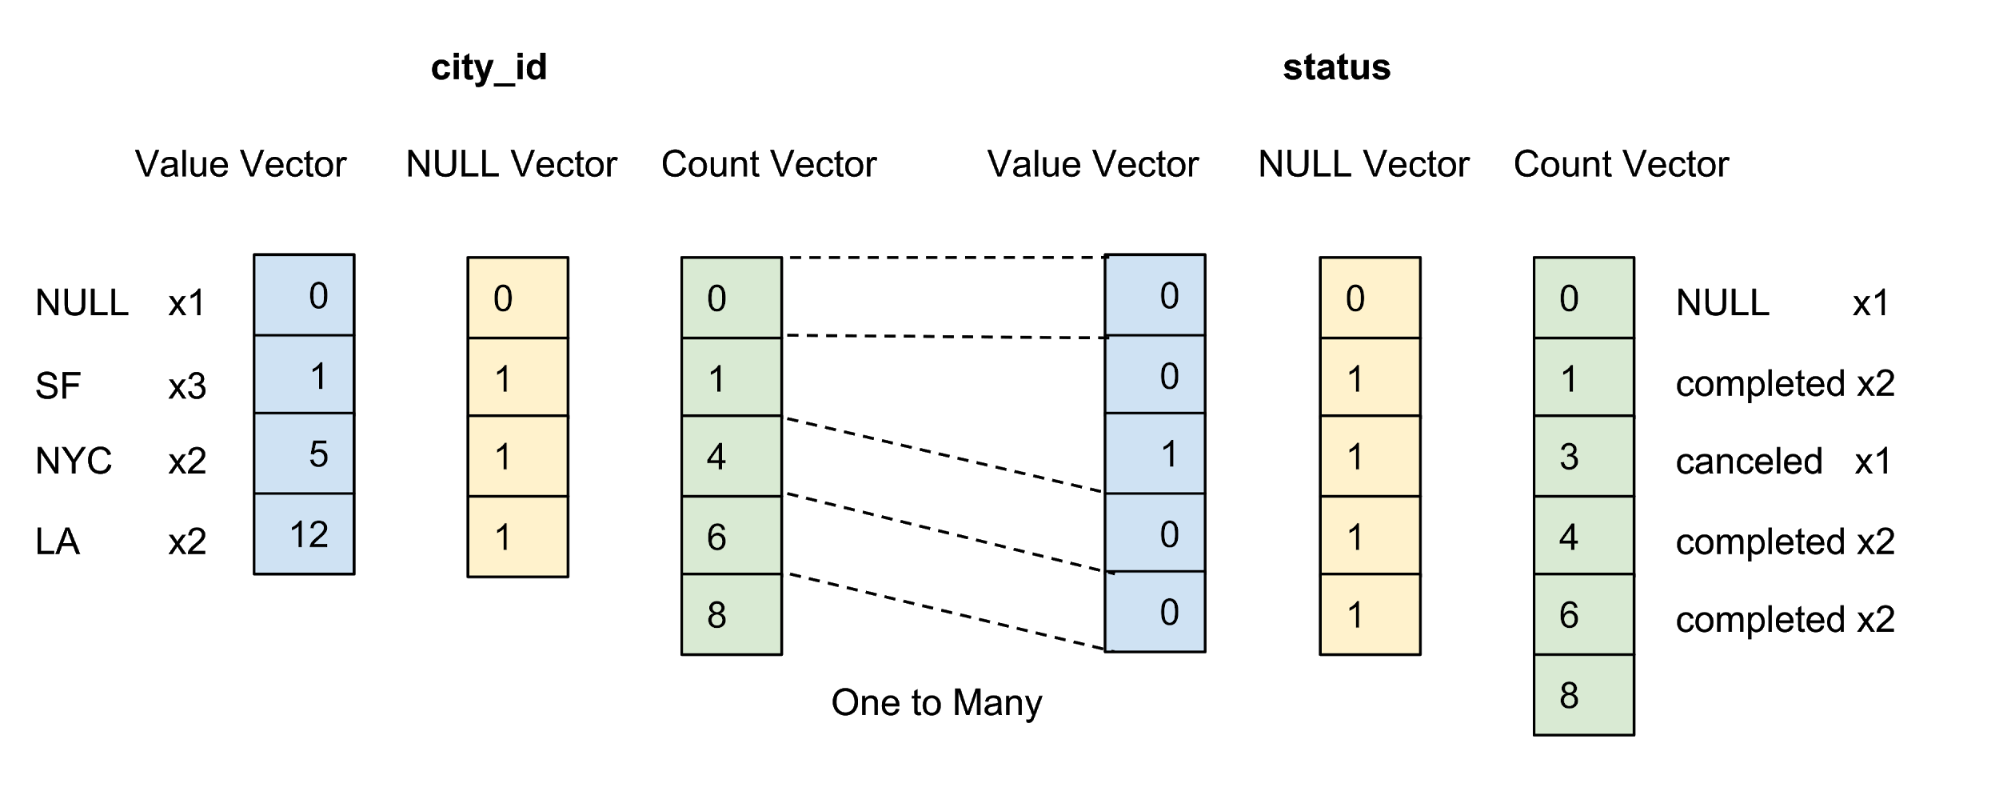
Figure 5. We sort all rows by city_id, then by state, then compress each column by group encoding. After sorting and compression, each column will receive an accounting vector.
The purpose of customizing the sort order of columns by the user is as follows:
- Maximize the compression effect by sorting the columns with a small number of elements first. Maximum compression increases storage efficiency (less bytes is required for data storage) and query efficiency (fewer bytes are transferred between the CPU memory and the GPU memory).
- Providing convenient pre-filtering based on ranges for common equivalent filters, for example city_id = 12. Pre-filtering minimizes the number of bytes needed to transfer data between the CPU memory and the GPU memory, which maximizes query efficiency.
A column is compressed only if it is present in a user-defined sort order. We are not trying to compress columns with a large number of elements, since this gives us a small amount of memory savings.
After sorting, the data for each qualified column is compressed using a specific group coding option. In addition to the value vector and the zero vector, we introduce an accounting vector to re-represent the same value.
Receive real-time data with update and insert functions
Clients get data through the HTTP API by publishing a service pack. The update package is a special ordered binary format that minimizes the use of space while maintaining random access to the data.
When AresDB receives the update package, it first writes the update package to the recovery log. When an update package is added to the end of the event log, AresDB identifies and skips late entries in fact tables for use in the active repository. A record is considered “late” if the event time is located before the archive time of the shutdown event. For records that are not considered late, AresDB uses the primary key index to locate the package within the active repository where they should be inserted. As shown in Figure 6 below, new records (not previously encountered based on the primary key value) are inserted into the empty space, and existing records are updated directly:
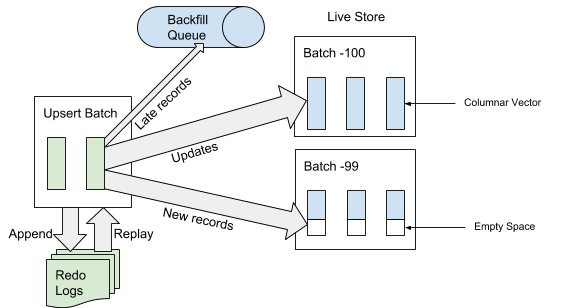
Figure 6. When data is received, after adding the update package to the event log, the “late” entries are added to the back queue, and the other entries are added to the active repository.
Archiving
When data is received, records are either added / updated in the active repository, or added to the back queue waiting to be placed in the archive repository.
We periodically launch a planned process, referred to as archiving, with respect to the records of the active repository to attach new records (records that have never been previously archived) to the archive repository. The archiving process only processes entries in the active storage with an event time in the range between the old shutdown time (shutdown time from the last archiving process) and the new shutdown time (new shutdown time based on the archiving delay parameter in the table schema).
Record event time is used to determine which archive package records should be combined into when packaging archived data into daily packages. Archiving does not require deduplicating the index of the primary key value when merging, since only records in the range between the old and the new off time are archived.
Figure 7 below shows a graph according to the event time of a particular entry.
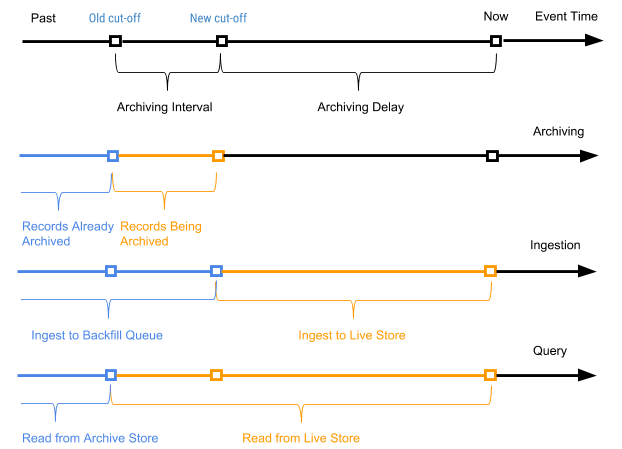
Figure 7. We use event time and trip time to define the records as new (active) and old (the event time is located before the archive time of the trip event).
In this case, the archive interval is the time interval between two archiving processes, and the archive delay is the period after the event time, but before the event can be archived. Both parameters are defined in the schema settings of the AresDB table.
Backfilling
As shown in Figure 7 above, old records (the time of which events are located before the archival time of the disconnection event) are added to the fact tables in reverse queue and ultimately processed as part of the backfill process. Triggers of this process are also the time or the size of the reverse queue, if it reaches the threshold level. Compared to the process of adding data to the active storage, backfilling is asynchronous and relatively more expensive in terms of CPU and memory resources. Backfilling is used in the following scenarios:
- Processing random, very late data
- Manual fixation of historical data from upstream data
- Enter historical data in newly added columns
Unlike archiving, the backfill process is idempotent and requires deduplication based on the value of the primary key. The fill data will eventually be visible for requests.
The backward queue is maintained in memory with a predefined size, and under heavy load backfill the process will be blocked for the client until the queue is cleared by starting the backfill process.
Processing request
In the current implementation, the user needs to use the Ares Query Language (AQL) language created by Uber to execute queries in AresDB. AQL is an effective language for analytic queries on time series and does not follow the standard SQL syntax of the “SELECT FROM WHERE GROUP BY” type, like other languages similar to SQL. Instead, AQL is used in structured fields and can be included in JSON, YAML, and Go objects. For example, instead ВЫБРАТЬ/SELECT пункт(*) ИЗ/FROM ГРУППЫ поездок ПО/GROUP BY city_id, ГДЕ/WHERE статус = «завершено» И/AND request_at >= 1512000000, the equivalent AQL variant in JSON is written as follows:
{
 “table”: “trips”,
 “dimensions”: [
   {“sqlExpression”: “city_id”}
 ],
 “measures”: [
   {“sqlExpression”: “count(*)”}
 ],
;”>  “rowFilters”: [
   “status = ‘completed'”
 ],
 “timeFilter”: {
   “column”: “request_at”,
   “from”: “2 days ago”
 }
}
In the JSON format, AQL offers developers of a dashboard and decision-making system a more convenient software query algorithm than SQL, allowing them to easily compose queries and manipulate them with code, without worrying about things like SQL injection. It acts as a universal query format for typical architectures of web browsers, external and internal servers, up to the database (AresDB). In addition, AQL provides convenient syntax for time filtering and packaging with support for its own time zone. In addition, the language supports a number of functions, such as implicit subqueries, to prevent common errors in queries and facilitates the process of analyzing and rewriting queries for developers of the internal interface.
Despite the many benefits that AQL offers, we are well aware that most engineers are more familiar with SQL. Providing a SQL interface to execute queries is one of the following steps, which we will consider as part of working to improve interaction with AresDB users.
The schema for executing an AQL query is shown in Figure 8 below:
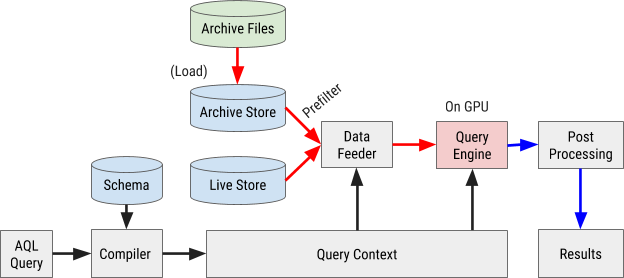
Figure 8. The AresDB query execution scheme uses our own AQL query language to process and retrieve data quickly and efficiently.
Compiling queries
An AQL query is compiled into an internal query context. Expressions in filters, dimensions, and parameters are analyzed in abstract syntax trees (AST) for further processing through the graphics processor (GPU).
Data loading
AresDB uses pre-filters to cheaply filter archived data before sending it to the GPU for parallel processing. Because the archived data is sorted according to the configured column order, some filters may use this sort order and binary search method to establish the appropriate match range. In particular, equivalent filters for all initially sorted X columns and an optional range filter for sorted X + 1 columns can be used as prefilters, as shown in Figure 9 below.

Figure 9. AresDB pre-filters the column data before sending it to the GPU for processing.
After pre-filtering, only green values (matching the filter condition) should be sent to the GPU for parallel processing. Input data is loaded into the GPU and processed one packet at a time. This includes both active packages and archive packages.
AresDB uses CUDA streams for pipelining and data processing. For each request, two threads are alternately applied for processing in two overlapping stages. In Figure 10 below, we propose a graph illustrating this process.
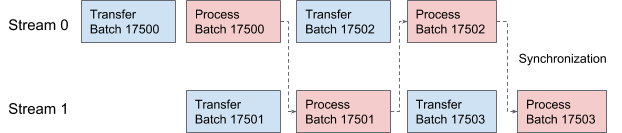
Figure 10. In AresDB, two CUDA streams are alternately involved in the transmission and processing of data.
Request execution
For simplicity, AresDB uses the Thrust library to implement query execution procedures, which offer blocks of a finely tuned parallel algorithm for quickly implementing the current query tool.
In Thrust, input and output vector data are evaluated using random access iterators. Each GPU thread looks for input iterators in its working position, reads the values and performs calculations, and then writes the result to the corresponding position in the output iterator.
To calculate the AresDB expressions, the “one operator per core” (OOPK) model follows.
In Figure 11 below, this procedure is illustrated with an example of an AST generated from a dimension expression request_at – request_at % 86400at the stage of compiling a query:
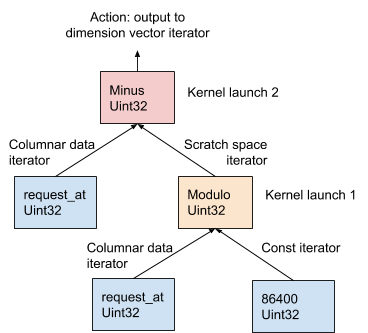
Figure 11. AresDB uses the OOPK model to evaluate expressions.
In the OOPK model, the AresDB query engine traverses each end node of the AST tree and returns an iterator for the source node. If the root node is also final, the root action is performed directly on the input iterator.
For each non-root non-terminal node ( modular operation in this example), a temporary working space vector is allocated to store the intermediate result obtained from the expression request_at% 86400. With Thrust, the kernel function is run to calculate the result for this operator in the GPU. Results are stored in the workspace iterator.
For the root node, the kernel function runs in the same way as for a non-root, non-finite node. Various output actions are performed based on the type of expression, as described in detail below:
- Filtering to reduce the number of elements of the input vectors
- Record measurement output in a measurement vector for later data fusion
- Writing parameter output to a parameter vector for later data merging
After the expression is evaluated, the sorting and transformation are performed to finally merge the data. In the operations of sorting and transformation, we use the values of the dimension vector as the key values of sorting and transformation, and the values of the vector of parameters as the values for combining data. Thus, rows with similar measurement values are grouped and merged. Figure 12 below shows this sorting and conversion process.
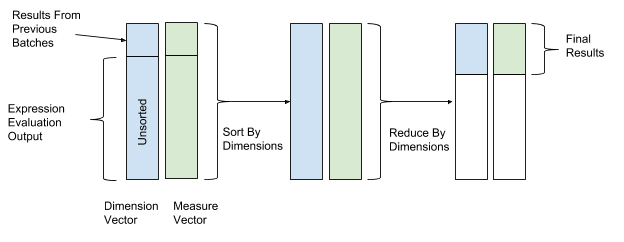
Figure 12. After calculating the expression, AresDB sorts and converts the data by the key values of the measurement vectors (key value) and parameters (value).
AresDB also supports the following advanced query features:
- Join : currently AresDB supports the join option by hashing between the fact table and the dimension table
- Estimation of the number of elements Hyperloglog : Hyperloglog is used in AresDB
- Geo Intersect : currently AresDB only supports interrelated operations between GeoPoint and GeoShape
Resource management
Being a database based on internal memory, AresDB must manage the following types of memory usage:
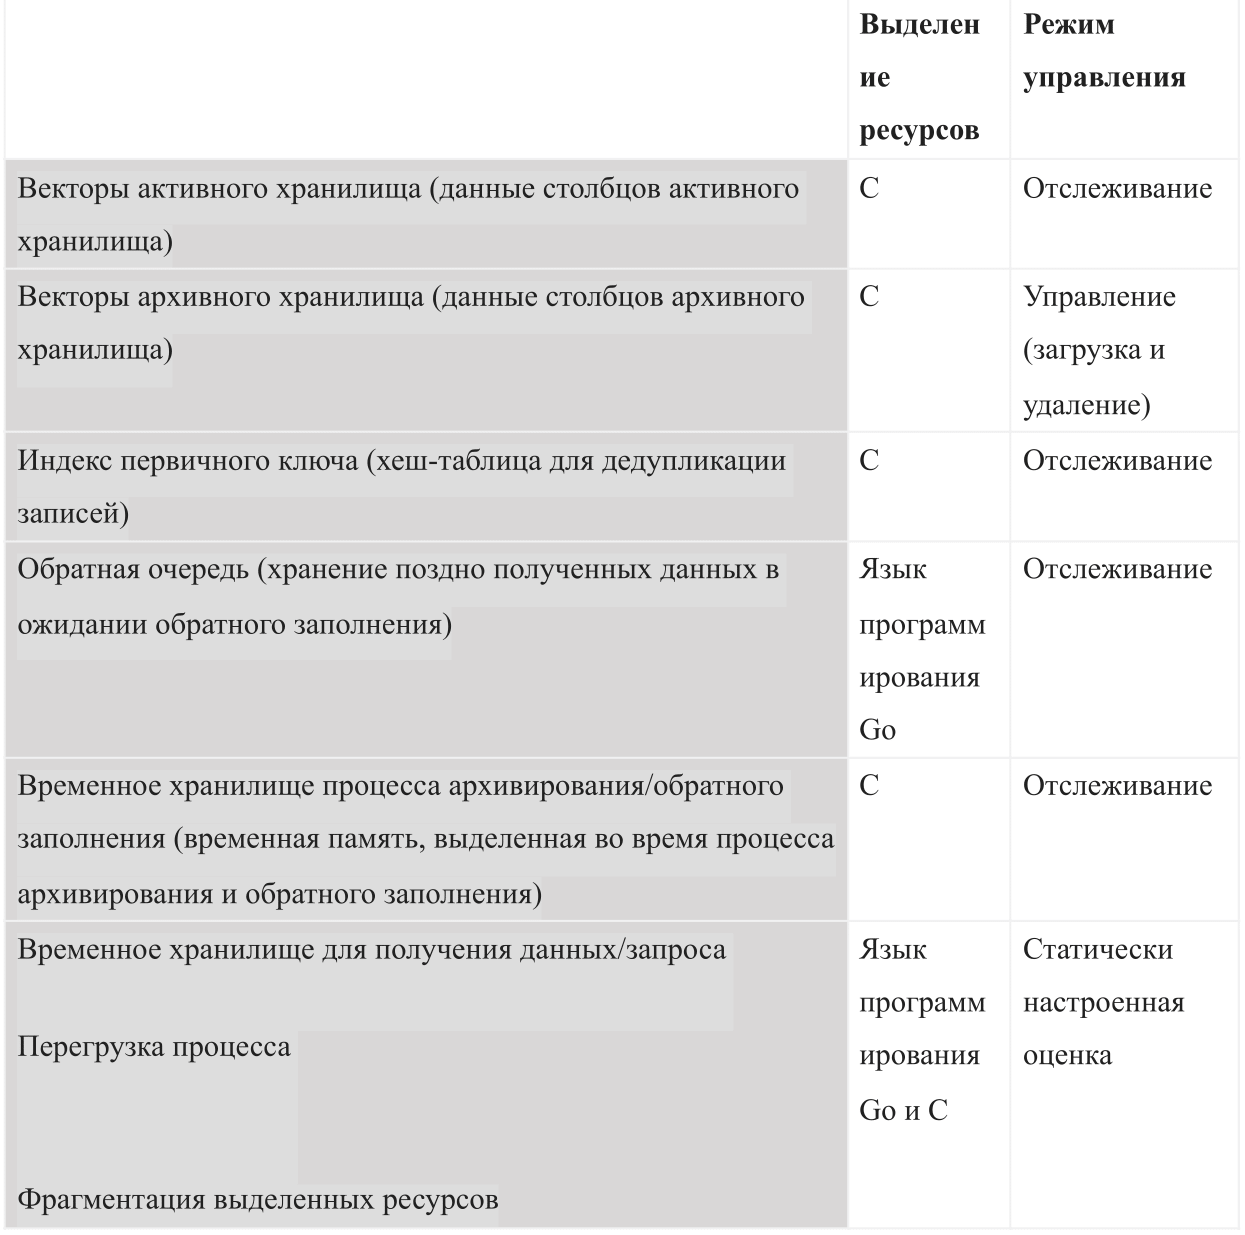
When you run AresDB, it uses the configured total memory budget. The budget is divided into all six types of memory and must also leave enough space for the operating system and other processes. This budget also includes a statically configured overload estimate, active data storage monitored by the server, and historical data that the server may decide to load and delete, depending on the remaining memory budget.
Figure 13 below shows the memory model of the AresDB host.
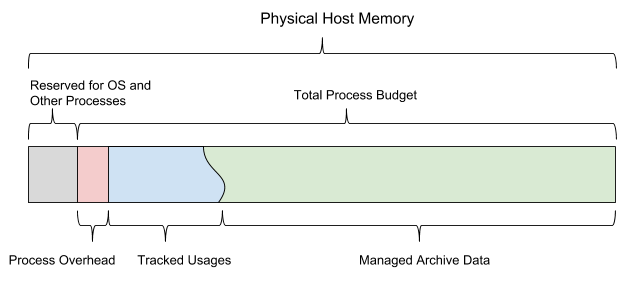
Figure 13. AresDB manages its own memory usage so that it does not exceed the configured overall process budget.
AresDB allows users to set up pre-load days and column-level priorities for fact tables and preloads archived data only on pre-load days. Data that is not preloaded is loaded into memory from disk on demand. When filled, AresDB also deletes archived data from host memory. The principles of AresDB removal are based on the following parameters: the number of days of preloading, the priorities of the columns, the day of the package and the size of the column.
AresDB also manages multiple GPU devices and simulates device resources like GPU threads and device memory, tracking GPU memory usage for processing requests. AresDB manages GPU devices through a device manager, which models the resources of a GPU device in two dimensions (GPU threads and device memory) and monitors memory usage when processing requests. After compiling a query, AresDB allows users to estimate the amount of resources required to execute the query. Device memory requirements must be met before the request is resolved; if there is not enough memory on any device at the moment, the request should wait for execution. Currently, AresDB can perform one or more requests on a single GPU device at the same time, if the device meets all resource requirements.
In the current implementation, AresDB does not cache input data in the device for reuse in multiple requests. AresDB aims to support queries to datasets that are constantly updated in real time and poorly amenable to correct caching. In future versions of AresDB, we intend to implement data caching functions in the GPU memory, which will help optimize query performance.
Usage example: Uber overview dashboard
In Uber, we use AresDB to create dashboards for getting business information in real time. AresDB is responsible for storing primary events with constant updates and calculating critical metrics for them in a fraction of a second thanks to GPU resources at low cost, so users can use dashboards in interactive mode. For example, anonymized travel data that has a long lifetime in the data warehouse is updated by several services, including our dispatching system, payment systems and estimates. To efficiently use travel data, users divide and split data across multiple dimensions to get an idea of real-time decisions.
When using AresDB, the Uber dashboard is a widely used analysis dashboard that is used by in-company teams to generate relevant metrics and real-time response to improve user experience.
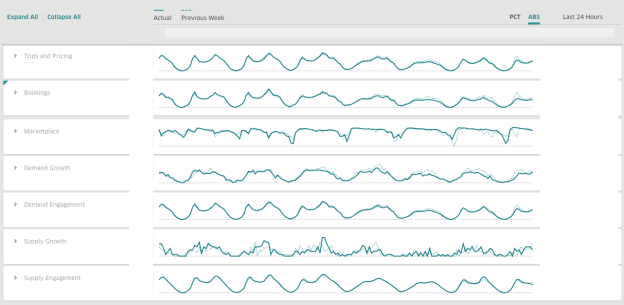
Figure 14. In hourly mode, the Uber overview info panel uses AresDB to view real-time data analytics for specific periods.
To create the layout of the information panel above, we modeled the following tables:
Trips (fact table)

Cities (dimension table)

Schema tables in AresDB
To create two simulated tables described above, we first need to create tables in AresDB according to the following schemes:
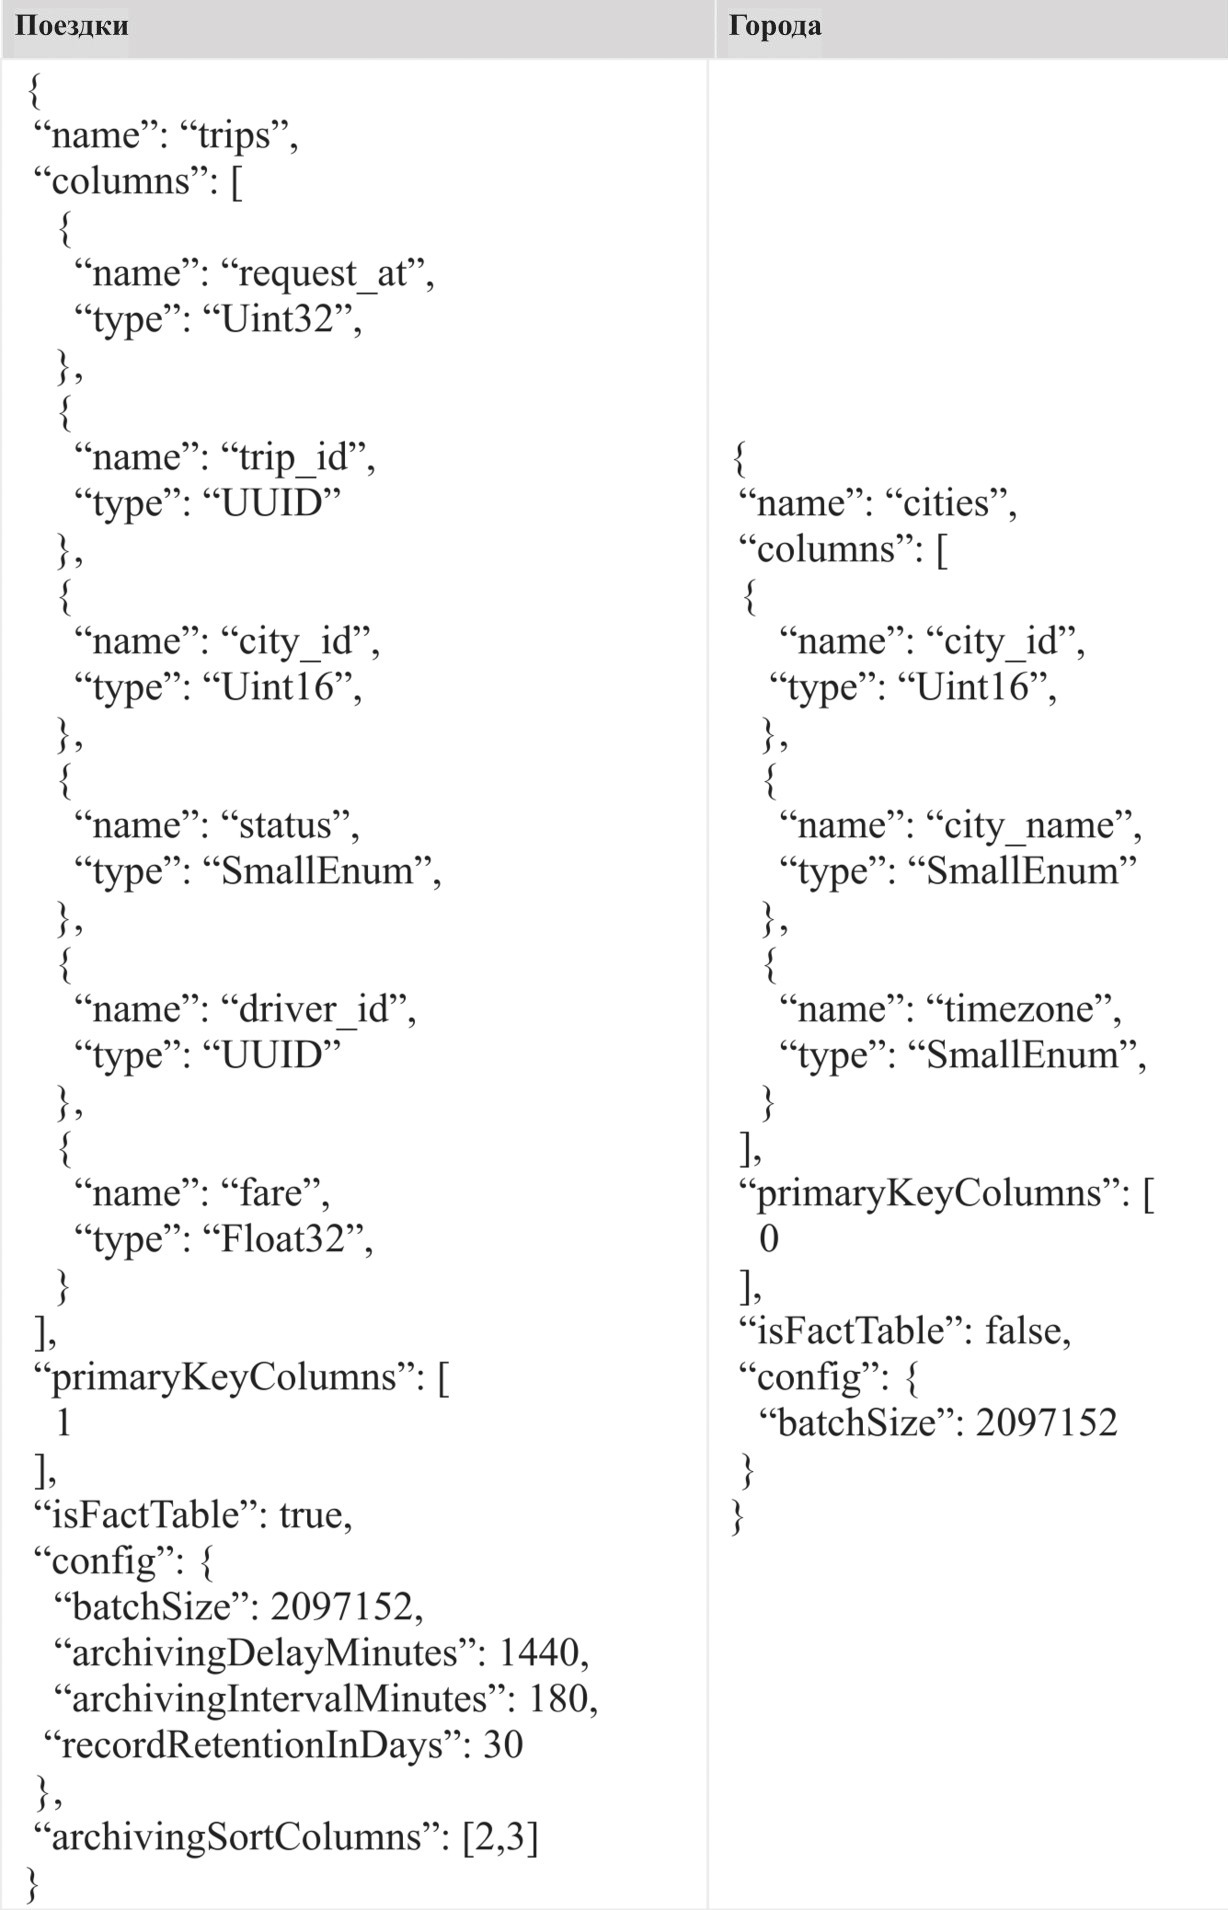
As described in the diagram, travel tables are created as fact tables that reflect travel events occurring in real time, and city tables are created as dimension tables that store information about actual cities.
After creating the tables, users can use the AresDB client library to load data from an event bus, such as Apache Kafka , or from streaming or batch processing platforms, such as Apache Flink or Apache Spark .
Request examples for AresDB
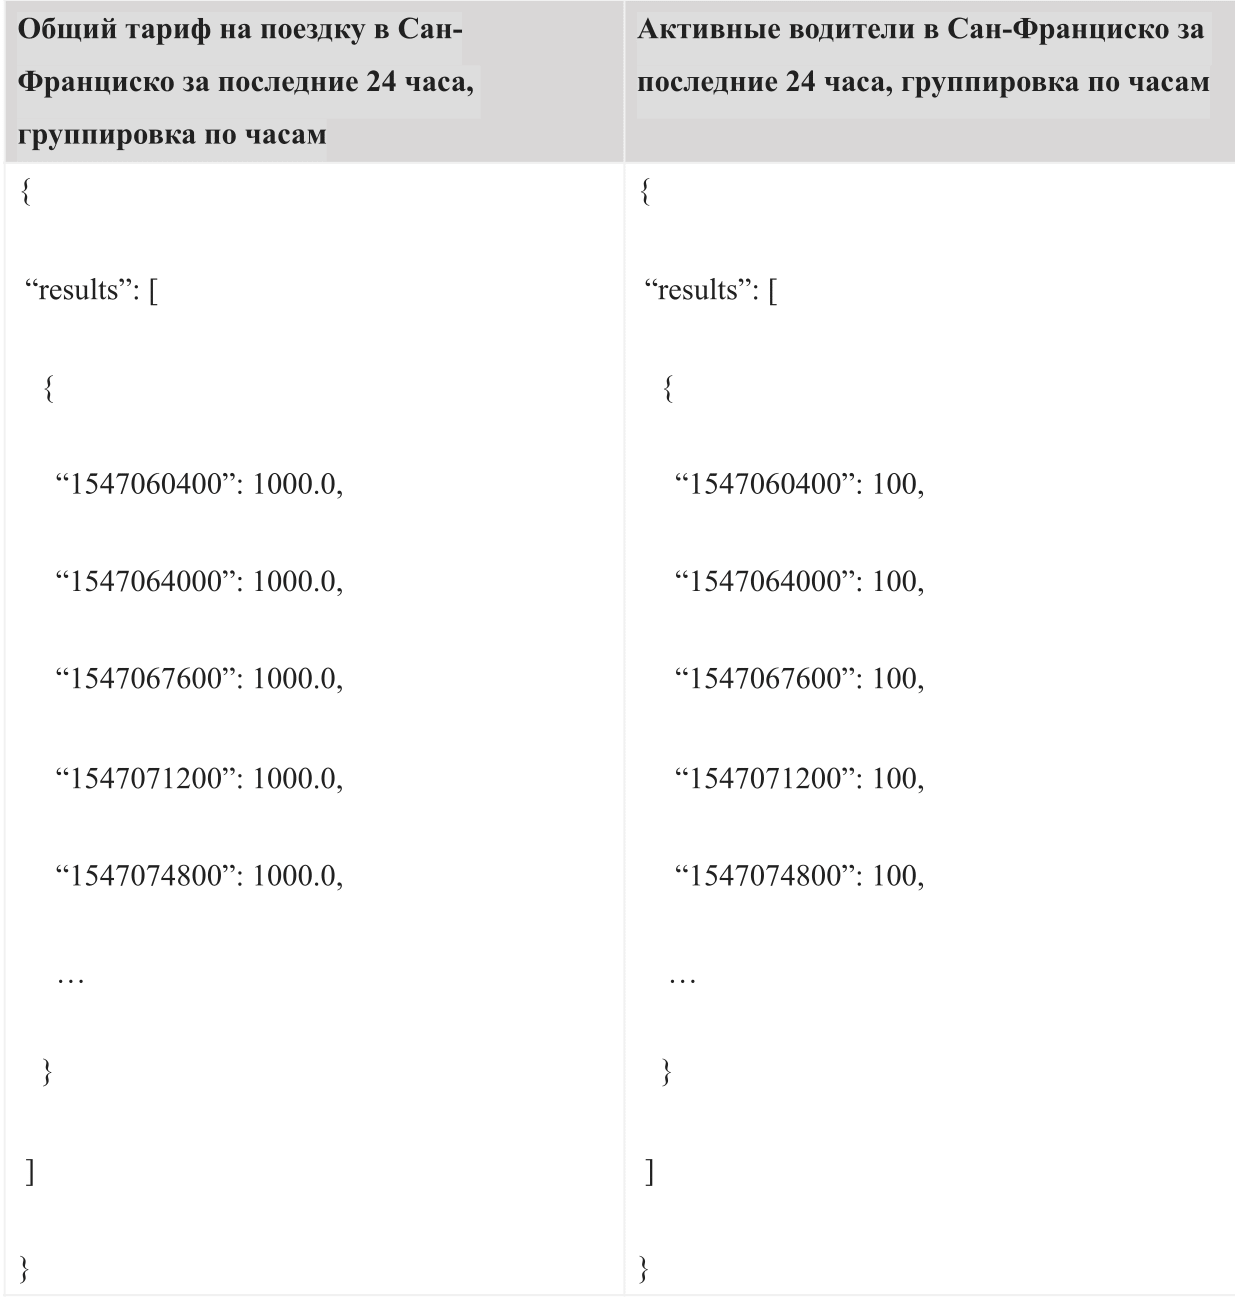
In the test dashboards, we select two metrics as an example, “total fare per trip” and “active drivers”. In the dashboard, users can filter the city by metrics, such as San Francisco. To display time series for these two metrics for the last 24 hours, you can run the following AQL queries in the dashboards:
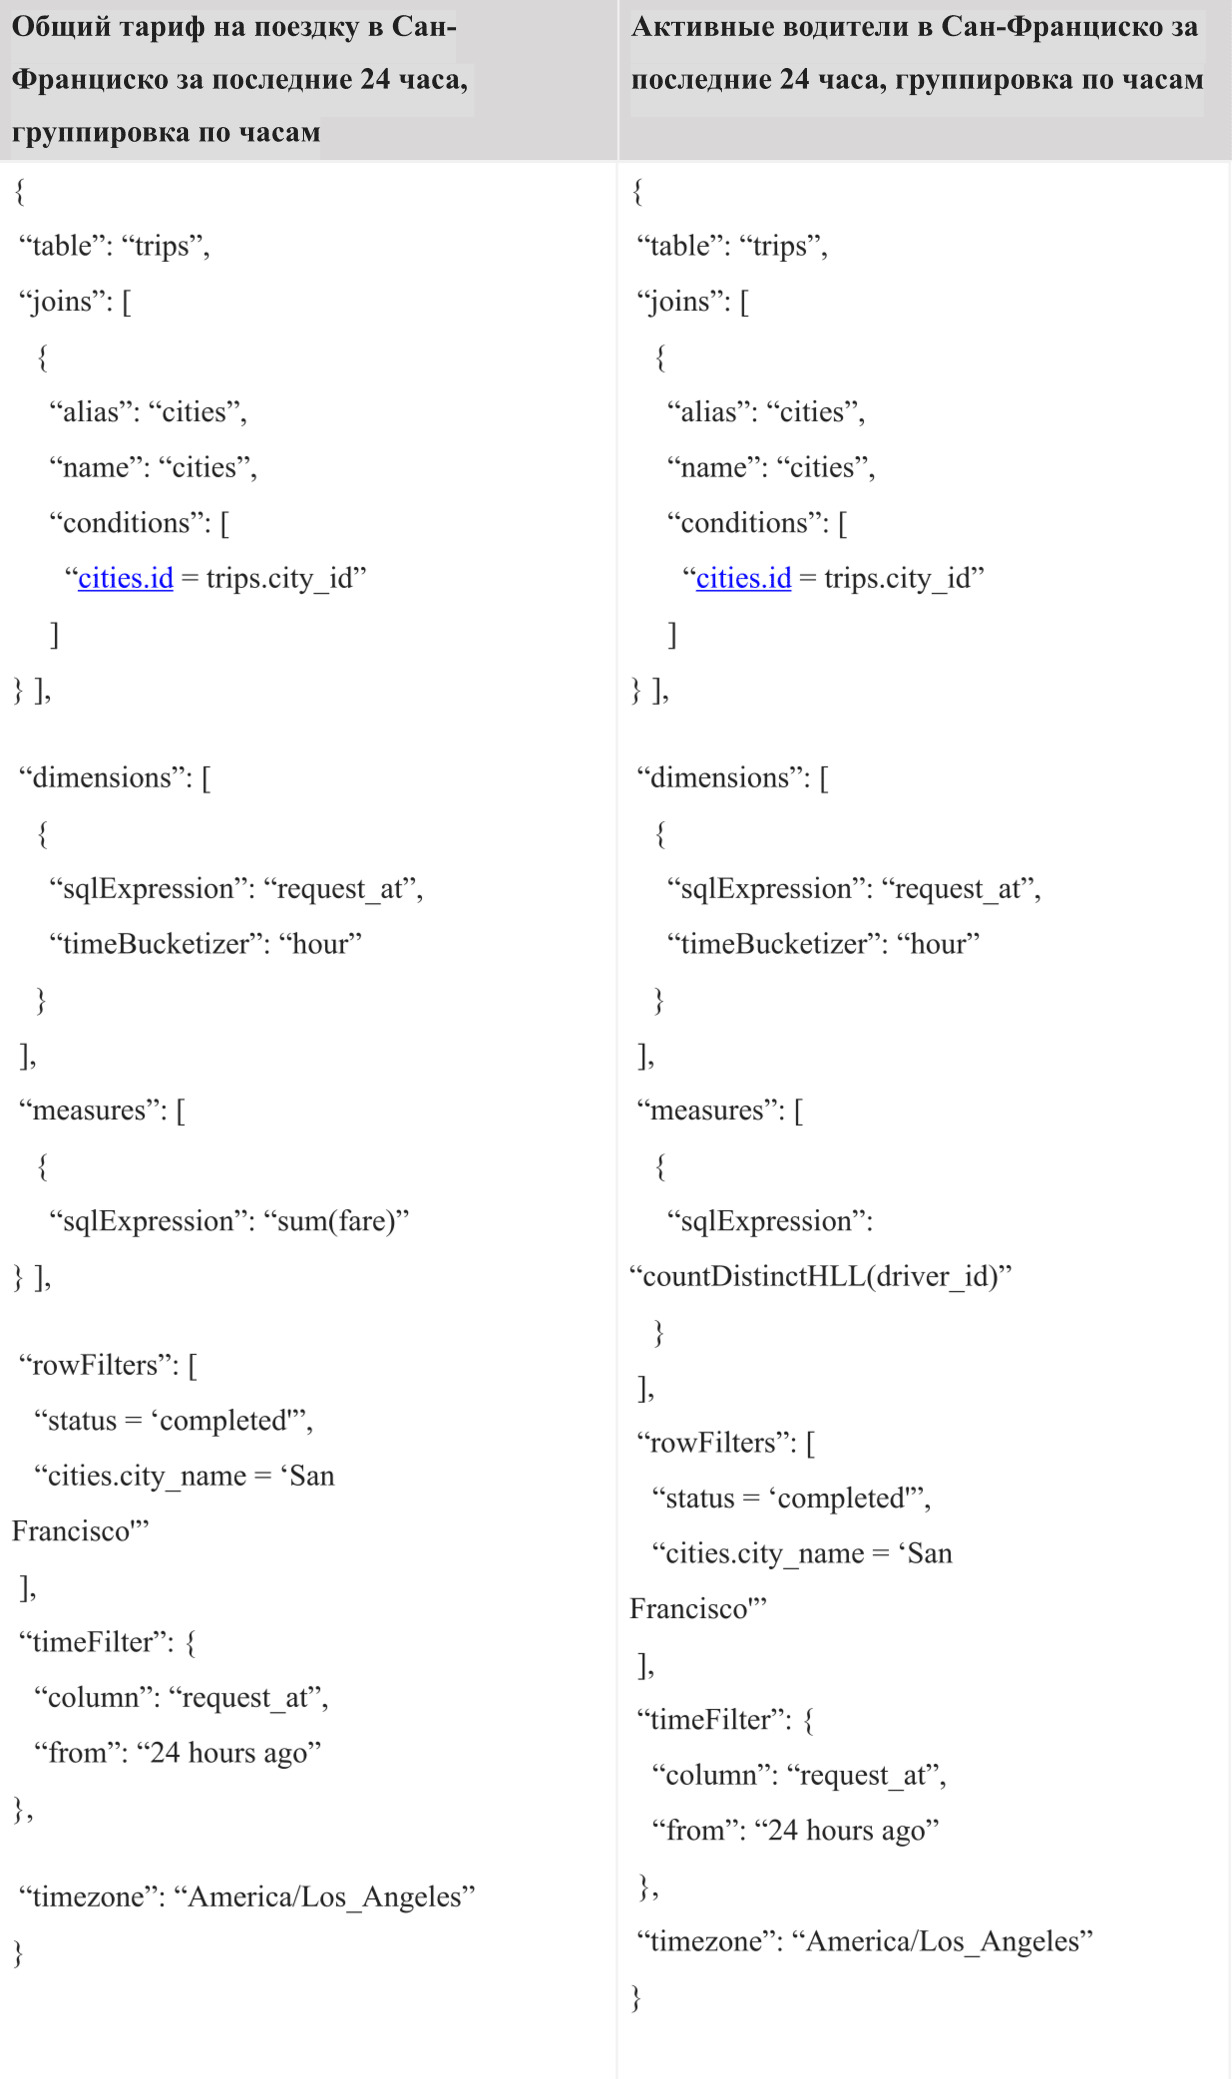
Example results for the query:
The result of the above test queries will be the following time series, which can be easily represented on the time series graphs, as shown below.
In the example above, we demonstrated how AresDB can be used to receive primary events that occur in real time for a few seconds and immediately execute arbitrary user data queries to calculate metrics in a fraction of a second. AresDB helps engineers create data processing tools that define business-critical metrics, which require real-time understanding of human or automatic solutions.
Next steps
AresDB is widely used in Uber to support real-time data analysis dashboards, which allows you to make appropriate decisions based on data on many aspects of the business. By opening the source code of this tool, we hope that other members of the community will be able to use AresDB for their analytical purposes.
In the future, we intend to add the following functions to the project:
- Distributed design : we are working to create a distributed design functionality in AresDB, including replication, separation management and circuit management, to increase the level of scalability and reduce operating costs.
- Developer support and tools : since the opening of the AresDB source code in November 2018, we have been working to create more intuitive tools, reorganize code structures and expand documentation to improve user interaction, which will allow developers to quickly integrate AresDB into their analytical system.
- Extended feature set : we also plan to expand the feature set of the query to include features such as window functions and merge functions using nested loops, which will allow the tool to support more use cases.
- Optimization of the query mechanism : we are also going to develop more efficient ways to optimize query performance, for example, based on a low-level virtual machine (LLVM) and GPU memory caching.
AresDB is open source under the Apache license. We invite you to try AresDB and join our community.
If you are interested in the development of technologies for large-scale data analysis in real time, think about applying for work in our team.
Thanks
Special thanks to Kate Zhang, Jennifer Anderson, Nikhil Joshi, Abhi Khune, Shengyue Ji, Chinmay Soman, Xiang Fu (Xi Xi), Chinmay Soman, Xiang Fu (Xi Xi), Chinmay Soman, Xian Fu (Xin) , David Chen and Li Ning for ensuring the incredible success of this project!