Datatable Python Package Overview
- Transfer
“Five exabytes of information were created by humanity from the moment of the birth of civilization until 2003, but the same amount is being created every two days. Eric Schmidt

Datatable is a Python library for performing efficient multi-threaded data processing. Datatable supports datasets that do not fit in memory.
If you write in R, then you are probably already using the package
The package
What is the use of data mining for Python? The thing is that there is a Python package

Modern machine learning systems need to process monstrous amounts of data and generate many features. This is necessary to build as accurate models as possible. A Python module
This toolkit is very similar to pandas , but it is more focused on providing high speed data processing and supporting large data sets. Package developers
On MacOS,
On Linux, installation is done from binary distributions:
At the moment, it
Installation details
The code that will be used in this article can be found in this GitHub repository or here at mybinder.org.
The data set with which we will experiment here is taken from Kaggle ( Lending Club Loan Data Dataset ). This set consists of complete data on all loans issued in 2007-2015, including the current status of the loan (Current, Late, Fully Paid, etc.) and the latest payment information. The file consists of 2.26 million rows and 145 columns. The size of this data set is ideal for demonstrating the capabilities of the library
Let's load the data into an object
The above function
In addition, the parser
Now let's see how long it takes
You can see that it is
An existing
Let's try to transform an existing object
It seems that reading a file into an object
Consider the basic properties of an object
Here we have access to the method

The first 10 lines of the Frame object from the datatable Header
colors indicate the data type. Red indicates lines, green indicates integers, blue indicates floating-point numbers.
Computing summary statistics in
We calculate the average value in the columns using
Apparently,
Working with datatable data using square brackets
In mathematics, when working with matrices, view constructs are also used
The following code selects all rows from a column

Selecting all rows of a funded_amnt column
Here's how to select the first 5 rows and 3 columns:
Selection of the first 5 rows and 3 columns
Sort the data set by the selected column:
Note the significant difference in time required for sorting
Here's how to remove a column named
Datatable, like
Here you can see the use of the design
The filtering syntax is similar to the grouping syntax. We filter those lines
The contents of the object
You
The Python module
Dear readers! Do you plan to use the package


Datatable is a Python library for performing efficient multi-threaded data processing. Datatable supports datasets that do not fit in memory.
If you write in R, then you are probably already using the package
data.table. Data.table is an extension of the data.frame R package . In addition, those who use R to quickly aggregate large data sets cannot do without this package (we are talking, in particular, about 100 GB of data in RAM). The package
data.tablefor R is very flexible and productive. Using it is easy and convenient, the programs in which it is used are written quite quickly. This package is widely known among R-programmers. It is downloaded more than 400 thousand times a month, it is used in almost 650 CRAN and Bioconductor packages (source ). What is the use of data mining for Python? The thing is that there is a Python package
datatablethat is an analogue data.tablefrom the world of R. The package is datatableclearly focused on processing large data sets. It is characterized by high performance - both when working with data that is fully placed in RAM, and when working with data whose size exceeds the amount of available RAM. It supports multi-threaded data processing. In general, the datatable package can be called the younger brother of data.table .Datatable
Modern machine learning systems need to process monstrous amounts of data and generate many features. This is necessary to build as accurate models as possible. A Python module
datatablewas created to solve this problem. This is a set of tools for performing operations with large (up to 100 GB) data volumes on a single computer at the highest possible speed. The development sponsor datatableis H2O.ai , and the first user of the package is Driverless.ai . This toolkit is very similar to pandas , but it is more focused on providing high speed data processing and supporting large data sets. Package developers
datatableIn addition, they strive to make it convenient for users to work with it. It is, in particular, a powerful API and well-thought-out error messages. In this article we will talk about how to use datatableit and how it looks in comparison with the pandasprocessing of large data sets.Installation
On MacOS,
datatableyou can easily install using pip:pip install datatableOn Linux, installation is done from binary distributions:
# Для Python 3.5
pip install https://s3.amazonaws.com/h2o-release/datatable/stable/datatable-0.8.0/datatable-0.8.0-cp35-cp35m-linux_x86_64.whl
# Для Python 3.6
pip install https://s3.amazonaws.com/h2o-release/datatable/stable/datatable-0.8.0/datatable-0.8.0-cp36-cp36m-linux_x86_64.whl
At the moment, it
datatabledoes not work under Windows, but work is underway in this direction, so Windows support is only a matter of time. Installation details
datatablecan be found here . The code that will be used in this article can be found in this GitHub repository or here at mybinder.org.
Reading data
The data set with which we will experiment here is taken from Kaggle ( Lending Club Loan Data Dataset ). This set consists of complete data on all loans issued in 2007-2015, including the current status of the loan (Current, Late, Fully Paid, etc.) and the latest payment information. The file consists of 2.26 million rows and 145 columns. The size of this data set is ideal for demonstrating the capabilities of the library
datatable.# Импортируем необходимые библиотеки
import numpy as np
import pandas as pd
import datatable as dtLet's load the data into an object
Frame. The basic unit of analysis in datatableis Frame. This is the same as DataFramefrom pandasor an SQL table. Namely, we are talking about data organized as a two-dimensional array in which rows and columns can be distinguished.▍Data loading using datatable
%%time
datatable_df = dt.fread("data.csv")
____________________________________________________________________
CPU times: user 30 s, sys: 3.39 s, total: 33.4 s
Wall time: 23.6 s
The above function
fread()is a powerful and very fast mechanism. It can automatically detect and process parameters for the vast majority of text files, download data from .ZIP archives and Excel files, retrieve data by URL, and much more. In addition, the parser
datatablehas the following features:- It can automatically detect delimiters, headings, column types, character escaping rules, and so on.
- He can read data from various sources. Among them are the file system, URL, command shell, raw text, archives.
- He is able to perform multithreaded data reading for maximum performance.
- It displays a progress indicator when reading large files.
- It can read files that are compliant and not compliant with RFC4180 .
▍Downloading data using pandas
Now let's see how long it takes
pandasto read the same file.%%time
pandas_df= pd.read_csv("data.csv")
___________________________________________________________
CPU times: user 47.5 s, sys: 12.1 s, total: 59.6 s
Wall time: 1min 4sYou can see that it is
datatableclearly faster pandaswhen reading large data sets. Pandasin our experiment, it takes more than a minute, and the time required datatableis measured in seconds.Frame Object Conversion
An existing
Framepackage object datatablecan be converted to DataFramenumpyor pandas. It is done like this:numpy_df = datatable_df.to_numpy()
pandas_df = datatable_df.to_pandas()Let's try to transform an existing object
Framedatatableinto an object DataFramepandasand look at how long it will take.%%time
datatable_pandas = datatable_df.to_pandas()
___________________________________________________________________
CPU times: user 17.1 s, sys: 4 s, total: 21.1 s
Wall time: 21.4 sIt seems that reading a file into an object
Framedatatableand then converting this object to an object DataFramepandastakes less time than loading data into DataFrametools pandas. Therefore, it is possible, if it is planned to process large amounts of data with the help pandas, it would be better to load them with funds datatable, and then convert to DataFrame.type(datatable_pandas)
___________________________________________________________________
pandas.core.frame.DataFrameBasic properties of the Frame object
Consider the basic properties of an object
Framefrom datatable. They are very similar to similar properties of an object DataFramefrom pandas:print(datatable_df.shape) # (количество строк, количество столбцов)
print(datatable_df.names[:5]) # имена первых 5 столбцов
print(datatable_df.stypes[:5]) # типы первых 5 столбцов
______________________________________________________________
(2260668, 145)
('id', 'member_id', 'loan_amnt', 'funded_amnt', 'funded_amnt_inv')
(stype.bool8, stype.bool8, stype.int32, stype.int32, stype.float64)Here we have access to the method
head()that displays the nfirst lines:datatable_df.head(10)The first 10 lines of the Frame object from the datatable Header
colors indicate the data type. Red indicates lines, green indicates integers, blue indicates floating-point numbers.
Summary Statistics
Computing summary statistics in
pandasis an operation that takes a lot of memory to complete. In the case of datatablethis is not so. Here are the commands you can use to calculate various metrics in datatable:datatable_df.sum() datatable_df.nunique()
datatable_df.sd() datatable_df.max()
datatable_df.mode() datatable_df.min()
datatable_df.nmodal() datatable_df.mean()We calculate the average value in the columns using
datatableand pandasand analyze the time required to complete this operation.▍ Finding average using datatable
%%time
datatable_df.mean()
_______________________________________________________________
CPU times: user 5.11 s, sys: 51.8 ms, total: 5.16 s
Wall time: 1.43 s
▍ Finding the average using pandas
pandas_df.mean()
__________________________________________________________________
Throws memory error.
Apparently,
pandaswe were not able to get the result - an error related to memory was issued.Data manipulation
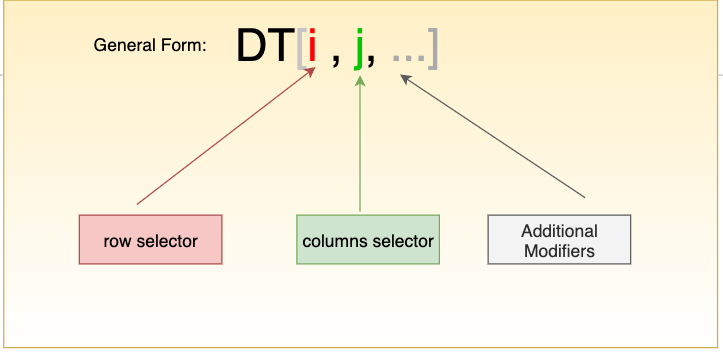
Frameand DataFrame- these are data structures that are tables. In datatableto perform data manipulations, square brackets are used. This is similar to how they work with conventional matrices, but here when using square brackets, you can use additional features.Working with datatable data using square brackets
In mathematics, when working with matrices, view constructs are also used
DT[i, j]. Similar structures can be found in the C, C ++ and R languages, in packages pandasand numpy, as well as in many other technologies. Consider performing common data manipulations in datatable.▍ Forming Row or Column Samples
The following code selects all rows from a column
funded_amnt:datatable_df[:,'funded_amnt']Selecting all rows of a funded_amnt column
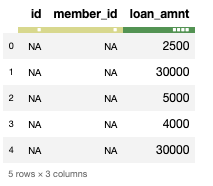
Here's how to select the first 5 rows and 3 columns:
datatable_df[:5,:3]Selection of the first 5 rows and 3 columns
▍Sorting data using datatable
Sort the data set by the selected column:
%%time
datatable_df.sort('funded_amnt_inv')
_________________________________________________________________
CPU times: user 534 ms, sys: 67.9 ms, total: 602 ms
Wall time: 179 ms
▍Sorting data using pandas
%%time
pandas_df.sort_values(by = 'funded_amnt_inv')
___________________________________________________________________
CPU times: user 8.76 s, sys: 2.87 s, total: 11.6 s
Wall time: 12.4 s
Note the significant difference in time required for sorting
datatableand pandas.▍Delete rows and columns
Here's how to remove a column named
member_id:del datatable_df[:, 'member_id']Grouping
Datatable, like
pandas, supports the ability to group data. Let's look at how to get the average of a column funded_amoundin which data is grouped by column grade.▍Grouping data using datatable
%%time
for i in range(100):
    datatable_df[:, dt.sum(dt.f.funded_amnt), dt.by(dt.f.grade)]
____________________________________________________________________
CPU times: user 6.41 s, sys: 1.34 s, total: 7.76 s
Wall time: 2.42 s
Here you can see the use of the design
.f. This is the so-called frame proxy - a simple mechanism that allows you to refer to the object Framewith which some actions are currently being performed. In our case dt.f, this is the same as datatable_df.▍Grouping data using pandas
%%time
for i in range(100):
    pandas_df.groupby("grade")["funded_amnt"].sum()
____________________________________________________________________
CPU times: user 12.9 s, sys: 859 ms, total: 13.7 s
Wall time: 13.9 s
Line filtering
The filtering syntax is similar to the grouping syntax. We filter those lines
loan_amntfor which the value is loan_amntgreater than funded_amnt.datatable_df[dt.f.loan_amnt>dt.f.funded_amnt,"loan_amnt"]Saving a Frame Object
The contents of the object
Framecan be written to a CSV file, which allows the use of data in the future. It is done like this:datatable_df.to_csv('output.csv')You
datatablecan read about other methods for working with data here .Summary
The Python module
datatableis definitely faster than many people are used to pandas. It is also a boon for those who need to process very large data sets. So far, the only minus datatablein comparison with pandasis the amount of functionality. However, active work is underway datatable, so it is quite possible that in the future it datatablewill surpass pandasin all directions. Dear readers! Do you plan to use the package
datatablein your projects?