Some aspects of monitoring MS SQL Server. Recommendations for setting trace flags
- Tutorial
Foreword
Quite often, users, developers and administrators of MS SQL Server DBMSs face database performance problems or DBMS in general, therefore monitoring of MS SQL Server is very relevant.
This article is an addition to the article Using Zabbix to monitor the MS SQL Server database and it will examine some aspects of monitoring MS SQL Server, in particular: how to quickly determine what resources are missing, as well as recommendations for setting trace flags.
For the following scripts to work, you must create the inf schema in the desired database as follows:
Creating an inf schema
use <имя_БД>;
go
createschema inf;
Method for detecting a shortage of RAM
The first indicator of a lack of RAM is the case when an instance of MS SQL Server eats up all the RAM allocated to it.
To do this, create the following inf.vRAM view:
Creating an inf.vRAM View
CREATEview [inf].[vRAM] asselect a.[TotalAvailOSRam_Mb]						--сколько свободно ОЗУ на сервере в МБ
		 , a.[RAM_Avail_Percent]					--процент свободного ОЗУ на сервере
		 , a.[Server_physical_memory_Mb]				--сколько всего ОЗУ на сервере в МБ
		 , a.[SQL_server_committed_target_Mb]			--сколько всего ОЗУ выделено под MS SQL Server в МБ
		 , a.[SQL_server_physical_memory_in_use_Mb] 		--сколько всего ОЗУ потребляет MS SQL Server в данный момент времени в МБ
		 , a.[SQL_RAM_Avail_Percent]				--поцент свободного ОЗУ для MS SQL Server относительно всего выделенного ОЗУ для MS SQL Server
		 , a.[StateMemorySQL]						--достаточно ли ОЗУ для MS SQL Server
		 , a.[SQL_RAM_Reserve_Percent]				--процент выделенной ОЗУ для MS SQL Server относительно всего ОЗУ сервера--достаточно ли ОЗУ для сервера
		, (casewhen a.[RAM_Avail_Percent]<10and a.[RAM_Avail_Percent]>5and a.[TotalAvailOSRam_Mb]<8192then'Warning'when a.[RAM_Avail_Percent]<=5and a.[TotalAvailOSRam_Mb]<2048then'Danger'else'Normal'end) as [StateMemoryServer]
	from
	(
		selectcast(a0.available_physical_memory_kb/1024.0asint) as TotalAvailOSRam_Mb
			 , cast((a0.available_physical_memory_kb/casT(a0.total_physical_memory_kb asfloat))*100asnumeric(5,2)) as [RAM_Avail_Percent]
			 , a0.system_low_memory_signal_state
			 , ceiling(b.physical_memory_kb/1024.0) as [Server_physical_memory_Mb]
			 , ceiling(b.committed_target_kb/1024.0) as [SQL_server_committed_target_Mb]
			 , ceiling(a.physical_memory_in_use_kb/1024.0) as [SQL_server_physical_memory_in_use_Mb]
			 , cast(((b.committed_target_kb-a.physical_memory_in_use_kb)/casT(b.committed_target_kb asfloat))*100asnumeric(5,2)) as [SQL_RAM_Avail_Percent]
			 , cast((b.committed_target_kb/casT(a0.total_physical_memory_kb asfloat))*100asnumeric(5,2)) as [SQL_RAM_Reserve_Percent]
			 , (casewhen (ceiling(b.committed_target_kb/1024.0)-1024)<ceiling(a.physical_memory_in_use_kb/1024.0) then'Warning'else'Normal'end) as [StateMemorySQL]
		from sys.dm_os_sys_memory as a0
		crossjoin sys.dm_os_process_memory as a
		crossjoin sys.dm_os_sys_info as b
		crossjoin sys.dm_os_sys_memory as v
	) as a;
Then you can determine that an instance of MS SQL Server consumes all the memory allocated to it by the following query:
select  SQL_server_physical_memory_in_use_Mb,  SQL_server_committed_target_Mb
from [inf].[vRAM];
If the indicator SQL_server_physical_memory_in_use_Mb is constantly not less than SQL_server_committed_target_Mb, then you need to check the statistics of expectations.
To determine the lack of RAM through the expectation statistics, create an inf.vWaits view:
Creating an inf.vWaits View
CREATEview [inf].[vWaits] asWITH [Waits] AS
    (SELECT
        [wait_type], --имя типа ожидания
        [wait_time_ms] / 1000.0AS [WaitS],--Общее время ожидания данного типа в миллисекундах. Это время включает signal_wait_time_ms
        ([wait_time_ms] - [signal_wait_time_ms]) / 1000.0AS [ResourceS],--Общее время ожидания данного типа в миллисекундах без signal_wait_time_ms
        [signal_wait_time_ms] / 1000.0AS [SignalS],--Разница между временем сигнализации ожидающего потока и временем начала его выполнения
        [waiting_tasks_count] AS [WaitCount],--Число ожиданий данного типа. Этот счетчик наращивается каждый раз при начале ожидания100.0 * [wait_time_ms] / SUM ([wait_time_ms]) OVER() AS [Percentage],
        ROW_NUMBER() OVER(ORDERBY [wait_time_ms] DESC) AS [RowNum]
    FROM sys.dm_os_wait_stats
    WHERE [waiting_tasks_count]>0and [wait_type] NOTIN (
        N'BROKER_EVENTHANDLER',         N'BROKER_RECEIVE_WAITFOR',
        N'BROKER_TASK_STOP',            N'BROKER_TO_FLUSH',
        N'BROKER_TRANSMITTER',          N'CHECKPOINT_QUEUE',
        N'CHKPT',                       N'CLR_AUTO_EVENT',
        N'CLR_MANUAL_EVENT',            N'CLR_SEMAPHORE',
        N'DBMIRROR_DBM_EVENT',          N'DBMIRROR_EVENTS_QUEUE',
        N'DBMIRROR_WORKER_QUEUE',       N'DBMIRRORING_CMD',
        N'DIRTY_PAGE_POLL',             N'DISPATCHER_QUEUE_SEMAPHORE',
        N'EXECSYNC',                    N'FSAGENT',
        N'FT_IFTS_SCHEDULER_IDLE_WAIT', N'FT_IFTSHC_MUTEX',
        N'HADR_CLUSAPI_CALL',           N'HADR_FILESTREAM_IOMGR_IOCOMPLETION',
        N'HADR_LOGCAPTURE_WAIT',        N'HADR_NOTIFICATION_DEQUEUE',
        N'HADR_TIMER_TASK',             N'HADR_WORK_QUEUE',
        N'KSOURCE_WAKEUP',              N'LAZYWRITER_SLEEP',
        N'LOGMGR_QUEUE',                N'ONDEMAND_TASK_QUEUE',
        N'PWAIT_ALL_COMPONENTS_INITIALIZED',
        N'QDS_PERSIST_TASK_MAIN_LOOP_SLEEP',
        N'QDS_CLEANUP_STALE_QUERIES_TASK_MAIN_LOOP_SLEEP',
        N'REQUEST_FOR_DEADLOCK_SEARCH', N'RESOURCE_QUEUE',
        N'SERVER_IDLE_CHECK',           N'SLEEP_BPOOL_FLUSH',
        N'SLEEP_DBSTARTUP',             N'SLEEP_DCOMSTARTUP',
        N'SLEEP_MASTERDBREADY',         N'SLEEP_MASTERMDREADY',
        N'SLEEP_MASTERUPGRADED',        N'SLEEP_MSDBSTARTUP',
        N'SLEEP_SYSTEMTASK',            N'SLEEP_TASK',
        N'SLEEP_TEMPDBSTARTUP',         N'SNI_HTTP_ACCEPT',
        N'SP_SERVER_DIAGNOSTICS_SLEEP', N'SQLTRACE_BUFFER_FLUSH',
        N'SQLTRACE_INCREMENTAL_FLUSH_SLEEP',
        N'SQLTRACE_WAIT_ENTRIES',       N'WAIT_FOR_RESULTS',
        N'WAITFOR',                     N'WAITFOR_TASKSHUTDOWN',
        N'WAIT_XTP_HOST_WAIT',          N'WAIT_XTP_OFFLINE_CKPT_NEW_LOG',
        N'WAIT_XTP_CKPT_CLOSE',         N'XE_DISPATCHER_JOIN',
        N'XE_DISPATCHER_WAIT',          N'XE_TIMER_EVENT')
    )
, ress as (
	SELECT
	    [W1].[wait_type] AS [WaitType],
	    CAST ([W1].[WaitS] ASDECIMAL (16, 2)) AS [Wait_S],--Общее время ожидания данного типа в миллисекундах. Это время включает signal_wait_time_msCAST ([W1].[ResourceS] ASDECIMAL (16, 2)) AS [Resource_S],--Общее время ожидания данного типа в миллисекундах без signal_wait_time_msCAST ([W1].[SignalS] ASDECIMAL (16, 2)) AS [Signal_S],--Разница между временем сигнализации ожидающего потока и временем начала его выполнения
	    [W1].[WaitCount] AS [WaitCount],--Число ожиданий данного типа. Этот счетчик наращивается каждый раз при начале ожиданияCAST ([W1].[Percentage] ASDECIMAL (5, 2)) AS [Percentage],
	    CAST (([W1].[WaitS] / [W1].[WaitCount]) ASDECIMAL (16, 4)) AS [AvgWait_S],
	    CAST (([W1].[ResourceS] / [W1].[WaitCount]) ASDECIMAL (16, 4)) AS [AvgRes_S],
	    CAST (([W1].[SignalS] / [W1].[WaitCount]) ASDECIMAL (16, 4)) AS [AvgSig_S]
	FROM [Waits] AS [W1]
	INNERJOIN [Waits] AS [W2]
	    ON [W2].[RowNum] <= [W1].[RowNum]
	GROUPBY [W1].[RowNum], [W1].[wait_type], [W1].[WaitS],
	    [W1].[ResourceS], [W1].[SignalS], [W1].[WaitCount], [W1].[Percentage]
	HAVINGSUM ([W2].[Percentage]) - [W1].[Percentage] < 95-- percentage threshold
)
SELECT [WaitType]
      ,MAX([Wait_S]) as [Wait_S]
      ,MAX([Resource_S]) as [Resource_S]
      ,MAX([Signal_S]) as [Signal_S]
      ,MAX([WaitCount]) as [WaitCount]
      ,MAX([Percentage]) as [Percentage]
      ,MAX([AvgWait_S]) as [AvgWait_S]
      ,MAX([AvgRes_S]) as [AvgRes_S]
      ,MAX([AvgSig_S]) as [AvgSig_S]
  FROM ress
  groupby [WaitType];
In this case, you can determine the lack of RAM by the following query:
SELECT [Percentage]
      ,[AvgWait_S]
  FROM [inf].[vWaits]
  where [WaitType] in (
    'PAGEIOLATCH_XX',
    'RESOURCE_SEMAPHORE',
    'RESOURCE_SEMAPHORE_QUERY_COMPILE'
  );
Here you need to pay attention to the performance of Percentage and AvgWait_S. If they are significant in their totality, then there is a very high probability that the RAM is not enough for an instance of MS SQL Server. Essential values are determined individually for each system. However, you can start with the following metric: Percentage> = 1 and AvgWait_S> = 0.005.
To output indicators to a monitoring system (for example, Zabbix), you can create the following two queries:
- how much in percentage do the types of expectations for RAM occupy (the sum for all such types of expectations):
selectcoalesce(sum([Percentage]), 0.00) as [Percentage] from [inf].[vWaits] where [WaitType] in ( 'PAGEIOLATCH_XX', 'RESOURCE_SEMAPHORE', 'RESOURCE_SEMAPHORE_QUERY_COMPILE' ); - how many milliseconds the types of expectations for RAM occupy (the maximum value of all average delays for all such types of expectations):
selectcoalesce(max([AvgWait_S])*1000, 0.00) as [AvgWait_MS]
from [inf].[vWaits]
       where [WaitType] in (
           'PAGEIOLATCH_XX',
           'RESOURCE_SEMAPHORE',
            'RESOURCE_SEMAPHORE_QUERY_COMPILE'
  );
Based on the dynamics of the obtained values for these two indicators, we can conclude whether there is enough RAM for an instance of MS SQL Server.
CPU overload detection method
To identify the lack of CPU time, just use the sys.dm_os_schedulers system view. Here, if the runnable_tasks_count indicator is constantly greater than 1, then there is a high probability that the number of cores is not enough for an instance of MS SQL Server.
To display the indicator in a monitoring system (for example, Zabbix), you can create the following query:
selectmax([runnable_tasks_count]) as [runnable_tasks_count]
from sys.dm_os_schedulers
where scheduler_id<255;
Based on the dynamics of the obtained values for this indicator, we can conclude whether there is enough processor time (the number of CPU cores) for an instance of MS SQL Server.
However, it is important to remember the fact that the requests themselves can request multiple threads at once. And sometimes the optimizer cannot correctly assess the complexity of the request itself. Then the request can be allocated too many threads, which at the given time cannot be processed simultaneously. And this also causes a type of waiting associated with a lack of processor time, and the growth of the queue for schedulers that use specific CPU cores, i.e. the runnable_tasks_count indicator will grow under such conditions.
In this case, before increasing the number of CPU cores, it is necessary to correctly configure the parallelism properties of the instance of MS SQL Server, and from the 2016 version, correctly configure the parallelism properties of the required databases:

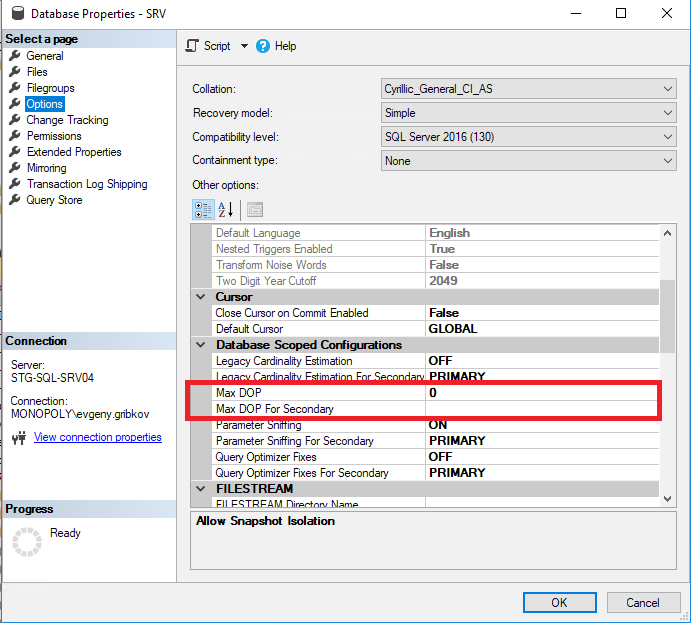
Here it is worth paying attention to the following parameters:
- Max Degree of Parallelism-sets the maximum number of threads that can be allocated to each request (the default is 0-restriction only by the operating system and the MS SQL Server edition)
- Cost Threshold for Parallelism - estimated cost of parallelism (default is 5)
- Max DOP-sets the maximum number of threads that can be allocated to each query at the database level (but no more than the value of the “Max Degree of Parallelism” property) (the default is 0-restriction only by the operating system and the MS SQL Server edition, as well as the restriction on the property "Max Degree of Parallelism" of the entire instance of MS SQL Server)
It is impossible to give an equally good recipe for all cases, that is, you need to analyze difficult requests.
From my own experience, I recommend the following algorithm of actions for OLTP systems to configure parallelism properties:
- first ban concurrency by setting the level of the entire instance of Max Degree of Parallelism to 1
- analyze the most difficult requests and choose the optimal number of threads for them
- set Max Degree of Parallelism to the selected optimal number of threads obtained from item 2, and for specific databases set Max DOP value obtained from item 2 for each database
- analyze the most difficult requests and identify the negative effect of multithreading. If it is, then increase the Cost Threshold for Parallelism.
For systems such as 1C, Microsoft CRM and Microsoft NAV, in most cases, the prohibition of multithreading is suitable.
Also, if the Standard edition is installed, then in most cases the prohibition of multithreading is suitable in view of the fact that this edition is limited by the number of CPU cores.
For OLAP systems, the algorithm described above is not suitable.
According to my own experience, I recommend the following algorithm of actions for OLAP-systems for setting parallelism properties:
- analyze the most difficult requests and choose the optimal number of threads for them
- set Max Degree of Parallelism to the selected optimal number of threads obtained from item 1, and for specific databases set Max DOP value obtained from item 1 for each database
- analyze the most difficult queries and identify the negative effect of the concurrency limit. If it is, then either lower the Cost Threshold for Parallelism value, or repeat steps 1-2 of this algorithm
That is, for OLTP systems we go from single-threaded to multithreading, and for OLAP-systems, on the contrary, we go from multithreading to single-threaded. Thus, it is possible to select the optimal concurrency settings for both a specific database and the entire instance of MS SQL Server.
It is also important to understand that the parallelism properties settings need to be changed over time, based on the results of MS SQL Server performance monitoring.
Recommendations for setting trace flags
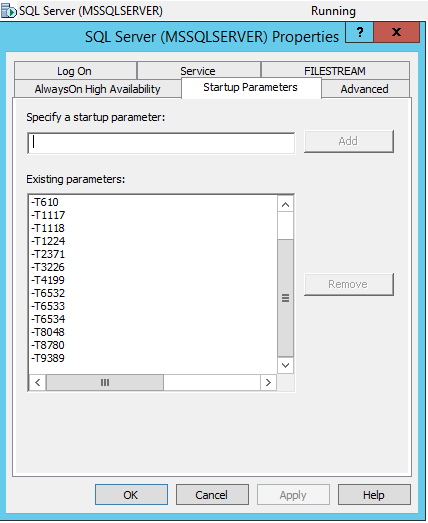
From my own experience and the experience of my colleagues, I recommend setting the following trace flags at the startup level of the MS SQL Server service for 2008-2016 versions for optimal performance:
- 610 - Reducing the logging of inserts in indexed tables. It can help with inserts into tables with a large number of records and many transactions, with frequent long wait for WRITELOG to change in indexes
- 1117 - If a file in a filegroup satisfies the automatic growth threshold, all files in the filegroup are expanded
- 1118 - Forces all objects to be located in different extents (ban on mixed extents), which minimizes the need to scan the SGAM page, which is used to track mixed extents
- 1224 - Disables lock escalation based on the number of locks. Excessive memory usage may include lock escalation.
- 2371 - Changes the threshold for fixed automatic statistics updates to the threshold for dynamic automatic statistics updates. It is important to update query plans for large tables where incorrectly determining the number of records leads to erroneous execution plans
- 3226 - Suppresses successful backup messages in the error log
- 4199 - Includes changes to the query optimizer released in the cumulative update and SQL Server service packs
- 6532-6534 - Includes improved query performance for spatial data types
- 8048 - Converts NUMA partitioned memory objects to CPU partitioned
- 8780 - Includes additional time allocation for scheduling a request. Some requests without this flag may be rejected because they do not have a request plan (very rare error)
- 9389 - Includes an additional dynamic temporarily provided memory buffer for batch mode operators, which enables the batch mode operator to request additional memory and avoid transferring data to tempdb if additional memory is available
Also up to the 2016 version, it is useful to include trace flag 2301, which includes optimization of the extended decision support and thereby helps in choosing more correct query plans. However, starting with version 2016, it often has a negative effect in a fairly long overall query execution time.
Also, for systems in which there are a lot of indexes (for example, for 1C databases), I recommend that you enable trace flag 2330, which disables the collection on the use of indexes, which generally has a positive effect on the system.
Learn more about trace flags here .
Using the above link, it is also important to consider the versions and assemblies of MS SQL Server, because for newer versions, some trace flags are enabled by default or have no effect.
You can enable or disable the trace flag using the DBCC TRACEON and DBCC TRACEOFF commands, respectively. See here for more details .
You can get the status of trace flags using the DBCC TRACESTATUS command: more .
In order for the trace flags to be included in the autorun of the MS SQL Server service, you need to go into SQL Server Configuration Manager and add these trace flags in the properties of the service via -T:
Summary
In this article, some aspects of MS SQL Server monitoring were examined, with the help of which you can quickly identify a lack of RAM and CPU free time, as well as a number of other less obvious problems. The most commonly used trace flags were considered.
Sources
" SQL Server expectation statistics
" SQL Server expectation statistics or please tell me where it hurts
" System view sys.dm_os_schedulers
" Using Zabbix to monitor the MS SQL Server database
" SQL Lifestyle
" Trace Flags
" sql.ru