Julia and the method of coordinate descent
- Tutorial
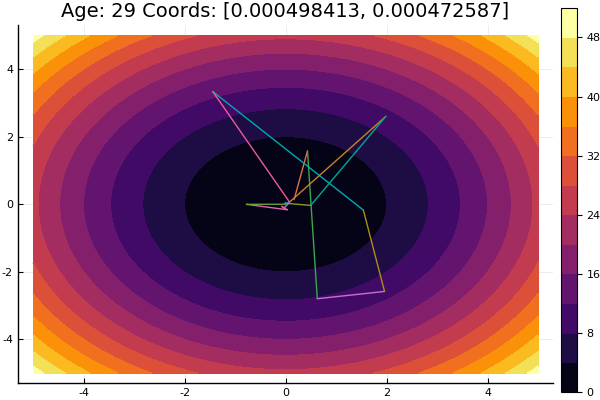
The method of coordinate descent is one of the simplest methods of multidimensional optimization and copes well with finding a local minimum of functions with a relatively smooth relief, so familiarization with optimization methods is better to start with it.
The extremum search is conducted in the direction of the axes of coordinates, i.e. in the search process, only one coordinate is changed. Thus, the multidimensional problem is reduced to one-dimensional.
Algorithm
First cycle:
,
,
, ...,
.
- We are looking for the extremum of the function
. Let the extremum of the function be at
.
,
,
, ...,
. Extremum function
equals
- ...
,
,
, ...,
.
As a result of performing n steps, a new point of approach to the extremum was found.. Next, we check the end-of-bill criterion: if it is executed, a solution is found, otherwise we perform another cycle.
Training
Check package versions:
(v1.1) pkg> status
    Status `C:\Users\User\.julia\environments\v1.1\Project.toml`
  [336ed68f] CSV v0.4.3
  [a93c6f00] DataFrames v0.17.1
  [7073ff75] IJulia v1.16.0
  [47be7bcc] ORCA v0.2.1
  [58dd65bb] Plotly v0.2.0
  [f0f68f2c] PlotlyJS v0.12.3
  [91a5bcdd] Plots v0.23.0
  [ce6b1742] RDatasets v0.6.1
  [90137ffa] StaticArrays v0.10.2
  [8bb1440f] DelimitedFiles
  [10745b16] Statistics
Let us set a function for drawing the surface or level lines, in which it would be convenient to adjust the boundaries of the graph:
using Plots
plotly() # интерактивные графики
function plotter(plot_fun; low, up)
    Xs = range(low[1], stop = up[1], length = 80)
    Ys = range(low[2], stop = up[2], length = 80)
    Zs = [ fun([x y]) for x in Xs, y in Ys ];
    plot_fun(Xs, Ys, Zs)
    xaxis!( (low[1], up[1]), low[1]:(up[1]-low[1])/5:up[1] ) # линовка осей
    yaxis!( (low[2], up[2]), low[2]:(up[2]-low[2])/5:up[2] )
end
As a model function, choose an elliptic paraboloid.
parabol(x) = sum(u->u*u, x)
fun = parabol
plotter(surface, low = [-1-1], up = [11])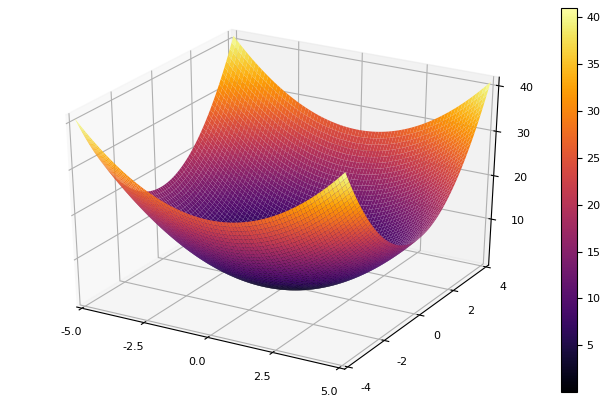
Coordinate descent
The method is implemented in the host function of the name of the one-dimensional optimization method, the dimension of the problem, the desired error, the initial approximation, and limitations for drawing level lines. We will set default values for all parameters.
function ofDescent(odm; ndimes = 2, ε = 1e-4, fit = [.5.5], low = [-1-1], up = [11])
    k = 1# счетчик для ограничения количества шагов
    sumx = 0
    sumz = 1
    plotter(contour, low = low, up = up) # рисуем контуры рельефа
    x = [ fit[1] ] # массив из одного элемента
    y = [ fit[2] ] # в них можно пушить координатыwhile abs(sumz - sumx) > ε && k<80
        fitz = copy(fit)
        for i = 1:ndimes
            odm(i, fit, ε) # отрабатывает одномерная оптимизация
        end
        push!(x, fit[1])
        push!(y, fit[2])
        sumx = sum(abs, fit )
        sumz = sum(abs, fitz)
        #println("$k $fit")
        k += 1
    end
    # кружочками отрисовать маршрут спуска
    scatter!(x', y', legend = false, marker=(10, 0.5, :orange) );# размер, непрозрачность, цвет
    p = title!("Age = $(size(x,1)) f(x,y) = $(fun(fit))")
end
Further we will try various methods of one-dimensional optimization.
Newton's method
The idea of the method is simple as the implementation
# производная
dfun = (x, i) -> i == 1 ? 2x[1] + x[2]*x[2] : 2x[2] + x[1]*x[1]
function newton2(i, fit, ϵ)
    k = 1
    oldfit = Inf
    while ( abs(fit[i] - oldfit) > ϵ && k<50 )
        oldfit = fit[i]
        tryfit = fun(fit) / dfun(fit, i)
        fit[i] -= tryfit
        println("   $k $fit")
    k+=1
    end
end
ofDescent(newton2, fit = [9.19.1], low = [-4-4], up = [1313])
Newton is quite demanding of the initial approximation, and without restrictions on the steps may well jump into the unknown distance. Calculation of the derivative is desirable, but you can get by with a small variation. Modifying our function:
function newton(i, fit, ϵ)
    k = 1
    oldfit = Inf
    x = []
    y = []
    push!(x, fit[1])
    push!(y, fit[2])
    while ( abs(oldfit - fit[i]) > ϵ && k<50 )
        fx = fun(fit)
        oldfit = fit[i]
        fit[i] += 0.01
        dfx = fun(fit)
        fit[i] -= 0.01
        tryfit = fx*0.01 / (dfx-fx)
        # обрубаем при заскоке значения функции на порядокif( abs(tryfit) > abs(fit[i])*10 )
            push!(x, fit[1])
            push!(y, fit[2])
            break
        end
        fit[i] -= tryfit
        #println("   $k $fit")
        push!(x, fit[1])
        push!(y, fit[2])
        k+=1
    end
    # траекторию Одном-й оптим-ии рисуем квадратиками
    plot!(x, y, w = 3, legend = false, marker = :rect )
end
ofDescent(newton, fit = [9.19.1], low = [-4-4], up = [1313])
Inverse Parabolic Interpolation
The method does not require knowledge of the derivative and has a good convergence.
function ipi(i, fit, ϵ) # inverse parabolic interpolation
    n = 0
    xn2 = copy(fit)
    xn1 = copy(fit)
    xn  = copy(fit)
    xnp = zeros( length(fit) )
    xy  = copy(fit)
    xn2[i] = fit[i] - 0.15
     xn[i] = fit[i] + 0.15
    fn2 = fun(xn2)
    fn1 = fun(xn1)
    while abs(xn[i] - xn1[i]) > ϵ && n<80
        fn = fun(xn)
        a = fn1*fn  / ( (fn2-fn1)*(fn2-fn ) )
        b = fn2*fn  / ( (fn1-fn2)*(fn1-fn ) )
        c = fn2*fn1 / ( (fn -fn2)*(fn -fn1) )
        xnp[i] = a*xn2[i] + b*xn1[i] + c*xn[i]
        xn2[i] = xn1[i]
        xn1[i] =  xn[i]
         xn[i] = xnp[i]
        fn2 = fn1
        fn1 = fn
        n += 1
        println("   $n $xn $xn1")
        xy = [xy; xn]
    end
    fit[i] = xnp[i]
    plot!(xy[:,1], xy[:,2], w = 3, legend = false, marker = :rect )
end
ofDescent(ipi, fit = [0.10.1], low = [-.1-.1], up = [.4.4])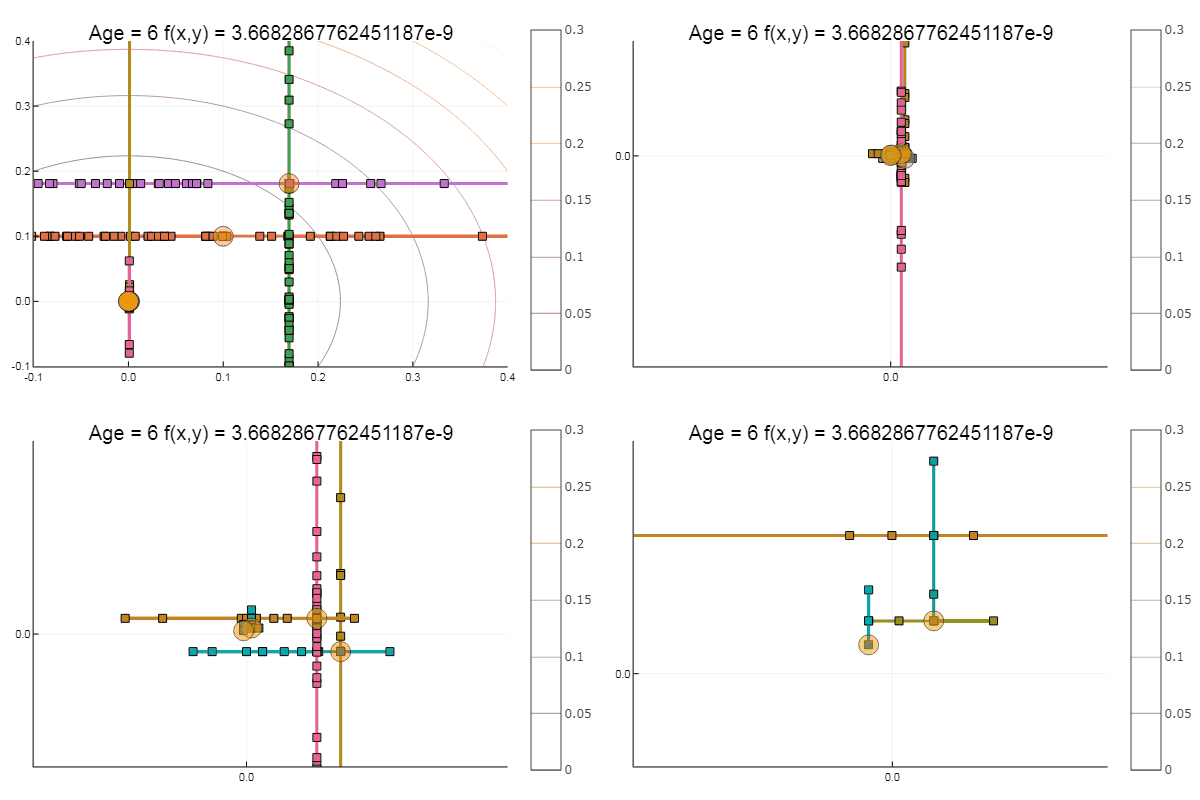
If we take the initial approximation worse, the method will begin to require an unmeasured number of steps for each epoch of coordinate descent. In this regard, his brother wins.
Sequential Parabolic Interpolation
It also requires three starting points , but on many test functions it shows more satisfactory results.
function spi(i, fit, ϵ) # sequential parabolic interpolation
    n = 0
    xn2 = copy(fit)
    xn1 = copy(fit)
    xn  = copy(fit)
    xnp = zeros( length(fit) )
    xy  = copy(fit)
    xn2[i] = fit[i] - 0.01
    xn[i] = fit[i] + 0.01
    fn2 = fun(xn2)
    fn1 = fun(xn1)
    while abs(xn[i] - xn1[i]) > ϵ && n<200
        fn = fun(xn)
        v0 = xn1[i] - xn2[i]
        v1 = xn[i]  - xn2[i]
        v2 = xn[i]  - xn1[i]
        s0 = xn1[i]*xn1[i] - xn2[i]*xn2[i]
        s1 = xn[i] *xn[i]  - xn2[i]*xn2[i]
        s2 = xn[i] *xn[i]  - xn1[i]*xn1[i]
        xnp[i] = 0.5(fn2*s2 - fn1*s1 + fn*s0) / (fn2*v2 - fn1*v1 + fn*v0)
        xn2[i] = xn1[i]
        xn1[i] =  xn[i]
        xn[i] = xnp[i]
        fn2 = fn1
        fn1 = fn
        n += 1
        println("   $n $xn $xn1")
        xy = [xy; xn]
    end
    fit[i] = xnp[i]
    plot!(xy[:,1], xy[:,2], w = 3, legend = false, marker = :rect )
end
ofDescent(spi, fit = [16.116.1], low = [-.1-.1], up = [.4.4])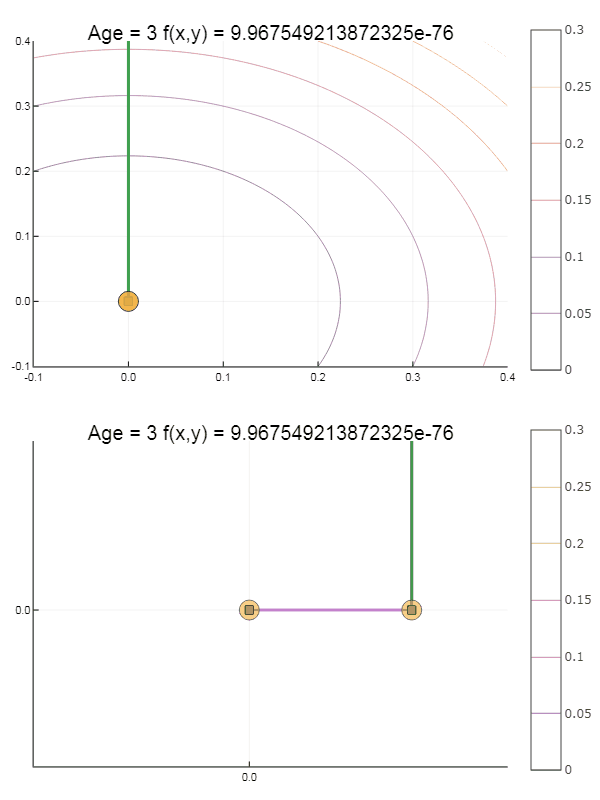
Coming out of a very crappy starting point, it came in three steps! Good ... But all methods have a disadvantage - they converge to a local minimum. Now let's take Ackley's function for research.
ekly(x) = -20exp(-0.2sqrt(0.5(x[1]*x[1]+x[2]*x[2]))) - exp(0.5(cospi(2x[1])+cospi(2x[2]))) + 20 + ℯ
# f(0,0) = 0, x_i ∈ [-5,5]
fun = ekly
plotter(surface, low = [-5-5], up = [55])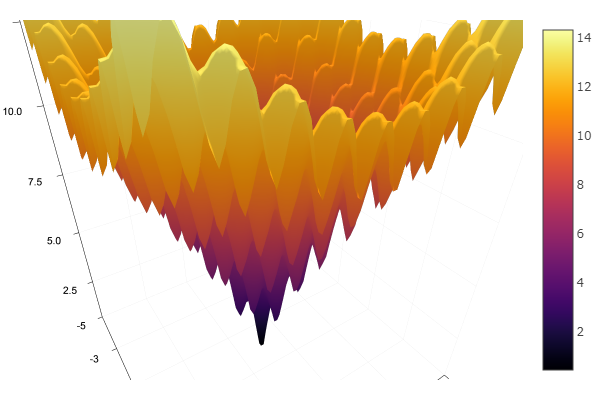

ofDescent(spi, fit = [1.41.4], low = [-.1-.1], up = [2.42.4])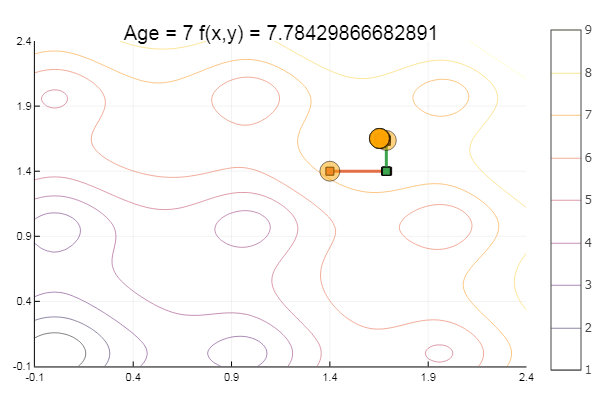
Golden section method
Theory . Although the implementation is complex, the method sometimes shows itself well by jumping over local minima.
function interval(i, fit, st)
    d = 0.
    ab = zeros(2)
    fitc = copy(fit)
    ab[1] = fitc[i]
    Fa = fun(fitc)
    fitc[i] -= st
    Fdx = fun(fitc)
    fitc[i] += st
    if Fdx < Fa
        st = -st
    end
    fitc[i] += st
    ab[2] = fitc[i]
    Fb = fun(fitc)
    while Fb < Fa
        d = ab[1]
        ab[1] = ab[2]
        Fa = Fb
        fitc[i] += st
        ab[2] = fitc[i]
        Fb = fun(fitc)
        # println("----", Fb, " ", Fa)
    end
    if st < 0
        c = ab[2]
        ab[2] = d
        d = c
    end
    ab[1] = d
    ab
end
function goldsection(i, fit, ϵ)
    ϕ = Base.MathConstants.golden
    ab = interval(i, fit, 0.01)
    α = ϕ*ab[1] + (1-ϕ)*ab[2]
    β = ϕ*ab[2] + (1-ϕ)*ab[1]
    fit[i] = α
    Fa = fun(fit)
    fit[i] = β
    Fb = fun(fit)
    while abs(ab[2] - ab[1]) > ϕ
        if Fa < Fb
            ab[2] = β
            β = α
            Fb = Fa
            α = ϕ*ab[1] + (1-ϕ)*ab[2]
            fit[i] = α
            Fa = fun(fit)
        else
            ab[1] = α
            α = β
            Fa = Fb
            β = ϕ*ab[2] + (1-ϕ)*ab[1]
            fit[i] = β
            Fb = fun(fit)
        end
        println(">>>", i, ab)
        plot!(ab, w = 1, legend = false, marker = :rect )
    end
    fit[i] = 0.5(ab[1] + ab[2])
end
ofDescent(goldsection, fit = [1.41.4], low = [-.1-.1], up = [1.1.])
On this with the coordinate descent everything. The algorithms of the presented methods are quite simple, so implementing them in your preferred language is not difficult. In the future, you can consider the built-in tools of the Julia language , but so far I want to touch everything with hands, so to speak, consider methods more complicated and more efficient, then you can go on to global optimization, simultaneously comparing with implementation in another language.
Literature
- Zaitsev V.V. Numerical methods for physicists. Nonlinear equations and optimization: a tutorial. - Samara, 2005 - 86s.
- Ivanov A. V. Computer-aided methods for optimizing optical systems. Tutorial. –SPb: SPbSU ITMO, 2010 - 114с.
- Popova TM. Methods of multidimensional optimization: guidelines and tasks for the implementation of laboratory work in the discipline "Methods of optimization" for students of the direction "Applied Mathematics" / comp. T. M. Popova. - Khabarovsk: Pacific Publishing House. state University, 2012. - 44 p.
