Micrometer connection for Java web application
- Tutorial
Micrometer is used to collect JVM application metrics and allows you to export data to various monitoring systems. In this article I will tell you how to connect Micrometer for spring web applications and export data to Prometheus (a good post about it ). Since my application is written in Spring 3, there is no possibility to use Spring boot without an upgrade. Therefore, you have to work with your hands.
First of all, we need the Prometheus dependencies, the client itself and the servlet for exporting data:
Next, add the metlet export servlet to web.xml and specify the path where the metrics will be available:
Do not forget to add an access policy if necessary:
Now statistics will be available at localhost: 8080 / metrics, but for now this is a blank page. In order for data to appear in it, you need to register the collection of application metrics.
To use Micrometer add dependencies:
Next, you need to register the necessary metric collectors:
Done, now if we switch to localhost: 8080 / metrics, we will get data on the JVM.
It looks something like this:
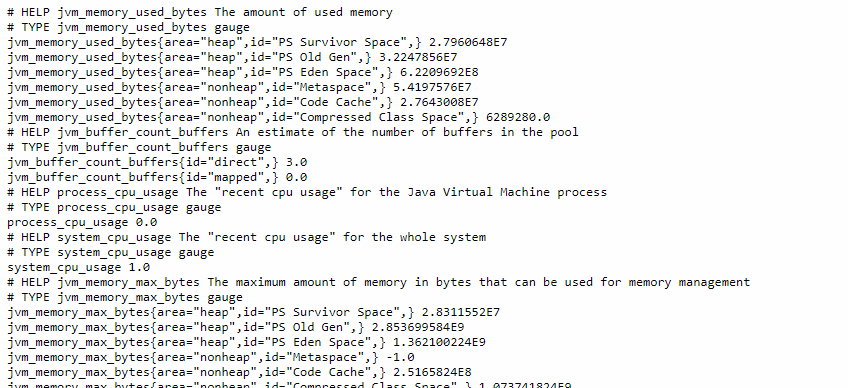
Prometheus has its own library for JVM statistics of simpleclient_hotspot applications , which is configured by calling DefaultExports.initialize (); in the web listener initialization method.
To configure metrics collection in prometheus.yml add a target:
Collected metrics in Prometheus can be viewed using a special language PromQL. The advantage of Micrometr is that you can not write anything, but use ready-made plug-ins for metric visualization systems.

Display application metrics in Grafana, plugin 4683
First of all, we need the Prometheus dependencies, the client itself and the servlet for exporting data:
pom.xml
io.prometheus simpleclient 0.6.0 io.prometheus simpleclient_servlet 0.6.0 Next, add the metlet export servlet to web.xml and specify the path where the metrics will be available:
prometheus io.prometheus.client.exporter.MetricsServlet 1 prometheus /metrics Do not forget to add an access policy if necessary:
Now statistics will be available at localhost: 8080 / metrics, but for now this is a blank page. In order for data to appear in it, you need to register the collection of application metrics.
To use Micrometer add dependencies:
pom.xml
io.micrometer micrometer-core 1.1.3 io.micrometer micrometer-registry-prometheus 1.1.3 Next, you need to register the necessary metric collectors:
@WebListener
public class PrometheusInitListener implements ServletContextListener {
    @Override
    public void contextInitialized(ServletContextEvent sce) {
        PrometheusMeterRegistry meterRegistry =
        		new PrometheusMeterRegistry(PrometheusConfig.DEFAULT, CollectorRegistry.defaultRegistry, Clock.SYSTEM);
        new ClassLoaderMetrics().bindTo(meterRegistry);
        new JvmMemoryMetrics().bindTo(meterRegistry);
        new JvmGcMetrics().bindTo(meterRegistry);
        new ProcessorMetrics().bindTo(meterRegistry);
        new JvmThreadMetrics().bindTo(meterRegistry);
    }
    @Override
    public void contextDestroyed(ServletContextEvent sce) {
    }
}
Done, now if we switch to localhost: 8080 / metrics, we will get data on the JVM.
It looks something like this:
Prometheus has its own library for JVM statistics of simpleclient_hotspot applications , which is configured by calling DefaultExports.initialize (); in the web listener initialization method.
To configure metrics collection in prometheus.yml add a target:
scrape_configs:
 - job_name:  'test-server'
    # Override the global default and scrape targets from this job every 5 seconds.
    scrape_interval: 5s
    metrics_path: /metrics
    static_configs:
      - targets: ['localhost:8080']
Collected metrics in Prometheus can be viewed using a special language PromQL. The advantage of Micrometr is that you can not write anything, but use ready-made plug-ins for metric visualization systems.
Display application metrics in Grafana, plugin 4683