OpenStreetMap Part Medium: Hidden Data Visualization
We are all used to looking at the classic base substrates on the Internet, to see the settlements, roads and their names, houses with their number. But even these property objects have more than just a name or number. For buildings, this is a number of storeys, for roads there are a number of lanes, and for cities, a number of inhabitants. But this is only the tip of the iceberg - OpenStreetMap is so rich in a variety of spatial data that you simply never saw some of it. And without specialized renderings you will never see, unless you are interested in editing what data is this line with strange tags. Today we’ll make such an ultra-specialized rendering for showing forest neighborhoods.

Step 1. Surveys.
You can of course guess with your finger in the sky how they could be denoted, but it’s safer to go to wiki-osm. And there we can find the following: boundary = forest_compartment
Therefore, forest neighborhoods are indicated by polygons with a tag boundary=forest_compartment. True, there is a clarification that it was originally designated as boundary=forestry_compartment, but was less literate. And since the number of uses with the old designation is significant (according to taginfo about 4 thousand times), we will not discount it.
Step 2. Data. Take the
data from Geofabrik . Download the file to all of Russia russia-latest.osm.pbf. With the help osmconvertwe get the data in o5m format for subsequent filtering.
osmconvert russia-latest.osm.pbf -o=russia-latest.o5mNow we filter only the data we need with osmfilter
osmfilter russia-latest.o5m --keep="boundary=forest_compartment =forestry_compartment" -o=forest_compartment-local.o5mStep 3. Vector tiles.
A little brief theory. The old approach is to request some data from a large database, get a picture from them, save it in order to give it to the client in the future. In the new one, from a large database, request a little data and save it for subsequent transmission to the client. And let the client turn them into a picture. Profit, as it were, on the face - we transferred the burden of rendering the image to the client’s shoulders. Of the minuses - on the coffee maker you may not be able to see the map, you need WebGL support.
And so Mapbox proposed a format for vector tiles and a container for them in the form of a sqlite database. Therefore, now it is not a scattering of files in folders, but a neat lonely file. A vector tile contains logical layers (houses, roads, etc.) that consist of geometry and attributes.
Here we will prepare them for our forest neighborhoods. I will use the TileMaker tool . It receives OSM data in pbf format as input, so after filtering we need to convert back to this format.
osmconvert forest_compartment-local.o5m -o=forest_compartment-local.pbfNow we need to explain to TileMaker which layers and with which attributes we need, according to the documentation .
Step 4. Layers?
And what layers do we need? And it depends on what we show. Those. First of all, we must somehow imagine the visual part. And how can it be achieved from the available data. From the OSM data, we have a grid of polygons and their attributes. The attributes have the name of the forestry and the quarter number.

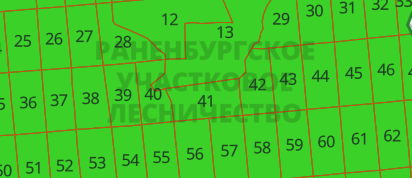
From this, the easiest way is to display the quarter and sign it with your number. Those. we need a polygon layer, in the center of the polygon we will display an inscription with its number.
And then the first feature of vector tiles pops up. When a large source polygon falls into different tiles, only its parts fall into the tiles. And when rendering it turns out to be two different polygons, respectively, for them there will be two signatures in the center of their halves.

Therefore, for vector tiles, a separate layer with inscriptions is prepared, when there is still all the necessary information about the geometry.
Bottom line: we need two layers, polygon for fill and dot for signature. Create a file config.json.
{
    "layers": {
    },
    "settings": {
        "minzoom": 11,
        "maxzoom": 11,
        "basezoom": 14,
        "include_ids": false,
        "author": "freeExec",
        "name": "Forest Compartment RUS",
        "license": "ODbL 1.0",
        "version": "0.1",
        "description": "Forest compartment from OpenStreetMap",
        "compress": "gzip",
        "metadata": {
                "attribution": "© Участники OpenStreetMap",
            "json": { "vector_layers": [
                    ] }
        }
    }
}
In the layers section, specify what we need
    "layers": {
        "forest_compartment": { "minzoom": 11, "maxzoom": 11 },
        "forest_compartment_label": { "minzoom": 11, "maxzoom": 11 }
    },
The names of the layers are indicated and at what scale we will show them.
    "json": { "vector_layers": [
                { "id": "forest_compartment", "description": "Compartment", "fields": {}},
                { "id": "forest_compartment_label", "description": "Compartment", "fields": {"ref":"String"}}
            ] }
In the metadata, we tell the future visualizer what attributes are available with us. For the tagged layer, we will have the quarter number in ref.
Step 5. Data processing.
For this purpose, a script is used in the language luathat will decide which objects from the OSM data we need, in which layer to send them and with what attributes.
Let's start with the file template process.lua.
-- Nodes will only be processed if one of these keys is present
node_keys = {  }
-- Initialize Lua logic
function init_function()
end
-- Finalize Lua logic()
function exit_function()
end
-- Assign nodes to a layer, and set attributes, based on OSM tags
function node_function(node)
end
-- Similarly for ways
function way_function(way)
end
What we have here:
node_keys - there are a lot of points in the OSM data, if we each poke this script, then the processing will take a very long time. This is a filter that tells us which key points we are interested in.
function node_function (node) - the function will be called on every point interesting to us from the previous paragraph. Here we must decide what to do with it.
function way_function (way) - a function that will be called on any line and on relations with the multipolygon and boundary types, because they are considered areal objects.
We begin to write code. First of all, we indicate what points we need:
node_keys = { "boundary" }Now we write the function for processing them:
function node_function(node)
    local boundary = node:Find("boundary")
    if boundary == "forestry_compartment" or boundary == "forest_compartment" then
        local ref = node:Find("ref")
        if ref ~= "" then
            node:Layer("forest_compartment_label", false)
            node:Attribute("ref", ref)
        end
    end
end
What happens here: read the key value boundarythrough node:Find("ключ"). If so forest_compartment, then read the quarter number from the tag ref. If it is not empty, then this object is added to our layer with labels, through Layer("название_слоя", нет_объект_не_полигон). In the layer attribute, refsave the quarter number.
Almost as simple for square blocks:
function way_function(way)
    local boundary = way:Find("boundary")
    if way:IsClosed() and ( boundary == "forestry_compartment" or boundary == "forest_compartment" ) then
        way:Layer("forest_compartment", true)
        way:AttributeNumeric("nomerge", way:Id())
        local ref = way:Find("ref")
        if ref ~= "" then
            way:LayerAsCentroid("forest_compartment_label", false)
            way:Attribute("ref", ref)
        end
    end
end
Here we additionally check that the line is closed, because it happens that tags are present simply on segments. It is worth noting that the layer is forest_compartmentareal (therefore, the second argument is in the function Layer("", true)), and we take the place for the signature as the center of the figure LayerAsCentroid.
It is also worth paying attention to the attribute that we are adding, although we did not specify it in the config - nomerge. It is needed to defeat another feature, this time already the TileMaker converter (although the parameter for disabling it has appeared in the new version).
The peculiarity is that for optimization, when there are many objects with the same attributes in one layer, the converter for them combines the geometries into one. For example, we have a street consisting of three separate segments, which as a result will be sent three times to render. This is longer, in comparison with the fact that we would send one object to the render, but with a slightly more complex (uniting all of them) geometry.
In our case, all adjacent quarters would be united into one large polygon, but we do not need this. Therefore, we add the object number so that they are different and not combined.
Now it's time to start the process of creating vector tiles.
tilemaker forest_compartment-local.pbf --output forest_compartment-local.mbtilesAs a result, we should have a file forest_compartment-local.mbtiles
Шаг 6. Создаём стиль.
Заводим аккаунт на mapbox.com. В Mapbox Studio в разделе Tileset создаём новый tileset, перетаскивая в окошко загрузки наш созданный ранее файл. В течении минуты он должен обработаться и добавиться в список.
Теперь переходим в раздел Styles и создаём новый на основе готового Light, чтобы у нас были видны основные элементы карты, как то дороги, населённые пункты и т.д. Отправляемся в Чебоксары ибо там были замечены лесные кварталы.
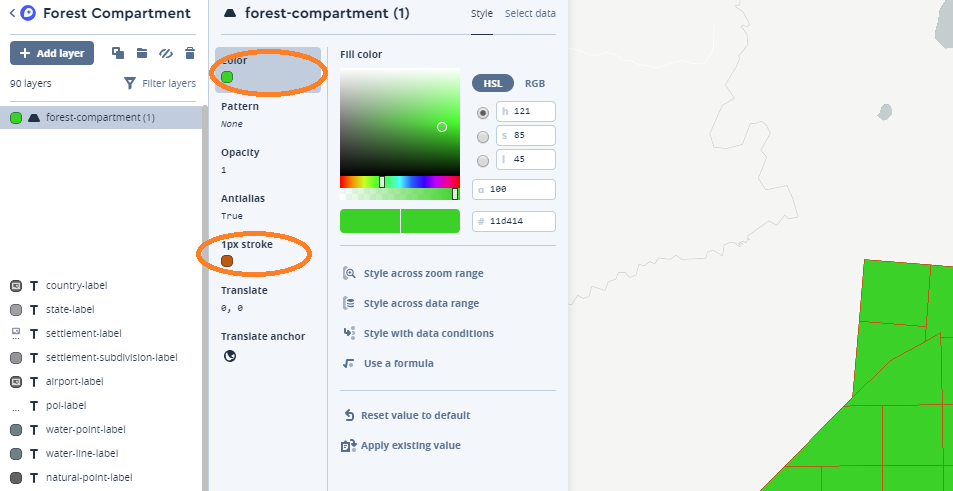
Спускаемся на 11 уровень масштаба (мы ведь только для него создали тайлы) и нажимаем кнопку Add layer. В закладке data source находим наш источник данных forest_compartment-local-XXXXX, в нём выбираем полигональный слой. Он должен подсвечиваться справа зелёным.

Далее на вкладке style задаём цвет заливки — зелёный, а обводки коричневый.

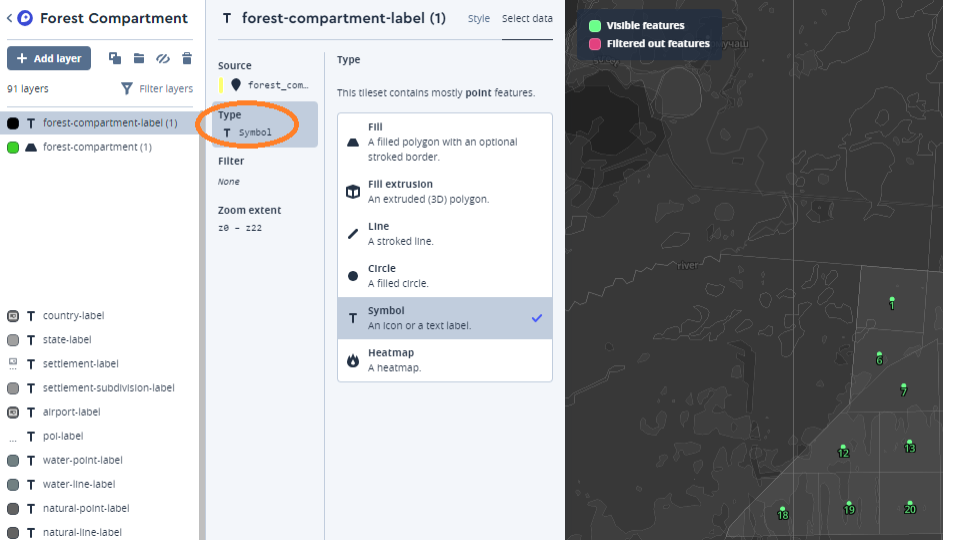
Now it remains to add the signature. Add a new layer, only this time select in the data forest_compartment_label, and select the type symbol, numbers should appear on the right.

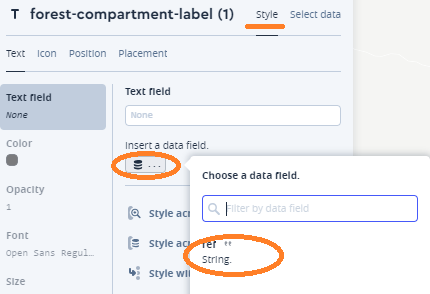
In the style tab, we indicate that we need to display our attribute ref.

That's how it is, click on the right side of the publish screen and we can share the link so that others can look at our creation. BUT the display of cards is not free, as elsewhere, so I won’t give you my link, so as not to fall into the habreffect.
PS: Perhaps in an additional article I will tell you how I achieved the location of the signature with the name of the forestry on a group of blocks included in it.
