Panel of additional tools for the developer on InterSystems IRIS
A panel of additional tools for monitoring and investigating application errors and integration solutions on the InterSystems IRIS data platform, Ensemble integration platform and Caché DBMS, or the history of another bike.
In this article I want to talk about an application that, along with standard administrative tools, I use daily to monitor applications and integration solutions on the InterSystems IRIS platform and to find errors when they occur.
The solution includes viewing and editing global arrays, executing queries (including JDBC / ODBC), sending email search results in the form of archived XLS files. View class objects with the ability to edit. A few simple graphs of the system protocols.
This is a CSP application based on jQuery-UI , chart.js , jsgrid.js.
If interested, I ask for it under the cut and in the repository .
It all started with a study of how to log object changes in InterSystems IRIS, Ensemble, and Caché DBMS.
After reading a great article about this, I forked the project . and began to finish it for his needs.
The result is a solution that is implemented as a panel of the% CSP.Util.Pane subclass, in which there is a main window for commands and a “Run" button, plus refinement settings for commands.
When entering “?” get a brief description of these commands:

Globals
My most frequent team is viewing the global. Typically, this is the global protocol when debugging your own or someone else's project. It can be viewed in the reverse order, as well as by filtering both the link and the data. Found nodes can be edited and deleted:

You can delete the entire global by typing in the command after the name minus ^ logMSW-
But only globals starting with ^ log (protocol globals) can be deleted this way, i.e. implemented restriction against accidental deletion.
If you enter “*” after the name, we get a list of globals with additional characteristics. The second “*” - will add a new field “Allocated MB”, and one more asterisk - “Used MB”. This combination of two reports and separation into “stars” is done to divide the often long-formed report on occupied blocks of large globals.

From this plate, you can click on active links to view the global itself or to view / edit it in a standard way from the control portal by clicking on the Permission field on R or W.
Requests
Converting a report to Excel format
The second function, according to the frequency of use, is query execution. To do this, we enter the sql statement as a command.
The main thing that was enough for me in the standard System Management Portal was to execute queries on JDBC / ODBC sources configured in the DBMS and output the results in XLS format, archive and send the file to e-mail. To do this, in my tool, before executing the command, I need to enable the checkbox “Upload to Excel file”.
This feature saves me a lot of time in everyday routine, and I successfully integrate ready-made modules in new applications and integration solutions.

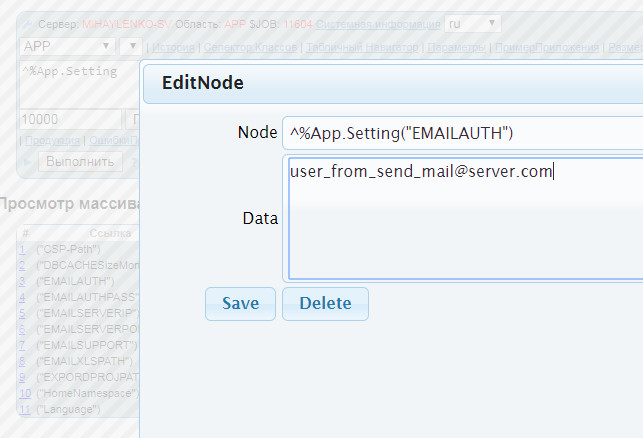
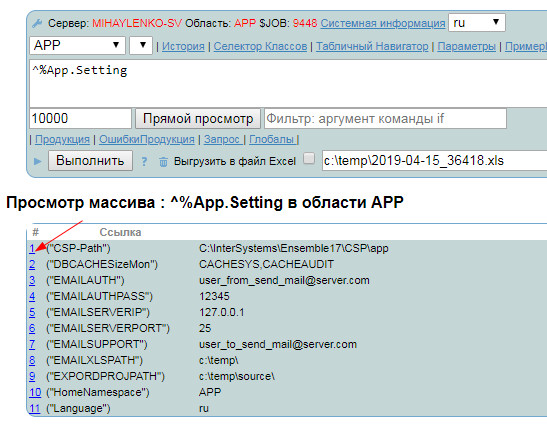
But for this, you first need to configure the path to create files on the server and the credentials of the user and the mail server, for this, in turn, you need to edit the nodes of the global settings ^ ^ App.Setting.

Saving reports in the global
It is often required to save the results of a report execution in the global. To do this, I apply the procedure:
For example, if in the panel we
save the result of the request for counting the use of licenses in the ^ GN array in the panel , and you can see what you saved in the panel with the command:

Modules of augmented functionality
And the second improvement, which greatly simplified and automated my work, is the implementation of the ability to execute specially written modules when formation of each line of request. Thus, on the fly, in one go, I can embed new functionality into the report, for example, active links for additional operations on data.
Example 1: Working with the App.Parameter class
Create a parameter through the “Table Navigator”
Edit a parameter through the “Parameters”

Example 2: View the global through the “History” link

Charts
Impressed by the article [9] and to visualize the growth of databases, a page was created that displays a monthly graph of database sizes created using the iris.log file (cconsole.log) from the “Expand” records retrospectively from the current day.
As an example, an event schedule has been created in InterSystems IRIS, which is also formed by the protocol file:

Material links:
[1] logging subsystem in Kasha
[2] Instant Cache - do CRUD in Caché using jqGrid
[3] Alternative SQL managers for DBMS Caché
[4] Examples of generating and sending Email using DBMS Caché
[5] Cache + jQuery. Quick Start
[6] Application Deployment
[7]UDL support
[8] View globals in the Caché DBMS Management Portal
[9] Prometheus with Caché
[10] Localization in the Caché DBMS
Thanks to the authors of these and other articles who helped me create this tool.
PS This project is developing and many ideas have not yet been implemented. In the near future I plan to do:
1. The application template on freymvorke UIKit
2. Avtodokumentirovanie code format Doxegen with integration into CStudio
In this article I want to talk about an application that, along with standard administrative tools, I use daily to monitor applications and integration solutions on the InterSystems IRIS platform and to find errors when they occur.
The solution includes viewing and editing global arrays, executing queries (including JDBC / ODBC), sending email search results in the form of archived XLS files. View class objects with the ability to edit. A few simple graphs of the system protocols.
This is a CSP application based on jQuery-UI , chart.js , jsgrid.js.
If interested, I ask for it under the cut and in the repository .
It all started with a study of how to log object changes in InterSystems IRIS, Ensemble, and Caché DBMS.
After reading a great article about this, I forked the project . and began to finish it for his needs.
The result is a solution that is implemented as a panel of the% CSP.Util.Pane subclass, in which there is a main window for commands and a “Run" button, plus refinement settings for commands.
When entering “?” get a brief description of these commands:

Globals
My most frequent team is viewing the global. Typically, this is the global protocol when debugging your own or someone else's project. It can be viewed in the reverse order, as well as by filtering both the link and the data. Found nodes can be edited and deleted:

You can delete the entire global by typing in the command after the name minus ^ logMSW-
But only globals starting with ^ log (protocol globals) can be deleted this way, i.e. implemented restriction against accidental deletion.
If you enter “*” after the name, we get a list of globals with additional characteristics. The second “*” - will add a new field “Allocated MB”, and one more asterisk - “Used MB”. This combination of two reports and separation into “stars” is done to divide the often long-formed report on occupied blocks of large globals.

From this plate, you can click on active links to view the global itself or to view / edit it in a standard way from the control portal by clicking on the Permission field on R or W.
Requests
Converting a report to Excel format
The second function, according to the frequency of use, is query execution. To do this, we enter the sql statement as a command.
The main thing that was enough for me in the standard System Management Portal was to execute queries on JDBC / ODBC sources configured in the DBMS and output the results in XLS format, archive and send the file to e-mail. To do this, in my tool, before executing the command, I need to enable the checkbox “Upload to Excel file”.
This feature saves me a lot of time in everyday routine, and I successfully integrate ready-made modules in new applications and integration solutions.

But for this, you first need to configure the path to create files on the server and the credentials of the user and the mail server, for this, in turn, you need to edit the nodes of the global settings ^ ^ App.Setting.

Saving reports in the global
It is often required to save the results of a report execution in the global. To do this, I apply the procedure:
| For JDBC: | ## class (App.sys) .SqlToDSN |
| For ODBC: | ## class (App.sys) .SaveGateway |
| For SQL statements: | ## class (App.sys) .SaveSQL |
| For Query: | ## class (App.sys) .SaveQuery |
For example, if in the panel we
xec do ##class(App.sys).SaveQuery("%SYSTEM.License:Counts","^GN",0)save the result of the request for counting the use of licenses in the ^ GN array in the panel , and you can see what you saved in the panel with the command:
result ^GN("%SYSTEM.License:Counts",0) 
Modules of augmented functionality
And the second improvement, which greatly simplified and automated my work, is the implementation of the ability to execute specially written modules when formation of each line of request. Thus, on the fly, in one go, I can embed new functionality into the report, for example, active links for additional operations on data.
Example 1: Working with the App.Parameter class
Create a parameter through the “Table Navigator”
Edit a parameter through the “Parameters”

Example 2: View the global through the “History” link

Charts
Impressed by the article [9] and to visualize the growth of databases, a page was created that displays a monthly graph of database sizes created using the iris.log file (cconsole.log) from the “Expand” records retrospectively from the current day.
As an example, an event schedule has been created in InterSystems IRIS, which is also formed by the protocol file:

Material links:
[1] logging subsystem in Kasha
[2] Instant Cache - do CRUD in Caché using jqGrid
[3] Alternative SQL managers for DBMS Caché
[4] Examples of generating and sending Email using DBMS Caché
[5] Cache + jQuery. Quick Start
[6] Application Deployment
[7]UDL support
[8] View globals in the Caché DBMS Management Portal
[9] Prometheus with Caché
[10] Localization in the Caché DBMS
Thanks to the authors of these and other articles who helped me create this tool.
PS This project is developing and many ideas have not yet been implemented. In the near future I plan to do:
1. The application template on freymvorke UIKit
2. Avtodokumentirovanie code format Doxegen with integration into CStudio
