Wireshark Guide and Cheat Sheet
- Transfer
- Tutorial
 Even a superficial knowledge of the Wireshark program and its filters will save time by an order of magnitude when troubleshooting network or application problems. Wireshark is useful for many tasks in the work of a network engineer, security specialist or system administrator. Here are some examples of use:
Troubleshooting Network Connectivity
- Visual display of packet loss
- TCP relay analysis
- Schedule for packets with a long delay response
Study of application-level sessions (even when encrypted using SSL / TLS, see below)
- Full view of HTTP sessions, including all headers and data for requests and responses
- View Telnet sessions, view passwords, entered commands and responses
- View SMTP and POP3 traffic, read emails
Troubleshooting DHCP with packet level data
- Learning Broadcast DHCP Broadcasts
- The second step is the exchange of DHCP (DHCP Offer) with the address and parameters
- Customer request at the proposed address
- Ack from the server confirming the request
Extracting files from HTTP sessions
- Exporting objects from HTTP, such as javascript, images, or even executable files
Extracting files from SMB sessions
- Same as HTTP export option, but extracting files transferred via SMB, file sharing protocol in Windows
Malware Detection and Verification
- Detection of abnormal behavior that may indicate malware
- Search for unusual domains or destination IPs
- I / O plots for detecting persistent connections (beacons) with management servers
- Filtering "normal" data and identifying unusual
- Extract large DNS responses and other anomalies that may indicate malware
Checking port scans and other types of scans for vulnerabilities
- Understanding what network traffic comes from scanners
- Analysis of vulnerability testing procedures to distinguish between false positive and false negative triggers
These examples are just the tip of the iceberg. In the manual, we will explain how to use such a powerful tool.
Install Wireshark
Wireshark runs on various operating systems and is easy to install. We mention only Ubuntu Linux, Centos and Windows.
Installing on Ubuntu or Debian
#apt-get update#apt-get install wireshark tsharkInstallation on Fedora or CentOS
#yum install wireshark-gnomeInstalling on Windows
On the download page is the executable file for installation. The packet capture driver is also quite easy to install, with which the network card goes into the “illegible” mode (promiscuous mode allows you to receive all packets regardless of who they are addressed to).
Getting started with filters
With the first interception, you will see in the Wireshark interface a standard template and package details.
Once the HTTP session is captured, stop recording and play with the basic filters and settings Analyze | Follow | HTTP Stream .
The names of the filters speak for themselves. Just enter the appropriate expressions in the filter string (or in the command line if you use tshark). The main advantage of filters is in noise removal (traffic that we are not interested in). You can filter traffic by MAC address, IP address, subnet or protocol. The easiest filter is to enter
http, so that only HTTP traffic will be displayed (tcp port 80) .IP Filter Examples
ip.addr == 192.168.0.5
!(ip.addr == 192.168.0.0/24)
Protocol Filter Examples
tcp
udp
tcp.port == 80 || udp.port == 80
http
not arp and not (udp.port == 53)
Try to make a combination of filters that shows all outgoing traffic, except HTTP and HTTPS, which is sent outside the local network . This is a good way to detect software (even malware) that interacts with the Internet through unusual protocols.
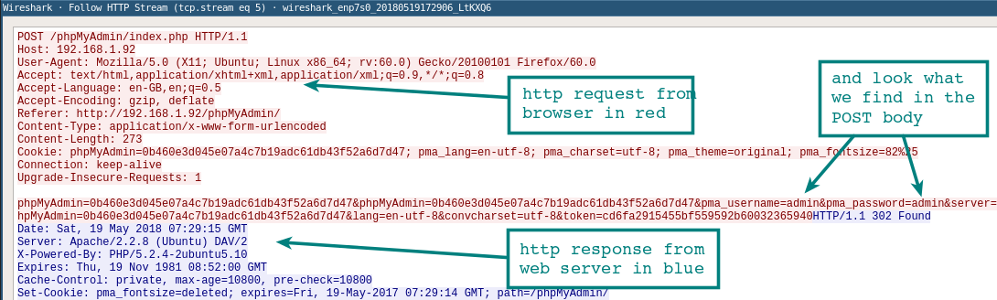
Follow the flow
Once you have captured several HTTP packets, you can use the Analyze | menu item on one of them. Follow | HTTP Stream . It will show the entire HTTP session. In this new window you will see an HTTP request from the browser and an HTTP response from the server.
DNS resolver in Wireshark
By default, Wireshark does not resolve the network addresses in the console. This can be changed in the settings.
Edit | Preferences | Name Resolution | Enable Network Name Resolution
As in the case
tcpdump, the resolving procedure will slow down the display of packets. It is also important to understand that if you quickly capture packets, DNS requests from your host will become additional traffic that can be intercepted.Command line tshark
If you haven't bothered with
tshark, take a look at our guide with examples of filters . This program is often ignored, although it is great for capturing sessions on a remote system. In contrast tcpdump, it allows you to capture and view application-level sessions on the fly: Wireshark protocol decoders are also available for tshark.Making firewall rules
Here's a quick way to create rules from the command line, so as not to search the Internet for a specific syntax. Choose the appropriate rule - and go to Tools | Firewall ACL Rules . It supports a variety of firewalls, such as the IOS the Cisco,
ipfilter, ipfw, iptables, pfand even Windows firewall through netsh.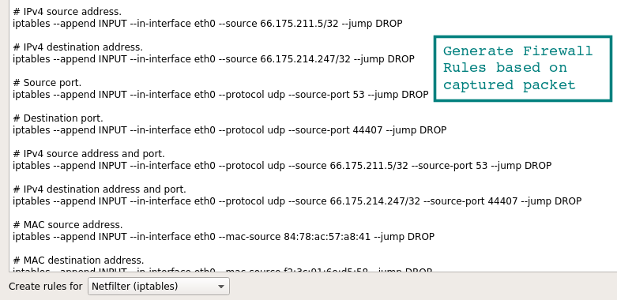
Work with GeoIP geographic base
If Wireshark is compiled with GeoIP support and you have free Maxmind databases, then the program can locate computers by their IP addresses. Check in About | Wireshark , that the program is compiled with the version that you have available. If GeoIP is listed, then check the availability of GeoLite City, Country and ASNum databases. Specify the location of the bases in the menu Edit | Preferences | Name Resolution .
Check the system on a traffic dump by selecting the Statistics | Endpoints | IPv4 . Information about the location and the ASN for the IP address should appear in the columns on the right.
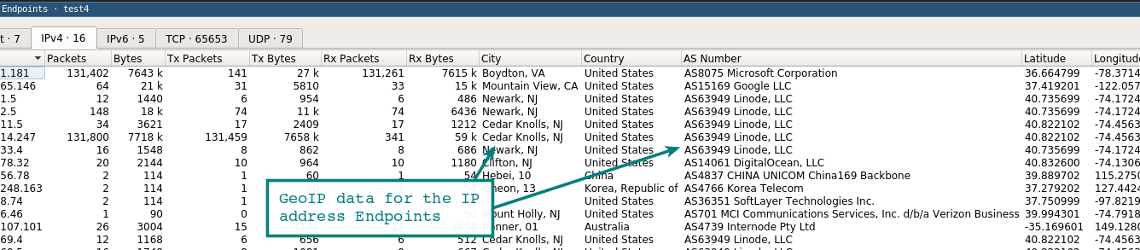
Another feature of GeoIP is filtering traffic by location using a filter.
ip.geoip. For example, you can exclude traffic from a specific ASN. The following command excludes packets from the ASN 63949 (Linode) network block.ip and not ip.geoip.asnum == 63949Of course, the same filter can be applied to individual cities and countries . Remove the noise and leave only really interesting traffic.
SSL / TLS session decryption
One way to decrypt SSL / TLS sessions is to use the private key from the server to which the client is connected.
Of course, you do not always have access to a private key. But there is another option to simply view the SSL / TLS traffic on the local system. If Firefox or Chrome is loaded using a special environment variable, the symmetric keys of the individual SSL / TLS sessions are written to a file that Wireshark can read. Using these keys, Wireshark will show a fully decrypted session!
1. Setting the environment variable
Linux / Mac
export SSLKEYLOGFILE=~/sslkeylogfile.logWindows
On the System Properties | Advanced, click the Environment Variables button and add the variable name (SSLKEYLOGFILE), and the path to the file as the value.
2. Configure Wireshark
From the drop-down menu, select Edit | Preferences | Protocols | SSL | (Pre) -Master-Secret Log Filename - Browse by specifying the file you specified in the environment variable.
Start capturing traffic on the local system.
3. Restart Firefox or Chrome
After going to the HTTPS site, the log file will begin to grow in size, since it records the symmetric keys of the session.
Take a look at the previously launched Wireshark session. You should see something similar to the screenshot below with the decoded sessions. Decrypted packets - on the tab in the bottom panel.
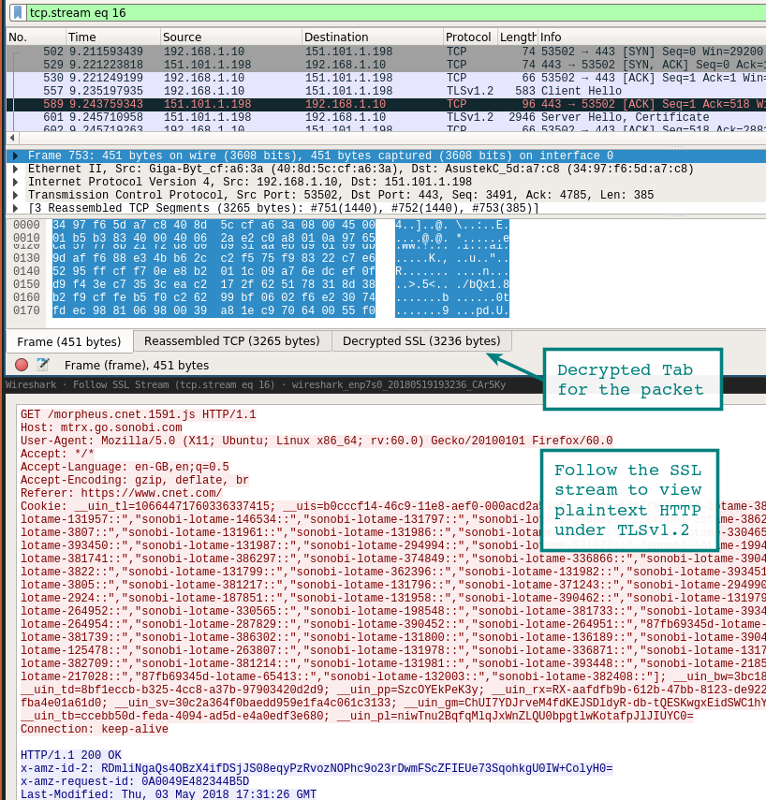
Another way to view a session is through the Analysis | Follow | Stream | The SSL . If the session is successfully decrypted, you will see an option for SSL.
Of course, be careful when writing these keys and packets. If an outsider gets access to the log file, it will easily find your passwords and authentication cookies.
Another way to access basic HTTP traffic is to use the Burp Suite tool.with a loaded CA certificate in the browser. In this case, the proxy decrypts the connection on the client, and then establishes a new SSL / TLS session on the server. There are many ways to conduct such a MiTM-attack on yourself, these are the two most simple ones.
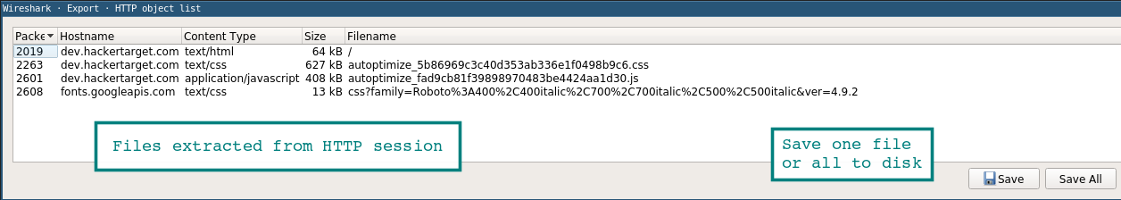
Extracting files from packages using the export feature (HTTP or SMB)
Files are easily retrieved through the export menu.
File | Export Objects | HTTP
All files found will appear in a new window. From here you can save individual files or all at once. A similar method is used to extract files from SMB sessions. As we mentioned, this is the Microsoft Server Message Block protocol, which is used for file sharing under Windows.
Status bar
The status bar on the right side of the window allows you to quickly navigate to the desired location of the network dump by clicking on the color indicator. For example, packets with errors are marked in red in the status bar.

PCAP Sample
When you first start working with Wireshark, I want to look at some interesting package dumps. They can be found on the Wireshark Samples page . There are enough examples with different protocols for several months of analysis, there are even samples of traffic of worms and exploits.
Setting up the environment
The default appearance of the console is fully configurable. You can add or remove columns, adding even such simple things as the UTC time column, which immediately increases the informational content of the logs if you analyze the packet history.
Columns are configured in the Edit | Preferences | Appearance | Columns . It also changes the overall pattern, font and colors.
In the video - useful tips on setting up the environment, including troubleshooting by sequence number TCP.
capinfos
Wireshark comes with a handy command line tool
capinfos. This utility generates batch dump statistics, with start / end times and other details. With the option, -Tit produces the text with a tab - it is suitable for importing into spreadsheets or analysis in the console.test@ubuntu:~$ capinfos test.pcap
File name: test.pcap
File type: Wireshark/tcpdump/... - pcap
File encapsulation: Ethernet
File timestamp precision: microseconds (6)
Packet size limit: file hdr: 262144 bytes
Number of packets: 341 k
File size: 449 MB
Data size: 444 MB
Capture duration: 3673.413779 seconds
First packet time: 2018-12-01 11:26:53.521929
Last packet time: 2018-12-01 12:28:06.935708
Data byte rate: 120 kBps
Data bit rate: 967 kbps
Average packet size: 1300.72 bytes
Average packet rate: 93 packets/s
SHA256: 989388128d676c329ccdbdec4ed221ab8ecffad81910a16f473ec2c2f54c5d6e
RIPEMD160: 0742b6bbc79735e57904008d6064cce7eb95abc9
SHA1: d725b389bea044d6520470c8dab0de1598b01d89
Strict time order: True
Number of interfaces in file: 1Conclusion
This article was originally published in 2011, then seriously updated. If you have any comments, improvements or tips for the cheat sheet, write to me . Wireshark is one of those indispensable tools that many people use, but very few people own it perfectly. Here you can go further and further.