May 19, 2018 at 19:16
Choosing a place for the server and software, testing market inefficiencies: how trading robots are actually created
- Transfer

The author of the blog Financial Hacker talked about how the process of developing high-frequency strategies for trading on the exchange is actually arranged - from the importance of analyzing possible delays, to the issues of receiving data and testing (all with code examples). For example, the strategy of arbitrage trading on US exchanges is used. We have prepared an adapted translation of this material.
Introduction
Compared to machine learning or signal processing algorithms used in traditional trading strategies, high frequency trading (HFT) systems can be surprisingly simple. They do not need to try to predict the future price of shares - they already know it. More precisely, they know the current price a little earlier than the other, slower market participants.
The advantage of HFT in obtaining market data and executing its applications before most participants. The total profitability of the system depends on its speed of delay, the time between receiving the quote and the execution of the application in the trading core of the exchange. Latency is the most relevant factor in evaluating an HFT system. It can be optimized in two ways: minimizing the physical distance to the exchange, and increasing the speed of the system itself. And the first is much more important than the second.
Location
Ideally, the HFT server should be located directly on the exchange. And most trading floors in the world gladly sell server seats in their data centers - the closer to the hub of the main exchange network, the better the place is considered. Electrical signals in a shielded wire are transmitted at a speed of 0.7 - 0.9 of the speed of light (300 km / ms). Reducing the distance to the signal source by one meter results in as much as 8 nanoseconds of advantage in the round trip (the time from sending the application to receiving information about its execution). How many trading opportunities can be missed in 8 nanoseconds? No one knows, but people are willing to pay for every nanosecond saved.
Unfortunately (or fortunately from the point of view of economy, placing in exchange data centers costs a lot of money), the HFT system analyzed in this article cannot be placed on a colocation in the data center of the trading platform for this reason. Moreover, for trading, she needs to receive data from the NYSE exchanges in New York and CME (Chicago) at the same time.
High-speed cables are stretched between the two cities, and a microwave network also operates. In theory, the ideal location for a system with similar requirements is the town of Warren, Ohio. It is located exactly in the middle between New York and Chicago. It is not known whether there is a hub for high-speed merchants there, however, the distance of 357 miles to both exchanges results in a approximately 4 ms round trip delay.

Warren, Ohio - Mecca of HFT Merchants (Image: Jack Pearce / Wikipedia Commons)
There is no doubt that a server in this wonderful town will cost much less than a server in a New York stock exchange rack. Startup idea: buy a pair of garages in Warren, connect to a high-speed cable between New York and Chicago and earn money by renting server racks!
Software
When you have already invested in choosing the optimal location and communication channels for the HFT system, you will definitely want to get software that will correspond to the required speed. Commercial trading platforms are usually not fast enough, in addition, their code is always closed, it is not known exactly what and how it works. Therefore, HFT systems are almost never based on existing platforms, but are written from scratch. Not in R or Python, but in any of the “fast” languages. This list includes:
- C or C ++ is a great combination of high level and high speed. C is easy to read, while it is almost as fast and efficient as machine languages.
- Pentium Assembler - write your algorithm using machine instructions and it will overtake even C systems. Of the minuses of this approach: maintaining such code will not be easy, all programmers know how difficult it is to read assembler programs written by someone else.
- CUDA, HLSL or GPU assembler - if the algorithm actively uses vector or matrix operations, then running it on a video card can be a great idea.
- VHDL - if any software is too slow, and the success of a transaction for a particular algorithm will depend on nanoseconds, then the "ultimate solution" here is to code the system directly in hardware. In VHDL, you can define arithmetic units, digital filters and FPGA chip sequencers with clock speeds of up to several hundred megahertz. Such chips can be directly connected to the network interface.
With the exception of VHDL, all of the above should be familiar to many specialists (especially developers of computer games in 3D). But the standard language for high-frequency strategy can be called C / C ++. It is he who is used in this material.
Algorithm
Many HFT systems “hunt” competing traders using “overtaking methods”. They notice your application, and then buy the same asset at the same price a couple of microseconds before you and sell it to you a little more expensive, making money on it. On some exchanges, such trading is prohibited to create equal conditions for all participants, other platforms can allow this, hoping to earn more on commissions. In the example from this article, such mechanisms will not be used; instead, an arbitrage strategy will be described. Suppose our servers are located in Warren and we have a high-speed channel to Chicago and New York.
Arbitration will occur between the financial instruments ES and SPY. ES is a Chicago-based S & P500 futures. SPY is a New York-based ETF that is also tied to the S & P500. One point of ES equals 10 cents of SPY, so the price of ES is about ten times higher than SPY. Since both assets are based on the same index, a high correlation of their prices can be expected. There are publications whose authors prove that this correlation will “break” in small time periods. Any short-term price difference between the ES-SPY pair that exceeds the bid-ask spread creates opportunities for arbitration. The algorithm from the example will work according to the following strategy:
- Determine the difference SPY-ES.
- Determine its deviation from the average.
- If the deviation exceeds the bid ask spread and goes beyond a certain threshold value, then positions are opened in ES and SPY in opposite directions.
- If the deviation reverses its direction and exceeds a predetermined (slightly smaller) threshold, the positions are closed.
The algorithm is written in C. If you've never seen HFT code before, it may seem a little strange:
#define THRESHOLD  0.4  // Entry/Exit threshold
// Алгоритм HFT арбитража
// возвращает 0 для закрытия всех позиций
// возвращает 1 для открытия длинной позиции по ES, короткой по SPY
// возвращает 2 для открытия короткой позиции по SPY, длинной по ES
// в противном случае возвращает -1
int tradeHFT(double AskSPY,double BidSPY,double AskES,double BidES)
{
	double SpreadSPY = AskSPY-BidSPY, SpreadES = AskES-BidES;
	double Arbitrage = 0.5*(AskSPY+BidSPY-AskES-BidES);
	static double ArbMean = Arbitrage;
	ArbMean = 0.999*ArbMean + 0.001*Arbitrage;
	static double Deviation = 0;
	Deviation = 0.75*Deviation + 0.25*(Arbitrage - ArbMean);
	static int Position = 0;
	if(Position == 0) {
		if(Deviation > SpreadSPY+THRESHOLD)
			return Position = 1;
		if(-Deviation > SpreadES+THRESHOLD)
			return Position = 2;
	} else {
		if(Position == 1 && -Deviation > SpreadES+THRESHOLD/2)
			return Position = 0;
		if(Position == 2 && Deviation > SpreadSPY+THRESHOLD/2)
			return Position = 0;
	}
	return -1;
}
The traderHFT function is called from a certain framework (it is not considered in the article), which receives quotes and sends orders. As parameters, the current best prices for buying and selling on ES and SPY are used from the top of the order book (it is assumed that the SPY price is multiplied by ten so that both assets are on the same scale). The function returns a code that tells the framework to open or close positions, or to do nothing. The Arbitrage variable represents the average price difference between SPY and ES. Her average (ArbMean) is filtered by a slow exponential moving average, and Deviation from the average is also filtered by a fast moving average to prevent reactions to quotes outside the desired range. The Position variable denotes a machine state that can take the value long, short, and nothing. The threshold value for entering or exiting a position (Threshold) is set at 40 cents. This is the only adjustable parameter of the system. If the strategy was intended for real trading, one would also have to optimize the threshold value using several months of ES and SPY data.
Such a minimalistic system is not at all difficult to translate to assembler or even program in an FPGA chip. However, there is no such need: even if you use the Zorro framework compiler for compilation (it is developed by the author of the article), the tradeHFT function is executed in just 750 nanoseconds. If you use a more advanced compiler like Microsoft VC ++, this value can be reduced to 650 nanoseconds. Since the time between two ES quotes is 10 microseconds or more, the speed C is quite enough.
In our HFT experiment, we need to answer two questions. First, is there really a price difference between the two instruments sufficient to generate arbitrage profit? Secondly, at what maximum delay will the system still work?
Data
For backtesting an HFT system, data that can usually be obtained from brokers for free is not suitable. You need to fork out for the purchase of data on the order book in the required permission or BBO (Best Bid and Offer) data, with the exchange’s timestamps included. Without information on what time the quote was received on the exchange, it will not work to determine the maximum delay.
Some companies record all quotes coming from exchanges, and then sell this data. Each of them has its own data format, so first you have to bring them to a common format. This example uses the following target data format:
typedef struct T1    // single tick
{
	double time; // time stamp, OLE DATE format
	float fVal;  // positive = ask price, negative = bid price
} T1;
One of the companies monitoring the situation on the CME exchange delivers data in CSV format with many additional fields, most of which are not needed for the task at hand. All quotes per day are stored in one CSV file. Below is a script for “pulling” ES data for December 2016 from it and converting it to the T1 quotes dataset:
//////////////////////////////////////////////////////
// Convert price history from Nanotick BBO to .t1
//////////////////////////////////////////////////////
#define STARTDAY 20161004
#define ENDDAY   20161014
string InName = "History\\CME.%08d-%08d.E.BBO-C.310.ES.csv";  // name of a day file
string OutName = "History\\ES_201610.t1";
string Code = "ESZ";	// December contract symbol
string Format = "2,,%Y%m%d,%H:%M:%S,,,s,,,s,i,,";  // Nanotick csv format
void main()
{
	int N,Row,Record,Records;
	for(N = STARTDAY; N <= ENDDAY; N++)
	{
		string FileName = strf(InName,N,N+1);
		if(!file_date(FileName)) continue;
		Records = dataParse(1,Format,FileName);  // read BBO data
		printf("\n%d rows read",Records);
		dataNew(2,Records,2);  // create T1 dataset
		for(Record = 0,Row = 0; Record < Records; Record++)
		{
			if(!strstr(Code,dataStr(1,Record,1))) continue; // select only records with correct symbol
			T1* t1 = dataStr(2,Row,0);  // store record in T1 format
			float Price = 0.01 * dataInt(1,Record,3);  // price in cents
			if(Price < 1000) continue;  // no valid price
			string AskBid = dataStr(1,Record,2);
			if(AskBid[0] == 'B')  // negative price for Bid
				Price = -Price;
			t1->fVal = Price;
			t1->time = dataVar(1,Record,0) + 1./24.;  // add 1 hour Chicago-NY time difference
			Row++;
		}
		printf(", %d stored",Row);
		dataAppend(3,2,0,Row);  // append dataset
		if(!wait(0)) return;
	}
	dataSave(3,OutName);  // store complete dataset
}
The script first parses the CSV into an intermediate binary dataset, which is then converted to the target T1 format. Since timestamps are affixed to Chicago time, you need to add one more hour to them to convert them to New York time.
A company tracing the New York Stock Exchange delivers data in a specially compressed NxCore Tape format, it must be converted to a second T1 list using a special plug-in:
//////////////////////////////////////////////////////
// Convert price history from Nanex .nx2 to .t1
//////////////////////////////////////////////////////
#define STARTDAY 20161004
#define ENDDAY 	 20161014
#define BUFFER	 10000
string InName = "History\\%8d.GS.nx2";  // name of a single day tape
string OutName = "History\\SPY_201610.t1";
string Code = "eSPY";
int Row,Rows;
typedef struct QUOTE {
	char	Name[24];
	var	Time,Price,Size;
} QUOTE;
int callback(QUOTE *Quote)
{
	if(!strstr(Quote->Name,Code)) return 1;
	T1* t1 = dataStr(1,Row,0);  // store record in T1 format
	t1->time = Quote->Time;
	t1->fVal = Quote->Price;
	Row++; Rows++;
	if(Row >= BUFFER)	{   // dataset full?
		Row = 0;
		dataAppend(2,1);    // append to dataset 2
	}
	return 1;
}
void main()
{
	dataNew(1,BUFFER,2); // create a small dataset
	login(1);            // open the NxCore plugin
	int N;
	for(N = STARTDAY; N <= ENDDAY; N++) {
		string FileName = strf(InName,N);
		if(!file_date(FileName)) continue;
		printf("\n%s..",FileName);
		Row = Rows = 0;  // initialize global variables
		brokerCommand(SET_HISTORY,FileName); // parse the tape
		dataAppend(2,1,0,Row);  // append the rest to dataset 2
		printf("\n%d rows stored",Rows);
		if(!wait(0)) return;  // abort when [Stop] was hit
	}
	dataSave(2,OutName); // store complete dataset
}
The Callback function is called by any quote in the source file, however, most of the data is not needed, so only SPY (“eSPY”) quotes are filtered out.
Confirmation of Market Inefficiency
Having received data from two sources, now we can compare ES and SPY prices in high resolution. Here is a typical ten-second sample from price curves:
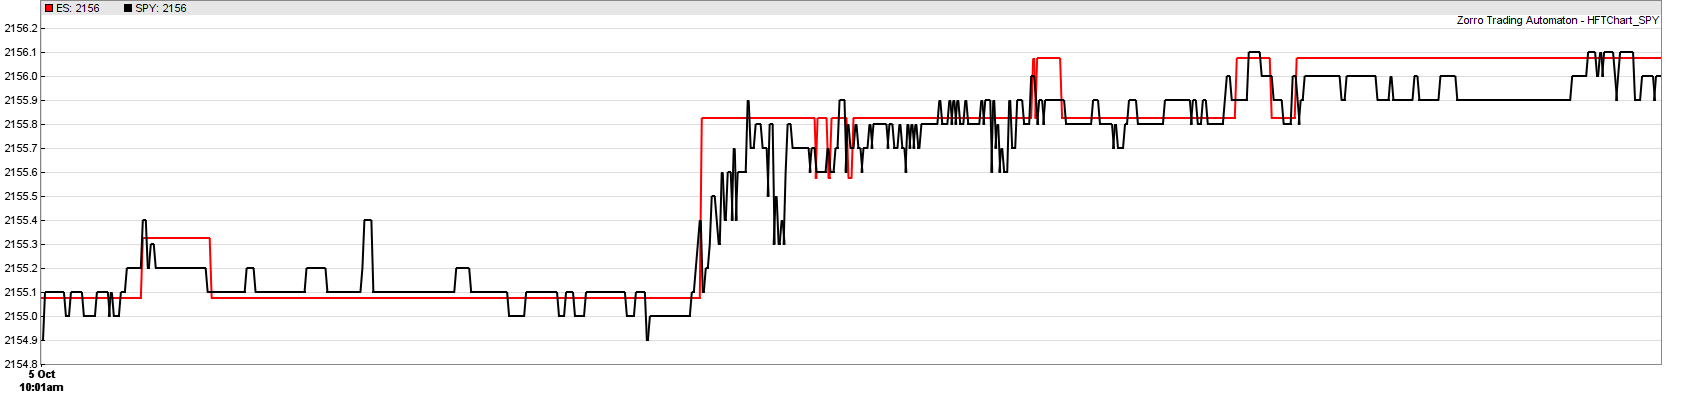
SPY (black) vs. ES (red), October 5, 2017, 10:01:25 - 10: 01.35 The
resolution here is one millisecond. ES is drawn in dollar units, SPY is in ten-cent. Chart prices are ask prices (asking price). It seems that prices are highly correlated even on such a small interval. ES is a little behind.
The opportunity for arbitration arises on a site in the center - at about 10:01:30 the ES reacted to the changes a little slower, but more strongly. The reason could be some kind of event like a sharp jump in the prices of one of the shares included in the S&P 500. For several milliseconds, the difference between ES-SPY exceeded the bid-ask spread of two assets (usually 25 cents for ES and 1-4 cents for SPY ) Ideally, here you could sell ES and buy SPY. Thus, we confirmed the previously assumed theory of market inefficiency, which opens up opportunities for earnings.
The script for drawing graphs in high resolution:
#define ES_HISTORY	"ES_201610.t1"
#define SPY_HISTORY	"SPY_201610.t1"
#define TIMEFORMAT	"%Y%m%d %H:%M:%S"
#define FACTOR		10
#define OFFSET		3.575
void main()
{
	var StartTime = wdatef(TIMEFORMAT,"20161005 10:01:25"),
		EndTime = wdatef(TIMEFORMAT,"20161005 10:01:35");
	MaxBars = 10000;
	BarPeriod = 0.001/60.;	// 1 ms plot resolution
	Outlier = 1.002;  // filter out 0.2% outliers
	assetList("HFT.csv");
	dataLoad(1,ES_HISTORY,2);
	dataLoad(2,SPY_HISTORY,2);
	int RowES=0, RowSPY=0;
	while(Bar < MaxBars)
	{
		var TimeES = dataVar(1,RowES,0),
			PriceES = dataVar(1,RowES,1),
			TimeSPY = dataVar(2,RowSPY,0),
			PriceSPY = dataVar(2,RowSPY,1);
		if(TimeES < TimeSPY) RowES++;
		else RowSPY++;
		if(min(TimeES,TimeSPY) < StartTime) continue;
		if(max(TimeES,TimeSPY) > EndTime) break;
		if(TimeES < TimeSPY) {
			asset("ES");
			priceQuote(TimeES,PriceES);
		} else {
			asset("SPY");
			priceQuote(TimeSPY,PriceSPY);
		}
		asset("ES");
		if(AssetBar > 0) plot("ES",AskPrice+OFFSET,LINE,RED);
		asset("SPY");
		if(AssetBar > 0) plot("SPY",FACTOR*AskPrice,LINE,BLACK);
	}
}
First, the script reads two files with historical data that we created earlier, and then parses them line by line.
System testing
To backtest the resulting HFT system, you need to slightly modify the script and call the tradeHFT function in a loop:
#define LATENCY		4.0	// milliseconds
function main()
{
	var StartTime = wdatef(TIMEFORMAT,"20161005 09:30:00"),
		EndTime = wdatef(TIMEFORMAT,"20161005 15:30:00");
	MaxBars = 200000;
	BarPeriod = 0.1/60.;	// 100 ms bars
	Outlier = 1.002;
	assetList("HFT.csv");
	dataLoad(1,ES_HISTORY,2);
	dataLoad(2,SPY_HISTORY,2);
	int RowES=0, RowSPY=0;
	EntryDelay = LATENCY/1000.;
	Hedge = 2;
	Fill = 8; // HFT fill mode;
	Slippage = 0;
	Lots = 100;
	while(Bar < MaxBars)
	{
		var TimeES = dataVar(1,RowES,0),
			PriceES = dataVar(1,RowES,1),
			TimeSPY = dataVar(2,RowSPY,0),
			PriceSPY = dataVar(2,RowSPY,1);
		if(TimeES < TimeSPY) RowES++;
		else RowSPY++;
		if(min(TimeES,TimeSPY) < StartTime) continue;
		if(max(TimeES,TimeSPY) > EndTime) break;
		if(TimeES < TimeSPY) {
			asset("ES");
			priceQuote(TimeES,PriceES);
		} else {
			asset("SPY");
			priceQuote(TimeSPY,FACTOR*PriceSPY);
		}
		asset("ES");
		if(!AssetBar) continue;
		var AskES = AskPrice, BidES = AskPrice-Spread;
		asset("SPY");
		if(!AssetBar) continue;
		var AskSPY = AskPrice, BidSPY = AskPrice-Spread;
		int Order = tradeHFT(AskSPY,BidSPY,AskES,BidES);
		switch(Order) {
			case 1:
			asset("ES"); enterLong();
			asset("SPY"); enterShort();
			break;
			case 2:
			asset("ES"); enterShort();
			asset("SPY"); enterLong();
			break;
			case 0:
			asset("ES"); exitLong(); exitShort();
			asset("SPY"); exitLong(); exitShort();
			break;
		}
	}
	printf("\nProfit %.2f at NY Time %s",
		Equity,strdate(TIMEFORMAT,dataVar(1,RowES,0)));
}
The script runs a backtest for one trading day between 9:30 a.m. and 3:30 p.m. New York. In fact, the HFT function is simply called with the ES and SPY prices, and then the code is executed to switch states. He opens positions in one hundred units of each asset (2 contracts for ES and 1000 for SPY). The delay is set using the EntryDelay variable. In HFT mode (Fill = 8), the transaction is held at the last price after the delay time. This allows you to bring the simulation closer to real conditions.
The table below shows the profit from the simulation with different delay values:
| Delay | 0.5 ms | 4.0 ms | 6.0 ms | 10 ms |
|---|---|---|---|---|
| Profit / day | + $ 793 | + $ 273 | + $ 205 | - $ 15 |
As you can see, the ES-SPY arbitrage strategy can earn $ 800 per day - with an unrealistically small delay of 500 microseconds. Unfortunately, if you have 700 miles between the NYSE and CME, you need a time machine (or some kind of quantum teleportation tool) to achieve this result. A server in Warren, Ohio, with a delay of 4 ms will bring about $ 300 per day. If the server is a little away from the high-speed channel between New York and Chicago, the profit will be $ 200. If the infrastructure for trade is even further — say, in Nashville — then nothing can be made.
Even $ 300 a day will result in an annual income of $ 75,000. But to achieve this result, you will need, in addition to hardware and software, a lot of money. An SPY contract costs $ 250, 100 units for trading will result in 100 * $ 2500 + 100 * 10 * $ 250 = half a million dollars in trading volume. So the annual return on investment will not exceed 15%. The results, however, can be improved by adding more pairs of financial instruments for arbitration.
conclusions
- If the system responds quickly enough, it can earn even very primitive methods, such as arbitrage between highly correlated financial instruments on different exchanges.
- The physical location of the server is very important in HFT.
- ES-SPY arbitration cannot be carried out from anywhere. You will have to compete with those who are already doing this, and very likely from Warren in Ohio.
Other financial and stock market related materials from ITI Capital :
- Analytics and market reviews
- Back to the future: checking the performance of a trading robot using historical data
- Event-driven Python backtesting step by step ( Part 1 , Part 2 , Part 3 , Part 4 , Part 5 )