Splunk 7.1. What's new? New web interface, integration with Apache Kafka and much more ...
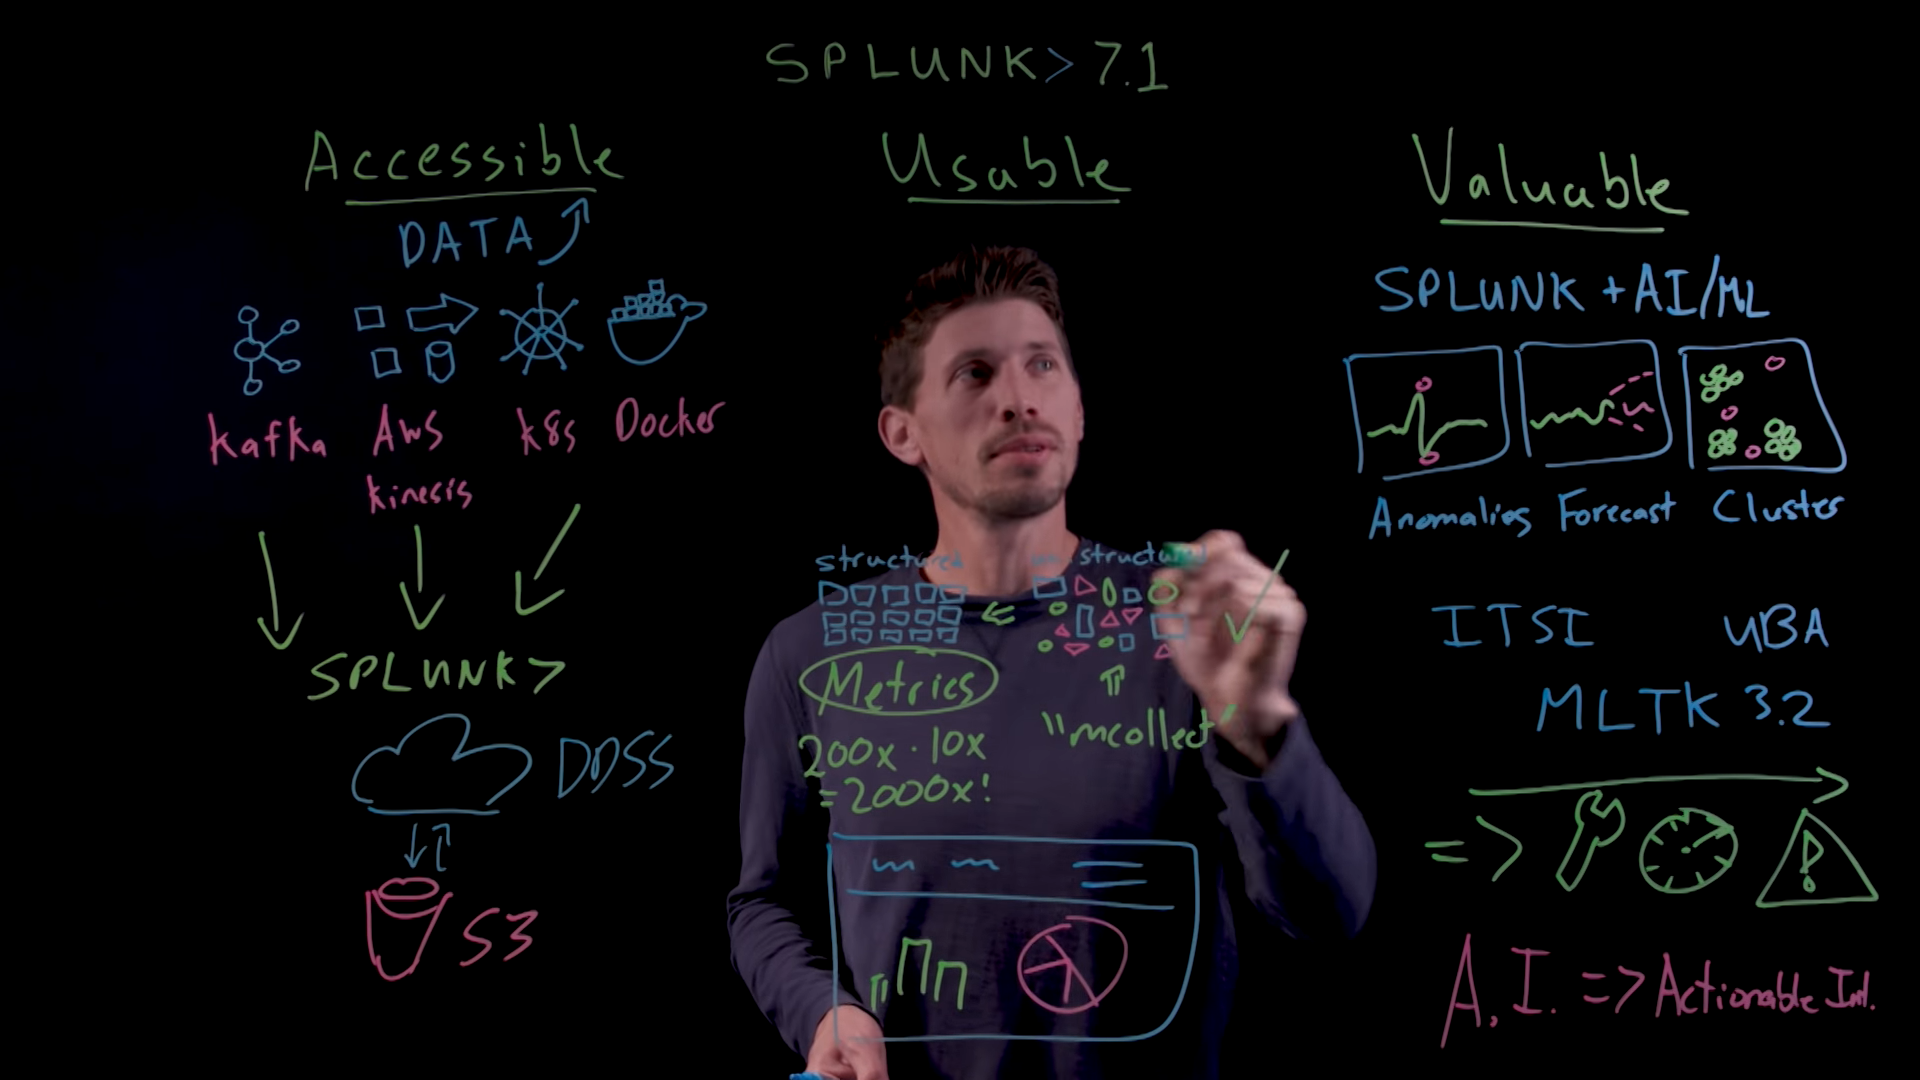
A few days ago, Splunk released a new release of its Splunk 7.1 platform, which probably had the most anticipated change in the last few years - yes, the GUI has completely changed. In this article, we will talk about the main innovations and platform improvements. What else is new besides the GUI? Look under the cat.
Interface
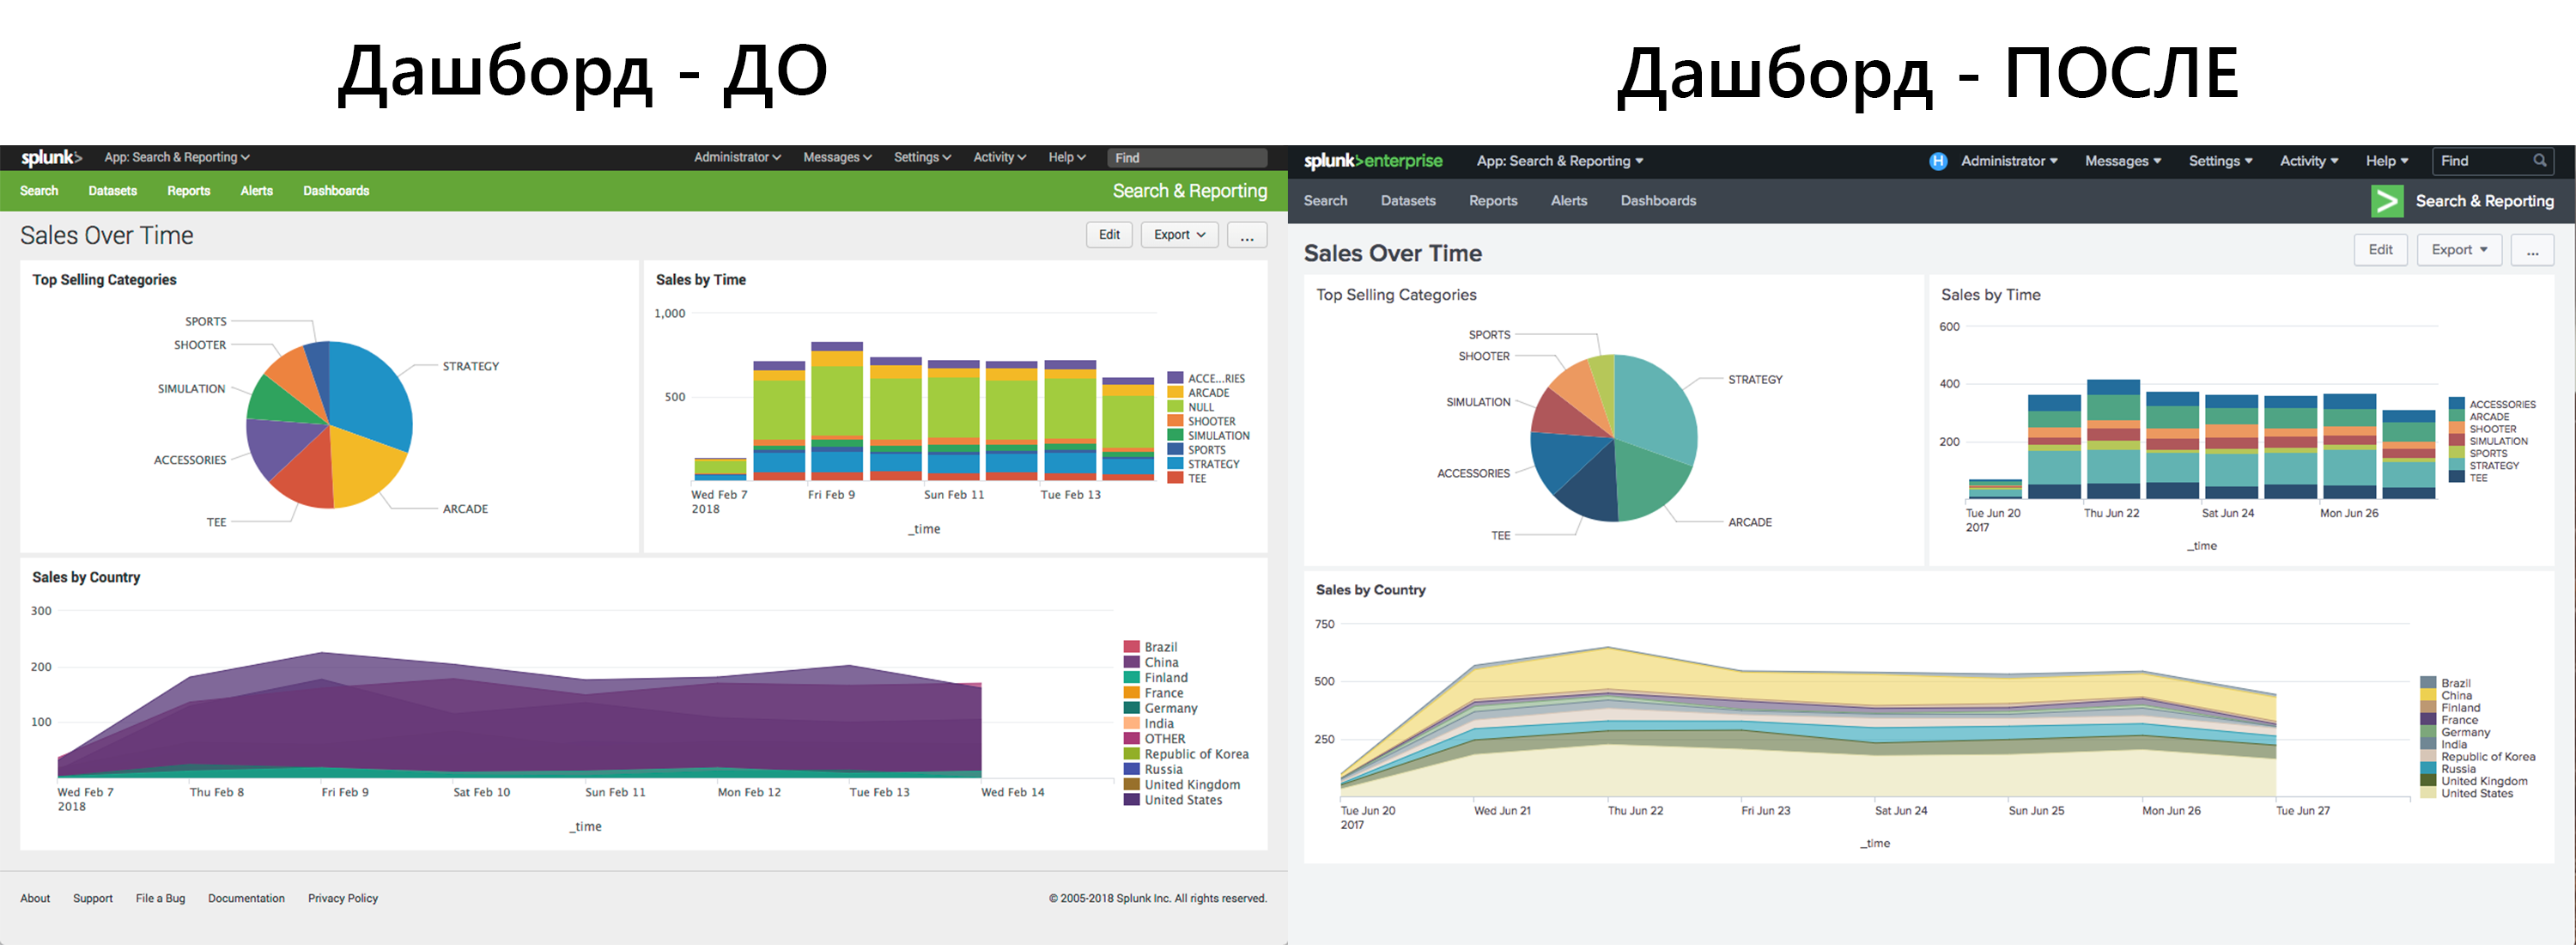
As we said, yes, and probably this is the most noticeable change, Splunk completely changed the interface, right up to changing the error page. Appearance is becoming more modern and stylish. Chart and event viewer elements have been fixed to increase the perception of information. After the update, it’s a little unusual, but after using the system for a couple of days, you get used to it and start to like it. Yes, really like it.
Integration with Apache Kafka
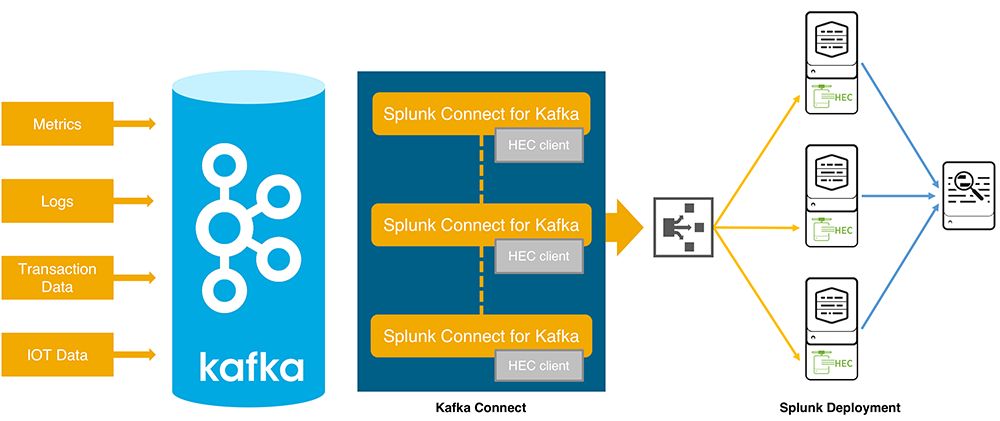
Splunk has a connector for Kafka. Now you can stream your data with Kafka to the Splunk installation using the Splunk HTTP event collector. Also in this release, Splunk offers integration with AWS Kinesis Firehose, but in our reality it’s less interesting. A detailed description of the functionality and deployment instructions are available here .
Access control
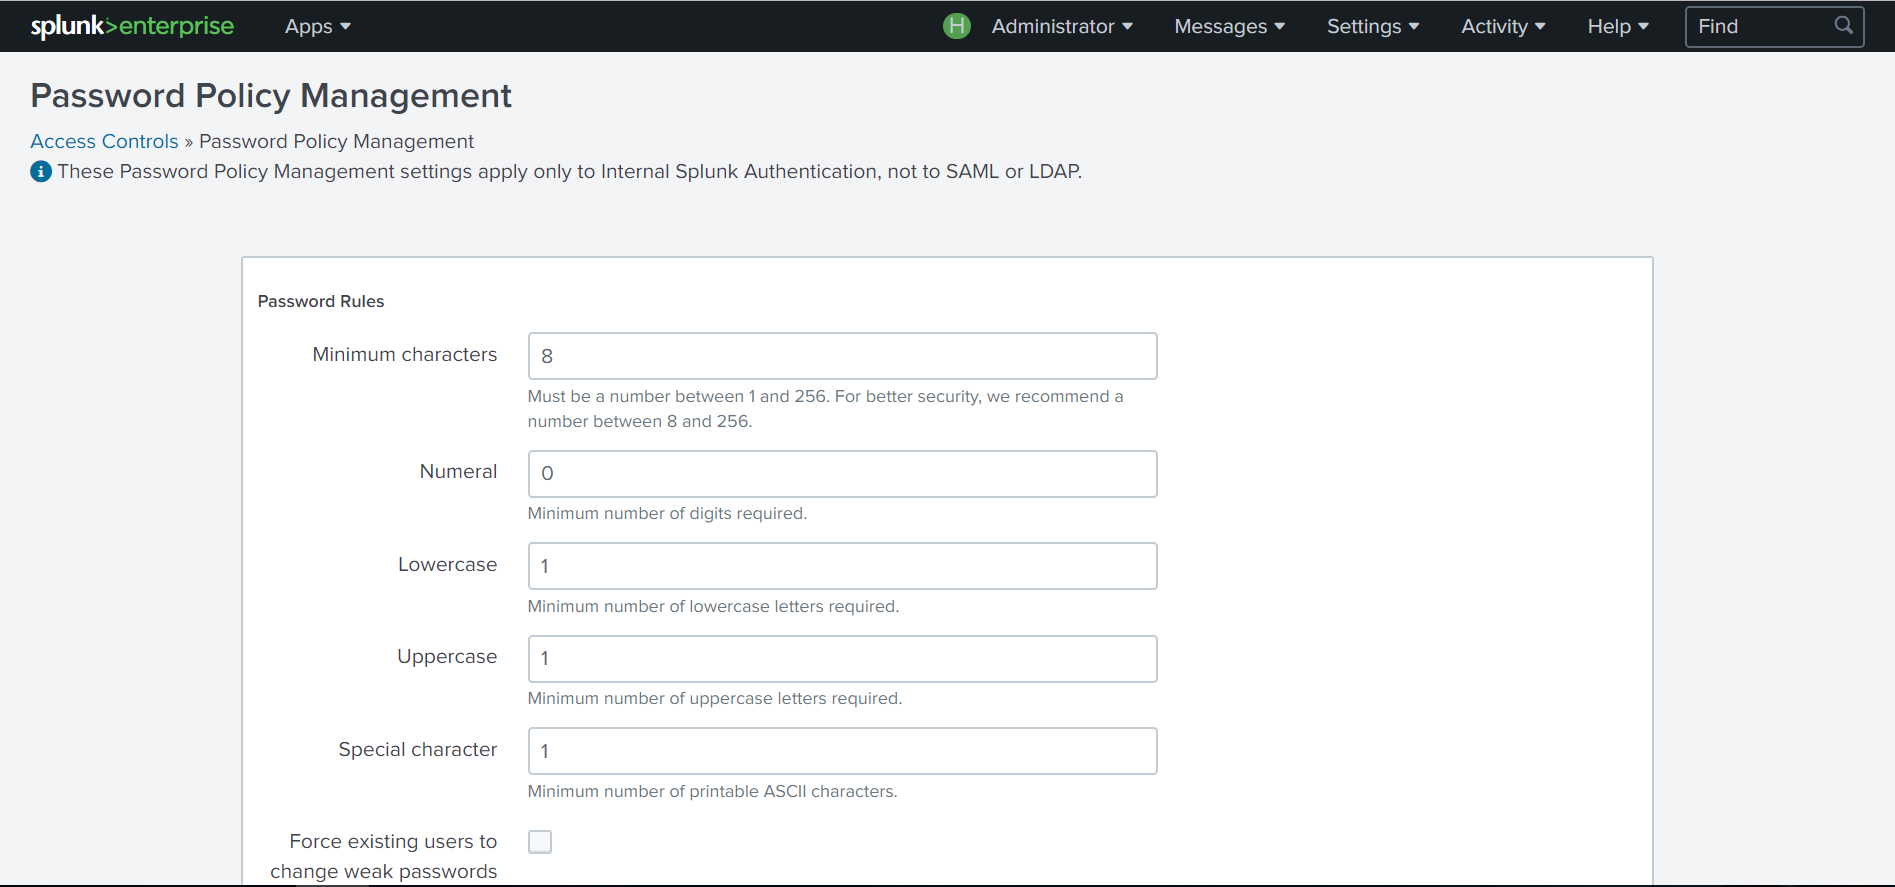
Splunk began to seriously think about the security of its platform and starting with this release you will forget about the combination admin / changeme . Now you will be asked to enter a password at the installation stage with a requirement of 8 characters.

Also, in the new version, in order to increase security, it became possible to configure advanced account policies. Now the Splunk administrator can set requirements for password complexity, expiration date, blocking after repeated unsuccessful login attempts.
Monitoring Splunk Component Status
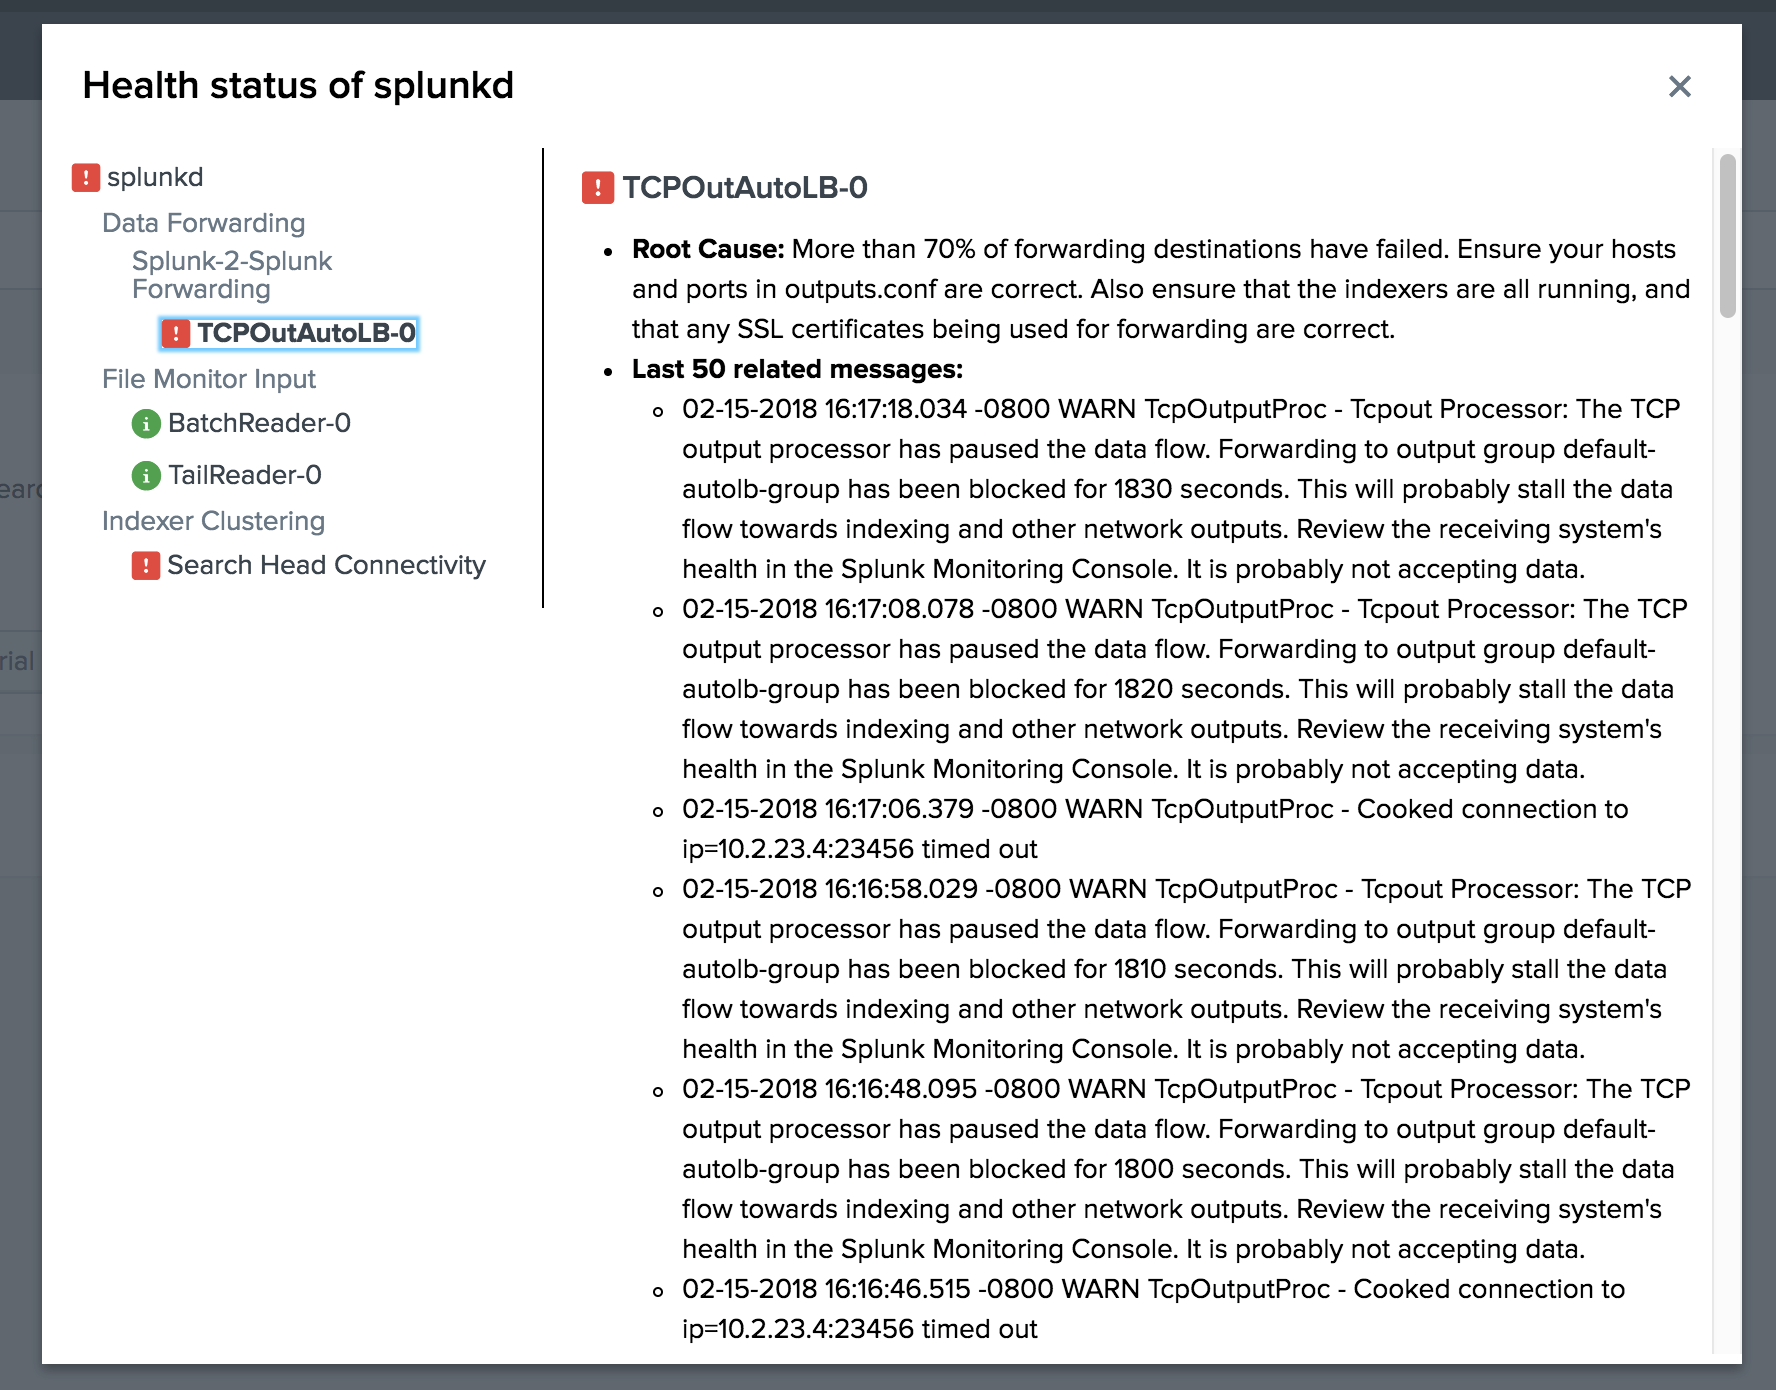
Hurrah! Splunk is becoming more sociable. Now when something breaks down at the collection / parsing / indexing stage, he will try to tell us about it and we don’t need to look into the _internal log and look for what happened.
Splunk 7.1 includes the ability to monitor the health of Splunk components. In case of deviations, Splunk can indicate the cause, report errors and give tips to solve the problem. Health status is indicated on the menu bar.

Metrics enhancements and new SPL commands
In release 7.0 Splunk, a new type of data indexing has appeared - metrics. You can read more about them in our review of Splunk 7.0 . Using metrics improves the processing of search queries and reduces the overall load on the system. But in the first release, the tools for working with metrics were somewhat limited.
The new version has been improved team mstats , and also added a team mcollect .
1. Improving mstats
In 7.0, we could only calculate one indicator in this command. And in order to count several at once, I had to use additional tools that complicated the search query.
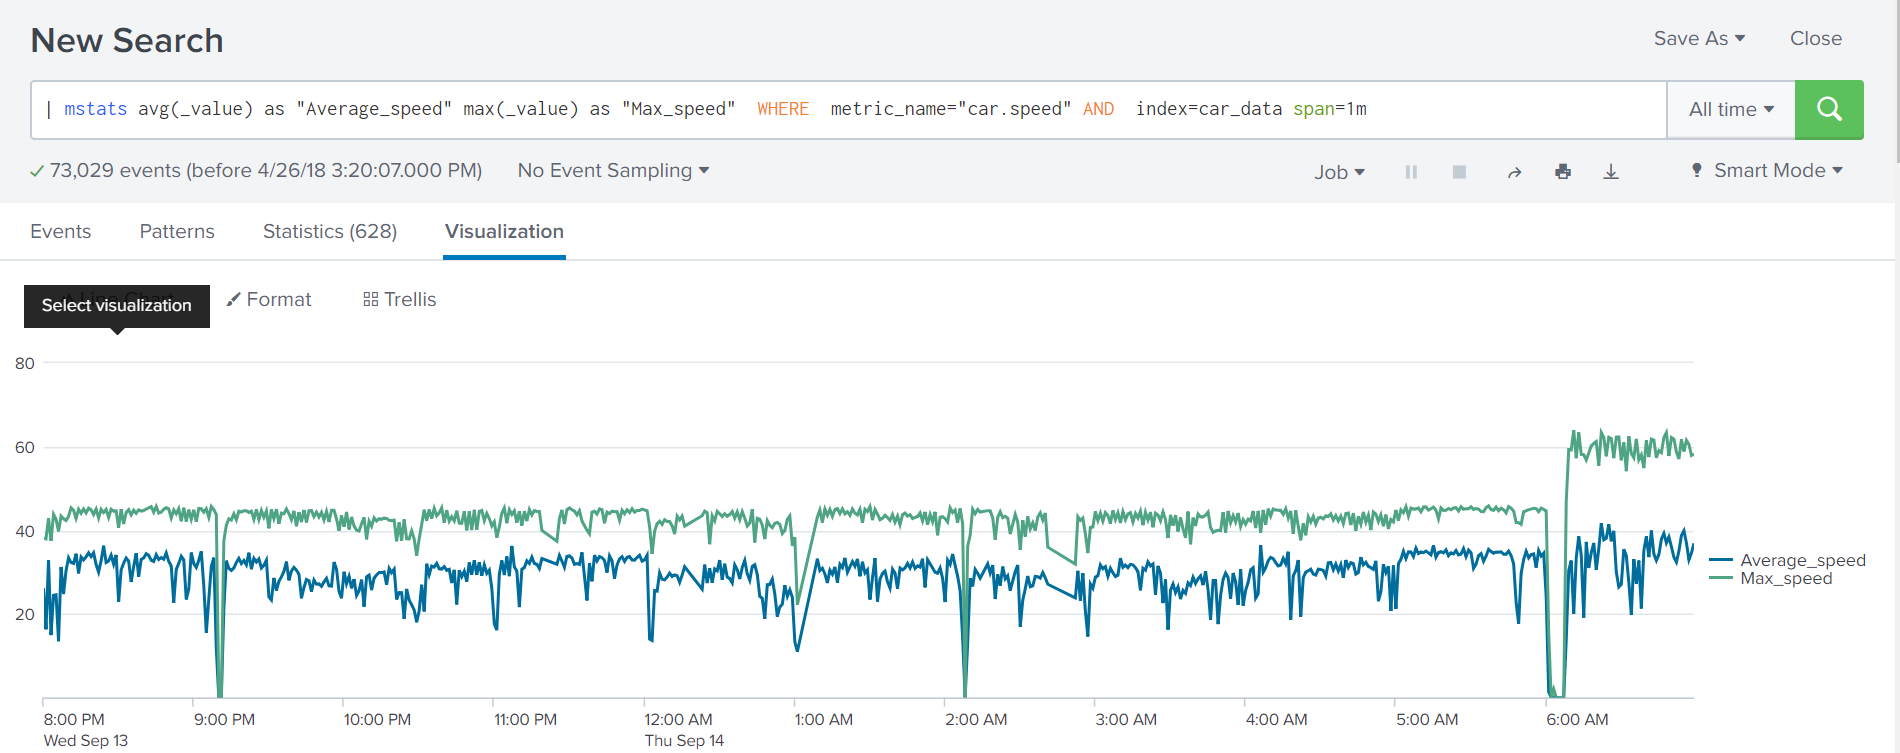
For example: In version 7.1, it became possible to calculate several indicators at once in one team.
| mstats avg(_value) as "Average_speed" WHERE metric_name="car.speed" AND index=car_data span=1m

| appendcols [

| mstats max(_value) as "Max_speed" WHERE metric_name="car.speed" AND index=car_data span=1m ]
| mstats avg(_value) as "Average_speed" max(_value) as "Max_speed" WHERE metric_name="car.speed" AND index=car_data span=1m
2. New mcollect command
Using the mcollect command , we can convert search results to metrics. Before executing the command, you need to create a new index for metrics, in which we will save the indicators.
For example, create a metric for the number of errors:
ERROR | stats count BY type | rename count AS _value type AS metric_name | mcollect index=my_metric_indexAnd yes, they forgot to say, they increased the speed of working with metrics 10 times. Now metric search is even faster!
Machine Learning Toolkit Update
The ML Toolkit has also been updated, which allows you to receive answers from your data to important questions about anomalies, forecasts and clusterization using various machine learning algorithms.
X-means
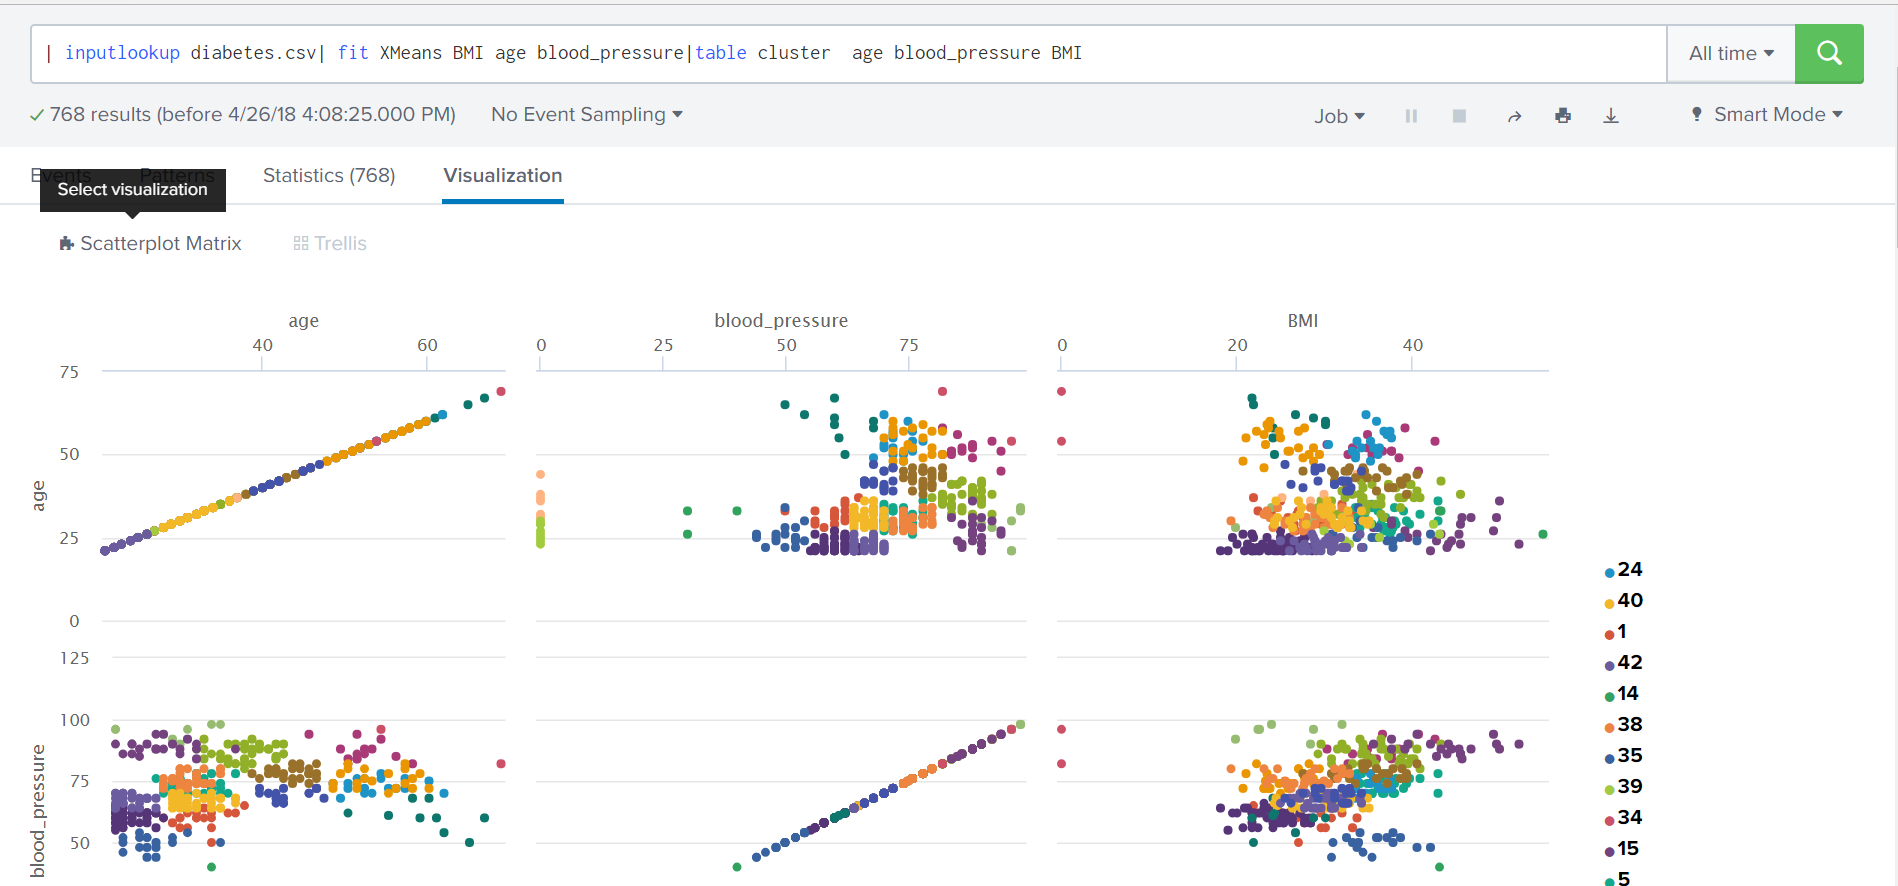
First of all, the addition of the new X-means clustering algorithm , which differs from the standard clustering algorithm, K-means, in that it automatically determines the optimal number of clusters according to the Bayesian information criterion, should be noted . The X-means algorithm is convenient to use when you do not know beforehand how many clusters you can divide the data into.
Managing Models and Experiments
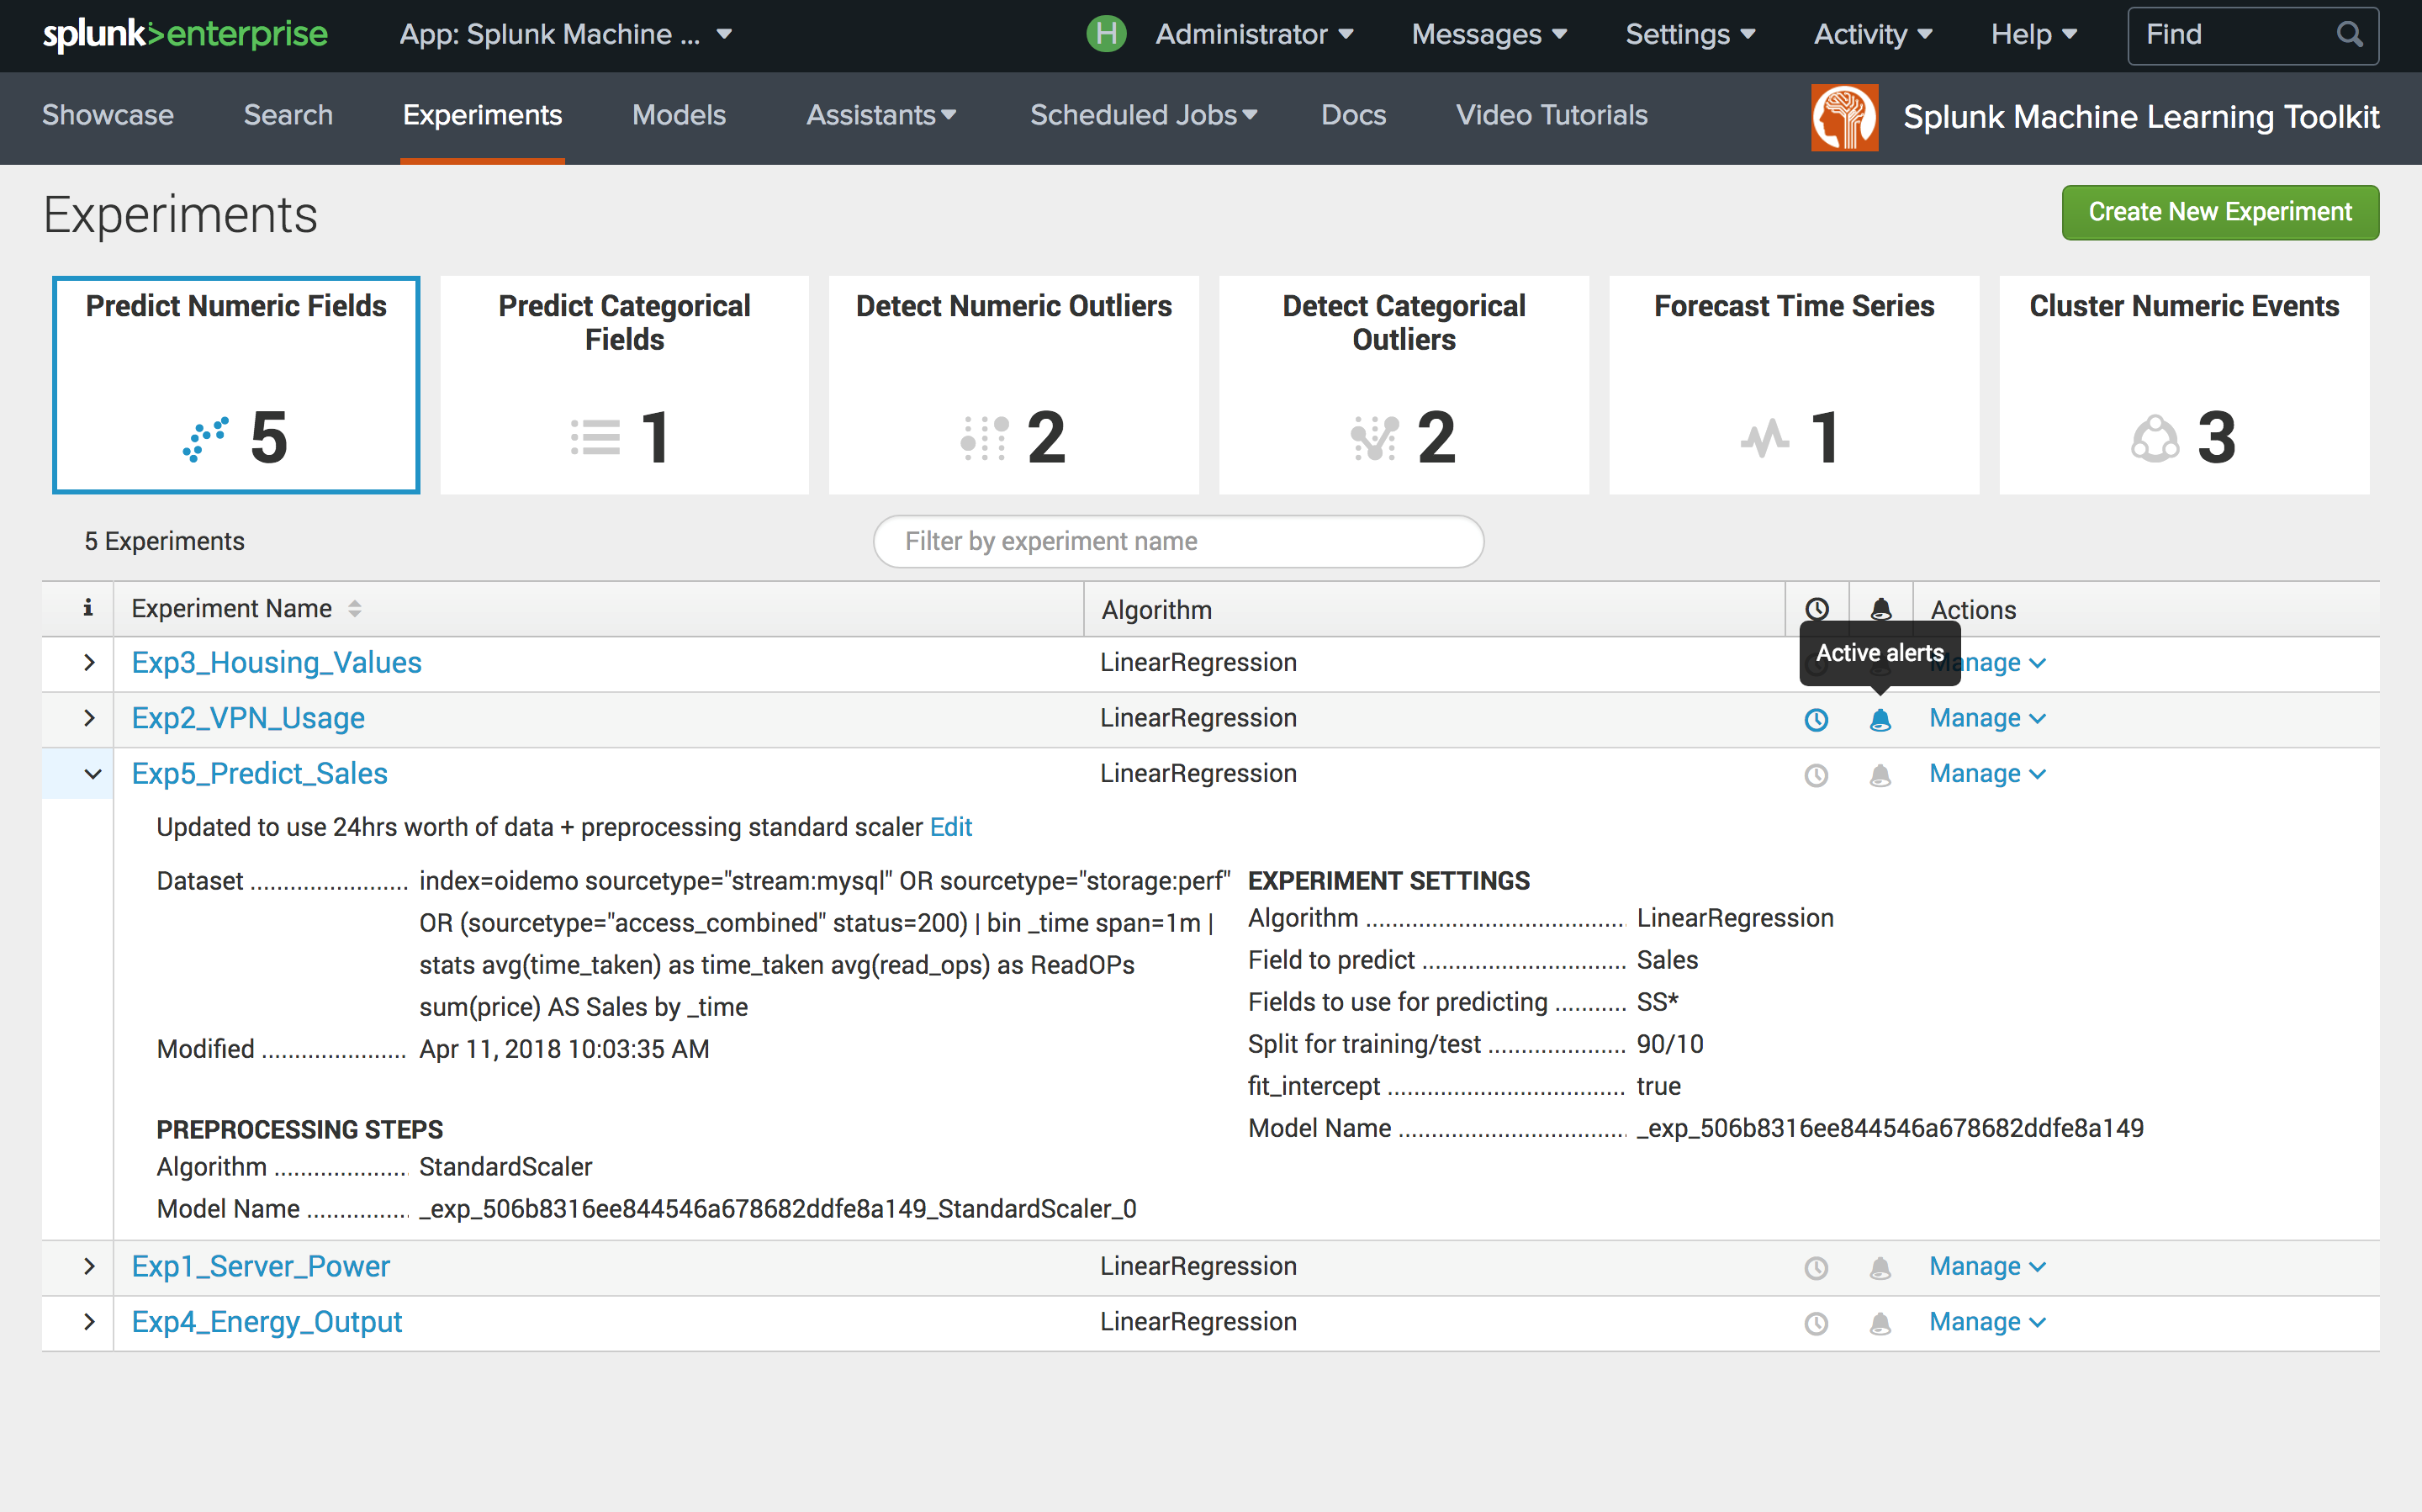
A single interface also appeared, allowing you to view existing models and their parameters, configure access to experiments for various user roles, set alerts, receive a history of experiments and alerts.
Conclusion
Of course, in the new release there are many more innovations and features, for example, such as: Diagnostic UI , optimization of working with clusters: minimized the impact on the system during updates, restarts, regular scheduled searches and many other changes. As part of the article, we tried to tell you about the most interesting innovations that anyone who uses Splunk may encounter.
Additionally
For the most in-depth study of the issue, you should install the Splunk Enterprise 7.1 Overview application , as well as watch the official release video .
Also, do not forget that for any question regarding Splunk : its implementation, updating, development of applications on it, adding new, difficultly indexable events and everything else, we can help you.