February 4, 2018 at 14:59
Why logistic regression results in SAS and R do not match
Perhaps this topic will not be a discovery for experienced statisticians. However, I am sure that less experienced statisticians and R-programmers will be able to discover new aspects of logistic regression, since I was able to find details about the reasons for the discrepancy between the statistical packages only in the SAS documentation.
For more than four years I have been doing biostatistics, and all this time I use the R. RStudio language in my work, making it an incredibly simple, convenient and at the same time powerful analysis tool. However, for almost a year now I have been working in a contract research organization (CRO). Business dictates its standards of work, and the calculations for the vast majority of serious clinical trials are performed on the SAS platform .
SAS as a language is not bad and even good in some ways, although it is built on the basis of a number of strange concepts from the distant 1976, the description of which could be an occasion for a separate large article. The presence of these concepts in SAS today is understandable: its history, leading to work on the basis of a deck of cards, the company is currently forced to maintain backward compatibility with previous versions of its products, as in clinical trials is crucial reproducibility concept ( reproducible research ). This makes it impossible to make radical changes to the syntax of the language, as happened between versions of Python 2.7.x and 3.x. What is really sad is the current state of the IDE for SAS, none of which (three of them are included in the package) is even half as good as RStudio.
It is believed that the transition from SAS to R is much simpler, but my story is the opposite. My way to learn the features of SAS is to compare the results obtained in it with R. This practice became especially relevant after the case when during the double programming both SAS programmers misunderstood the SAS Help manual and made the same mistake in the method implementation. In addition, since even the FDA uses R, it is very important that the potential validator is able to obtain the same calculation results.
In one study, we needed to build models based on logistic regression in order to analyze the possible relationship between a number of baseline characteristics of patients with hepatitis C and treatment success.
The task is quite trivial (but if you are not familiar with it, I offer examples for SAS and for R with a good description of the interpretation ). Questions arose when the results of the usual univariate logistic regression in several cases did not match between the two packages. Most often, of course, the results are the same. Sometimes it is only a matter of rounding (for example, 0.1737 and 0.1738 for p-value ). But in some cases, the difference in the values of β- coefficients and probabilities (p-value ) is available.
Consider an example with the categorical predictor “Method of infection”, in which the “Transfusion” value is selected as the base level of the factor.
As you can see from the example, despite the fact that the estimates of the odds ratios coincide, the values of β-coefficients in the models are different. Moreover, the exp (b) values in SAS do not coincide with the odds ratio (OR) estimates . What is most critical is for us - the corresponding β-coefficients of probabilities ( p-of value ) do not coincide with the results of R.
In search of a reason and a way to resolve this issue, I unexpectedly discovered that the user communities of R and SAS overlap very weakly, and as a result, only the almighty Google could help me. Many thanks to Anna-Marie de Mars , who, with a similar comparison of SAS results with SPSS, contacted the SAS representative and presented the solution in her blog, which allowed me to promote the chain.
The reason for the differences lies in the way of coding factor levels, which are used by default statistical packages. R and SPSS when building a model use the approach with coding of the basic level ( reference cell parameterization , you can also find options for reference coding or dummy coding) and calculate the OR based on the exponentiation of the values of β-coefficients, while SAS takes a different approach - effect coding ( effect parameterization or effect coding ), which uses a more complex algorithm. Detailed examples of model building for these coding schemes are presented here .
Now the OR estimates in SAS completely coincided with the exponents of the corresponding β-coefficients, and the p- values are completely identical to the results of R.
Judging by this material, SAS offers a very wide range of possible coding options for factor levels when building models. Unfortunately, I could not find something like this in the documentation for R. I would be grateful if the hawkers would be able to suggest such materials in the comments.
Introduction
For more than four years I have been doing biostatistics, and all this time I use the R. RStudio language in my work, making it an incredibly simple, convenient and at the same time powerful analysis tool. However, for almost a year now I have been working in a contract research organization (CRO). Business dictates its standards of work, and the calculations for the vast majority of serious clinical trials are performed on the SAS platform .
SAS as a language is not bad and even good in some ways, although it is built on the basis of a number of strange concepts from the distant 1976, the description of which could be an occasion for a separate large article. The presence of these concepts in SAS today is understandable: its history, leading to work on the basis of a deck of cards, the company is currently forced to maintain backward compatibility with previous versions of its products, as in clinical trials is crucial reproducibility concept ( reproducible research ). This makes it impossible to make radical changes to the syntax of the language, as happened between versions of Python 2.7.x and 3.x. What is really sad is the current state of the IDE for SAS, none of which (three of them are included in the package) is even half as good as RStudio.
It is believed that the transition from SAS to R is much simpler, but my story is the opposite. My way to learn the features of SAS is to compare the results obtained in it with R. This practice became especially relevant after the case when during the double programming both SAS programmers misunderstood the SAS Help manual and made the same mistake in the method implementation. In addition, since even the FDA uses R, it is very important that the potential validator is able to obtain the same calculation results.
Essence of the question
In one study, we needed to build models based on logistic regression in order to analyze the possible relationship between a number of baseline characteristics of patients with hepatitis C and treatment success.
The task is quite trivial (but if you are not familiar with it, I offer examples for SAS and for R with a good description of the interpretation ). Questions arose when the results of the usual univariate logistic regression in several cases did not match between the two packages. Most often, of course, the results are the same. Sometimes it is only a matter of rounding (for example, 0.1737 and 0.1738 for p-value ). But in some cases, the difference in the values of β- coefficients and probabilities (p-value ) is available.
Consider an example with the categorical predictor “Method of infection”, in which the “Transfusion” value is selected as the base level of the factor.
Code and results R (the response is represented by the values 0 and 1):

library(haven)
library(car)
setwd("C:/test")
adis <- read_sas("adis.sas7bdat")
adis <- recode(adis, "''= NA")
adis$MODEHCV = factor(adis$MODEHCV,
                      levels = c("Blood transfusions",
                                 "Dental procedures", "Other"),
                      ordered = FALSE)
mylogit <- glm(SVR12FL ~ MODEHCV,
               data = adis,
               family = binomial(link = 'logit'))
SAS code and results (response represented by N and Y):
%let dir=C:\test;
LIBNAME source "&dir\DataIN" access=readonly;
DATA adis;
  set source.adis;
RUN;
PROC LOGISTIC data = adis;
  class MODEHCV (reference = 'Blood transfusions');
  model SVR12FL (event = 'Y') = MODEHCV / expb;
RUN;
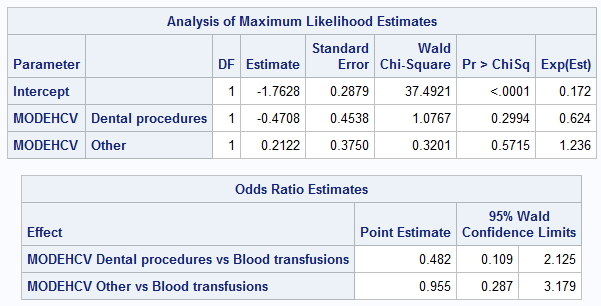
As you can see from the example, despite the fact that the estimates of the odds ratios coincide, the values of β-coefficients in the models are different. Moreover, the exp (b) values in SAS do not coincide with the odds ratio (OR) estimates . What is most critical is for us - the corresponding β-coefficients of probabilities ( p-of value ) do not coincide with the results of R.
Decision
In search of a reason and a way to resolve this issue, I unexpectedly discovered that the user communities of R and SAS overlap very weakly, and as a result, only the almighty Google could help me. Many thanks to Anna-Marie de Mars , who, with a similar comparison of SAS results with SPSS, contacted the SAS representative and presented the solution in her blog, which allowed me to promote the chain.
The reason for the differences lies in the way of coding factor levels, which are used by default statistical packages. R and SPSS when building a model use the approach with coding of the basic level ( reference cell parameterization , you can also find options for reference coding or dummy coding) and calculate the OR based on the exponentiation of the values of β-coefficients, while SAS takes a different approach - effect coding ( effect parameterization or effect coding ), which uses a more complex algorithm. Detailed examples of model building for these coding schemes are presented here .
Change the default schema in SAS to reference parameterization
PROC LOGISTIC data = adis;
  class MODEHCV (reference = 'Blood transfusions') / param = ref;
  model SVR12FL (event = 'Y') = MODEHCV / expb;
RUN;
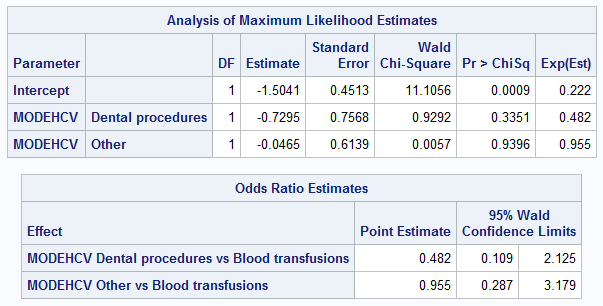
Now the OR estimates in SAS completely coincided with the exponents of the corresponding β-coefficients, and the p- values are completely identical to the results of R.
PS
Judging by this material, SAS offers a very wide range of possible coding options for factor levels when building models. Unfortunately, I could not find something like this in the documentation for R. I would be grateful if the hawkers would be able to suggest such materials in the comments.