NLog extension for error monitoring
Did you have any idea that correcting errors using the log file is not very effective?
Want to fix errors faster and easier?
Then read my article in which I will tell you how you can monitor application errors using the NLog extension.

The error monitoring solution should be suitable for existing applications where a huge amount of code is written that no one will redo for the sake of monitoring.
Error monitoring should be carried out transparently, which means that error handlers should not have code that monitors it.
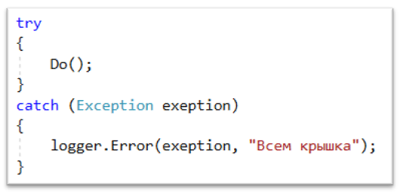
Let's take a close look at the typical exception handling code:
What can be used as an entry point for error monitoring?
True, the logging system will help us.
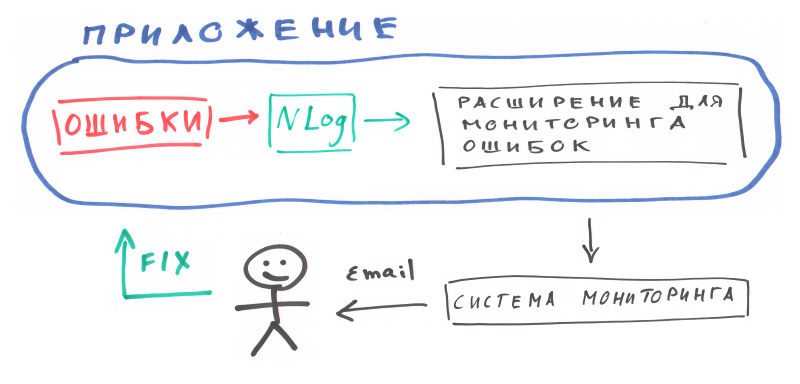
The logging system should have an extension that will collect, group, and send errors to the monitoring system. The monitoring system will send a notification to the developers, the developers will fix the error.
Below is a diagram of how it works:
This is exactly the scheme of work that the NLog extension for the Zidium monitoring system implements. What is Zidium? This is a cloud-based application monitoring service that you can use for free.
You can install the extension through the nuget package - NLog.Zidium.
You can find out more about the extension in the documentation .
To show how everything works, create a simple console application and connect it to the monitoring system. Let there be an error in the application, which is written to NLog.
Application code
Connect the extension to NLog
Configure Zidium.xml The
configuration file Zidium.xml should be in the folder where the exe-file of the program is located.
In the file you need to specify:
accountName - the name of your account, you can look in your account
secretKey - the secret API key, you can see in your account
defaultComponent id - the ID of the component that you need to create in the dashboard of the monitoring system.
Configure NLog.config
Launching the application and checking
Launch the console application, after completion go to the personal account of the monitoring system.
If everything is done correctly, then the Hello World component in the personal account of the monitoring system will turn red, an email notification will be sent to you. The Errors page will display the error statistics.
Now you know a simple and quick way to connect the application to the error monitoring system. Correct errors faster and easier.
I wish you every success.
Want to fix errors faster and easier?
Then read my article in which I will tell you how you can monitor application errors using the NLog extension.
How it works?
The error monitoring solution should be suitable for existing applications where a huge amount of code is written that no one will redo for the sake of monitoring.
Error monitoring should be carried out transparently, which means that error handlers should not have code that monitors it.
Let's take a close look at the typical exception handling code:
What can be used as an entry point for error monitoring?
True, the logging system will help us.
The logging system should have an extension that will collect, group, and send errors to the monitoring system. The monitoring system will send a notification to the developers, the developers will fix the error.
Below is a diagram of how it works:
This is exactly the scheme of work that the NLog extension for the Zidium monitoring system implements. What is Zidium? This is a cloud-based application monitoring service that you can use for free.
You can install the extension through the nuget package - NLog.Zidium.
You can find out more about the extension in the documentation .
Hello world
To show how everything works, create a simple console application and connect it to the monitoring system. Let there be an error in the application, which is written to NLog.
Application code
using NLog;
using System;
namespace NLog2
{
    class Program
    {
        private static Logger logger = LogManager.GetCurrentClassLogger();
        static void Main()
        {
            logger.Info("Начинаем запуск приложения");
            try
            {
                throw new Exception("Упс");
            }
            catch (Exception exeption)
            {
                logger.Error(exeption, "Ошибка запуска приложения");
            }
            LogManager.Flush();
        }
    }
}
Connect the extension to NLog
PM > Install-Package NLog.ZidiumConfigure Zidium.xml The
configuration file Zidium.xml should be in the folder where the exe-file of the program is located.
In the file you need to specify:
accountName - the name of your account, you can look in your account
secretKey - the secret API key, you can see in your account
defaultComponent id - the ID of the component that you need to create in the dashboard of the monitoring system.
Configure NLog.config
Launching the application and checking
Launch the console application, after completion go to the personal account of the monitoring system.
If everything is done correctly, then the Hello World component in the personal account of the monitoring system will turn red, an email notification will be sent to you. The Errors page will display the error statistics.
Conclusion
Now you know a simple and quick way to connect the application to the error monitoring system. Correct errors faster and easier.
I wish you every success.