January 24, 2018 at 21:32
How dtraceasm works in JMH
 The latest version of Java Microbenchmark Harness (JMH) has a new profiler -
 dtraceasm,long awaiteda port perfasmon Mac OS X that can display the assembler profile of the Java benchmark.
A quick poll showed that it’s not clear to everyone how it’s possible, having received the Java method at the input, to show the assembler listing of the compiled method with the hottest instructions, their distribution and a small profile like “And the virtual machine spent another 5% of the time method Symbol::as_C_string(char*, int). "
In the process of porting, perfasmit turned out that in fact ™ everything is not very complicated and there was a desire to tell how such a profiler is arranged.
To understand the article, it is highly advisable to familiarize yourself with JMH, for example, by looking at examples of its use.
Introduction
 What should such a profiler do?
For a Java benchmark, it must show exactly where most of the processor time is spent at the level of the generated code.
At the same time, there is usually a lot of generated code, so it should be able to do it quite precisely so that it does not have to be searched with fire for the information we need in the profiler output.
For example, for a method that counts the logarithm:
@Benchmark
public double log(double x) {
    return Math.log(x);
}dtraceasmor perfasmshow the profile as in the screenshot to the left, blaming the instructions for everything fstpl. Due to the strong pipelining of modern processors, such a profile can be mistaken, and often it makes sense to look not only at the instruction, which is considered hot, but also at the previous one. Here it is fyl2x, which counts the logarithm.
In fact, such a profiler is very similar to perf annotate, but is able to work with JIT-compiled Java code.
What for?
But why at *asmall might a profiler be needed if you are not writing your JIT compiler? Last but not least, of course, out of curiosity, because it helps to answer the following questions very quickly:
- And what was my method compiled into? (of course, you can go to the conclusion
PrintAssemblyand find the right place there or use JITWatch , but this is usually less convenient) - What optimizations can the JIT compiler do or cannot do, is it possible to outwit or confuse it?
- How will the generated code change if I change the garbage collector?
- How much does one's own perception of reality (“it will definitely slow down in this method
Math.sqrt”) differs from harsh reality - And why is code written in one way faster than the same code, but written a little differently?
In addition to curiosity, it is useful to be able to answer the same questions if you suddenly decide to optimize some small place, for example, your thread-safe queue or a highly specialized class .
Well, if you use the tool, it’s useful to at least roughly understand how it is arranged inside, so as not to perceive it as some kind of magic and have an idea of its capabilities and limitations.
Printassssembly
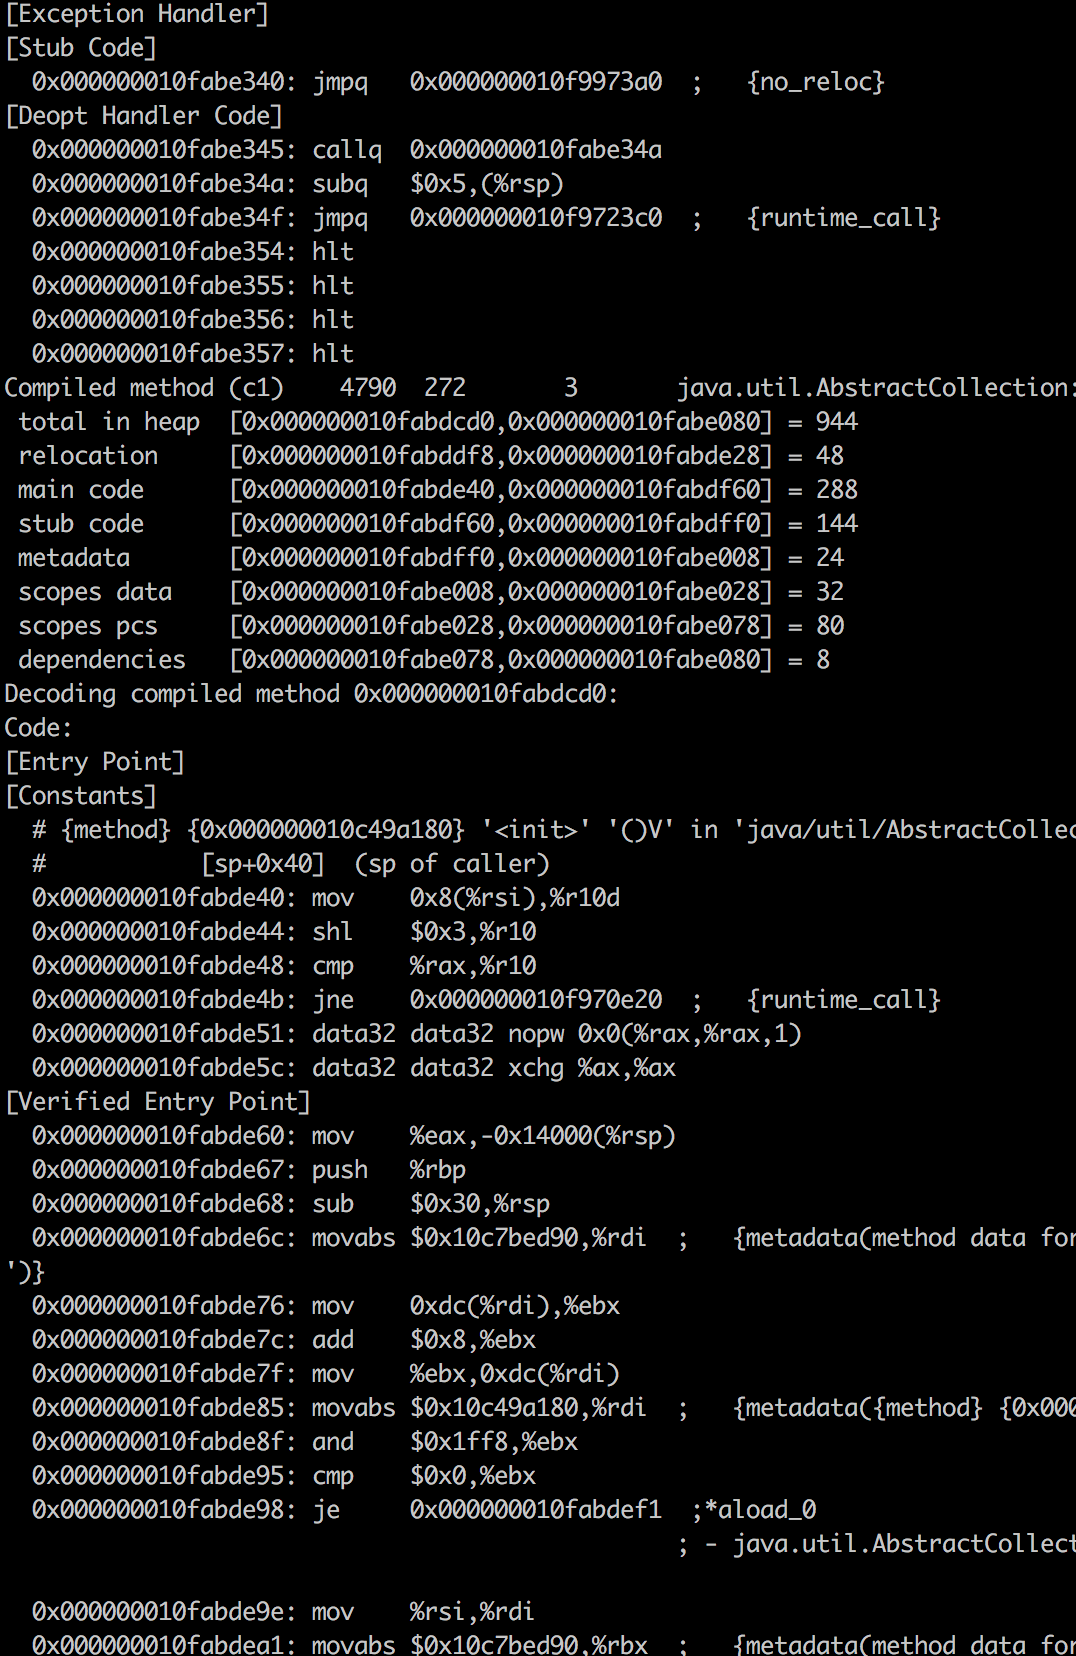 To build a profile using the generated code, you must first get this generated code from somewhere
 but we don’t have money. Fortunately, everything has already been invented for us and the virtual machine (hereinafter I mean only hotspot) can print all compiled code in stdout, you only need to enable the necessary flag ( -XX:+PrintAssembly) and put it in a $JAVA_HOMEspecial disassembler. There are enough instructions on the Internet how to do this, usually you don’t need to collect anything yourself and just download the assembled disassembler for your platform.
PrintAssembly is useful, but not the most convenient. Its output has a well-known format, it is even annotated with comments on which bytecode instruction the current line belongs to, which method is currently printed or in which register which argument lies, but it is measured in megabytes and it will contain all versions of the compiled method (C1 compiler, C2 compiler, version after deoptimization, GOTO 1), so finding the desired one is usually extremely difficult.
The profiler in this huge conclusion should show exactly where we need to look in order to see the hottest part of the benchmark. And in order to write such a profiler, in this conclusion we are interested in information about which method of instruction refers to what address they have in memory and, optionally, comments from the disassembler.
Dtrace
DTrace is a dynamic tracing framework supported on Solaris, FreeBSD, Mac OS X, and partly on Linux. It consists of a kernel module in which the main functionality and client programs in the special D language are implemented (do not confuse with anotherlanguage D). The client program declares which event it is interested in, and the kernel module compiles the program into a special bytecode, carries out some preparatory work and starts to execute this program when necessary events. At the same time, the D language is safe and does not allow you to deploy much, for example, go into an endless loop or paint the application, so programs on it can be executed directly in the kernel. The framework itself is very powerful and allows you to do a lot of very interesting and non-trivial things that are beyond the scope of this article, I will only consider the functionality necessary for dtraceasm.
dtraceasmuses an event provider profile-nthat does not hang on any special event, but simply calls the user program at fixed time intervals.
The mechanism is simple, the kernel registers a timer with a given frequency and starts to interrupt the process that is currently running on the CPU, and calls our DTrace script in the handler.
The script itself is as follows:
profile-1001 /arg1/ { printf("%d 0x%lx %d", pid, arg1, timestamp); ufunc(arg1)}You can read it like this: "1001 times per second, type the pid of the current executable process, its PC, current time and the name of the executable method (along with the library name) if the process was currently running in userspace."
PC ( program counter ) is a special register containing the address of the instruction that is currently being executed. But where does the name of the method come from?
Since the kernel knows everything about loaded libraries, executable files and their symbols (methods are symbols), and the addresses where they are loaded, it can use this knowledge to build the index "instruction address -> library -> specific method". That is, knowing the value of PC, you can find out where this instruction came from.
Example
In the library, the lib.somethod foo()begins at the offset 1024, the next method bar()at the offset 2048, and the library itself is loaded into the process at the address 1048576. If the PC has the current value in the interval [1048576 + 1024, 1048576 + 2048], now the method foo()from is executed lib.so.
But if the code was loaded dynamically (in fact, what the JIT compilers do) and there is no information about symbols, then the kernel will not find the name of the method.
Just add water
How to get annotated assembler benchmark now?
The benchmark is launched in a separate JVM with a flag, PrintAssemblyand immediately after its launch, a DTrace script is launched, which writes its result to a file.
Having these data on hand it remains only to do the following steps:
- DTrace exhaust filtered by pid and benchmark iteration time
- Lines without symbol names are combined with the addresses of instructions from the output of PrintAssembly, they get a string representation of the form
inc %r10dand an optional comment from the disassembler - The result is aggregated into a profile in which identical lines collapse and a counter of their frequency is wound for them
- With the help of some heuristic in the profile is a continuous region of "hot" instructions. For example, if the instructions in the region occupy 10% of the total profile and the addition of neighboring instructions adds an insignificant number to the weight of the region, then we can assume that it’s interesting to look at it
- Native methods fall into a separate profile, "hot methods", also sorted by frequency
- The result is beautifully formatted and sent to the user in the console
At the same time, the problems with the fact that the PrintAssembly output contains code compiled by both the C1 compiler and C2 go away themselves, because only one version of the compiled code will get into the hot profile after warmup iterations (if you do not have a steady state benchmark constant recompilation occurs, plus *asmprofilers filter events from warmup iterations), and native methods (the interns of the JVM itself, native calls etc.) will fall into the top of hot methods.
NB: from the point of view of porting to Mac OS X, you just had to “ do ” the part with PC sampling using DTrace, the rest of the infrastructure for processing results in JMH has existed since the time perfasmand nothing new was done by the author of the article (I).
Conclusion
Using a combination of simple tools, you get a pretty powerful profiler that for an unprepared developer can look like a black box, and now you know how it really works and that there is no magic or rocket science in it (and you can easily understand how it works, for example perfasm).
Special thanks to Alexei Shipilev for reading all the inaccuracies in the article and making sure that I carry knowledge to the masses, not nonsense :)