January 11, 2018 at 15:34
Data Modeling Zone EU 2017
At the very beginning of the new working year - a few words about one of the events of the past year.
Data Modeling Zone is a franchise that brings together conferences on the construction of a logical database architecture. The past few years have been held in the USA and Europe, and this year will be held for the first time in Australia. In 2017, two forums were organized under the DMZ brand, both were held in the fall: October 16–18 - in Hartford, USA, and October 23–25 - in German Düsseldorf. I happened to take part in the role of a listener in the last of them. This article provides a brief overview of the presentations that I saw at the conference, and my impressions of it in general.
The name of the conference makes it clear that the key issue is the different aspects of building a data model. Most of the topics announced were related to data warehouses, but they were also relevant for any information system. My expectations were contradictory: on the one hand, the speakers included recognized community leaders, and on the other, an abundance of hourly presentations that did not provide for in-depth consideration of issues.
The main program was presented by five tracks:
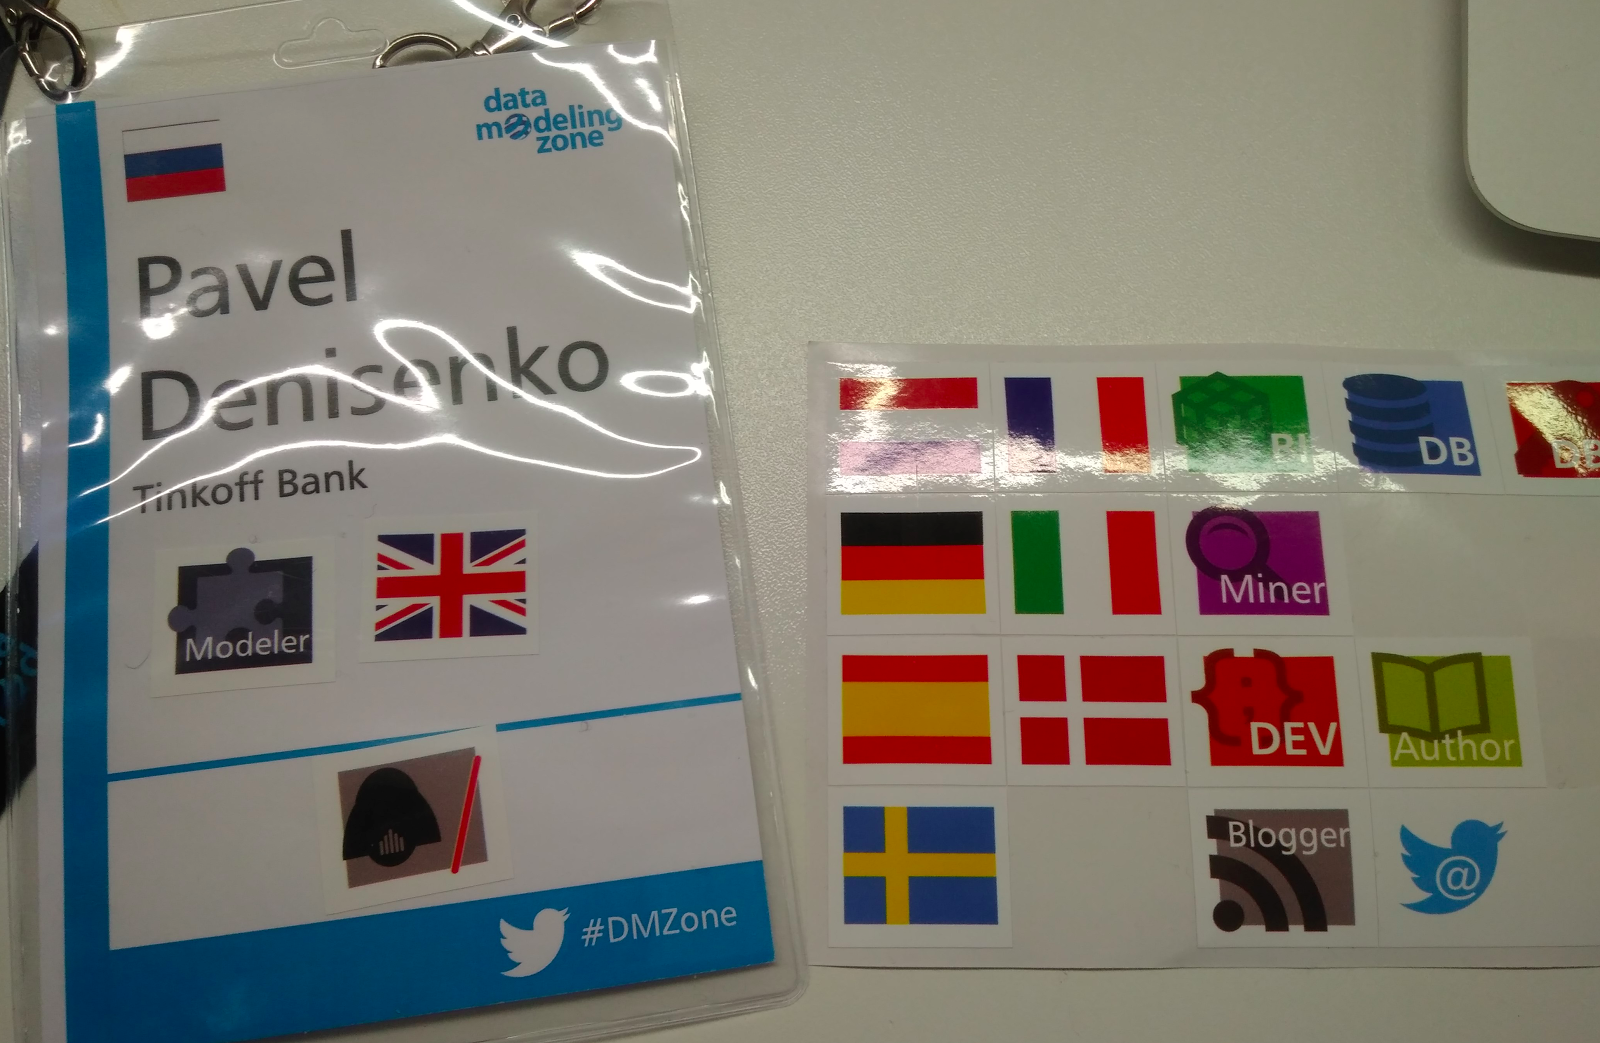
Together with the badge, the participants were given a set of stickers. With their help, the badge holder could indicate the languages he speaks and select one or more professional roles. The idea is original and entertaining, but useless.
The first day began with a three-hour lecture on various aspects of versioned data storage. Building historicity is a topic around which there have been many lively debates within our team. Therefore, I could not pass by the keywords merging timelines, Data Vault Satellites, historization in the announcement of the speech.
Speaker - Dirk Lerner, one of the Data Vault missionaries in Germany, founder of TEDAMOH (The Data Modeling Hub), author of a good professional blog .
The presentation began with an overview of recording formats for time intervals. We examined 4 formats that differed in the way they recorded the beginning and end of the interval: open or closed. In the first example, a sequence of two intervals was selected: T1 = 2016, T2 = 2017. From the explanations, I realized that the open format for recording the boundary of an interval (open) implies an exception of the border, and closed (closed) means inclusion. Like the way numerical intervals are written in algebra.
But the following example baffled me. It had one interval - the period of the conference. The first point of the problem (closed / closed) did not cause any difficulties. But a discussion arose over the other three, during which the definitions of all formats were finally clarified.
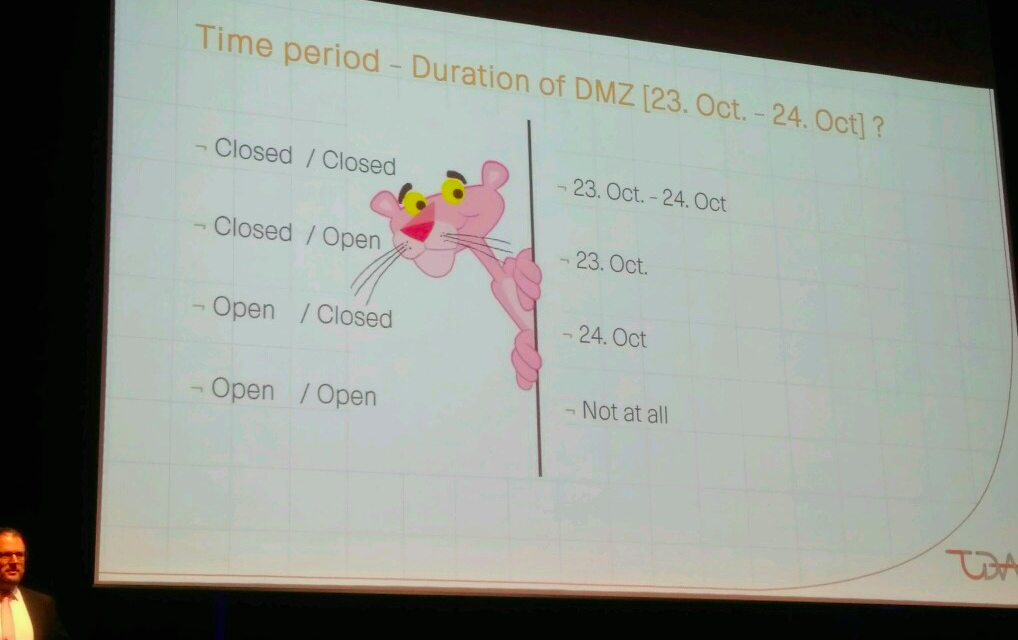
The bottom line is that the period boundary in the open format is denoted by the first determined value from the adjacent period. That is, the “open” end of the period is designated as the first measure of the next period, and the beginning is designated as the last measure of the previous one. The periods from the first example had “neighbors” on the fact of their belonging to the Gregorian calendar. The second example was more specific and local, so it was impossible to determine the boundaries of the proposed interval through the "open" format.
In conclusion, they talked about the preference of the close / open format, since it is it that allows us not to depend on the clock cycle of the monitoring system. Indeed, if you build a continuous history of changes in the state of the object, then the end of the current period occurs at the moment of the change of state, that is, with the beginning of the next period. To calculate the end of a closing interval when using the close / close format, it is necessary to subtract 1 clock clock from the time when a new state is fixed. Whereas the use of the close / open format allows the state change time to be indicated both as the beginning of a new period and as the end of the old one. And it doesn’t matter in what units the time is measured - the close / open format is independent of the clock cycle size of the storage. This is one of the reasons why it is most popular and included in the ISO 9075: 2011 standard.
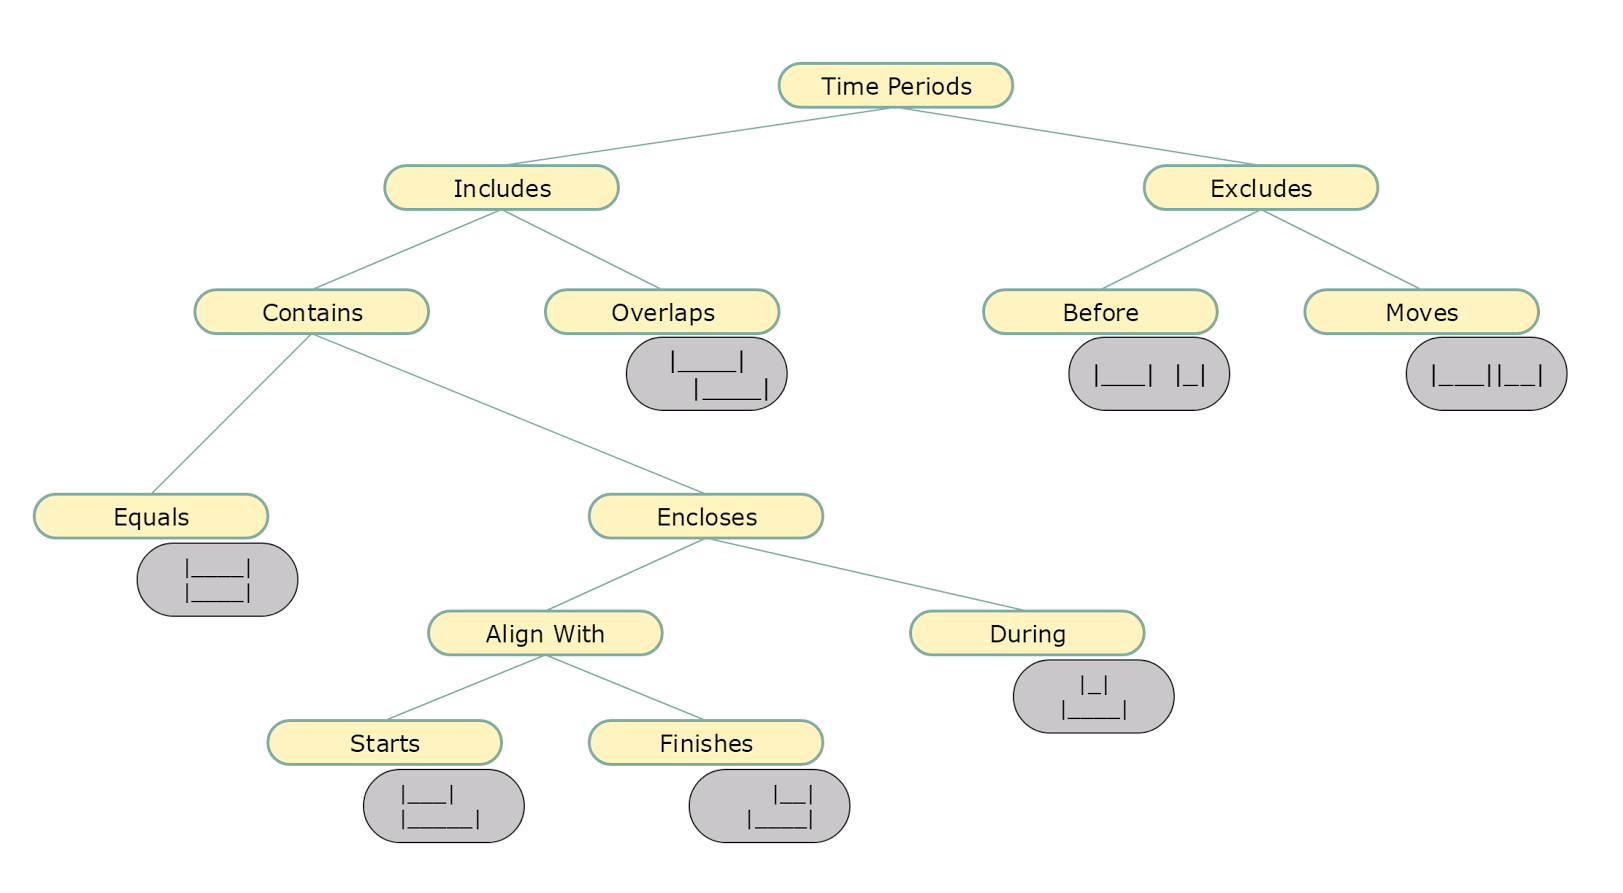
The next topic was the classification of intersections of time intervals. Dirk has clearly demonstrated how not to get confused in issues that seem obvious. In essence - nothing new, but the systematic consideration of the issue makes a good impression.
But all this was a warm-up before the main topic of the presentation, namely, saving data in the context of two chronologies: business and technical. The unusual word bitemporal in the topic title is just about that. Dirk began with a fairly simple abstract example, in which we have an array of data with a key, a pair of business attributes, the start date of the record's relevance from a business point of view, and the date the data was loaded into staging.
Stagingtable
Satellite
The idea is to keep a history of changes in history. Consider processing the first two records from staging. There are no problems with the first record - at the time of its loading, there is no talk of processing changes. A record is added to the satellite that a given key has an attribute vector (10.10) - “for centuries”. The second record from staging contains an update on one of the attributes, as a result of which the vector has taken the value (11,10). To handle this event, you need to do three things:
The following example was decided by the students on their own. It was about the student timetable.
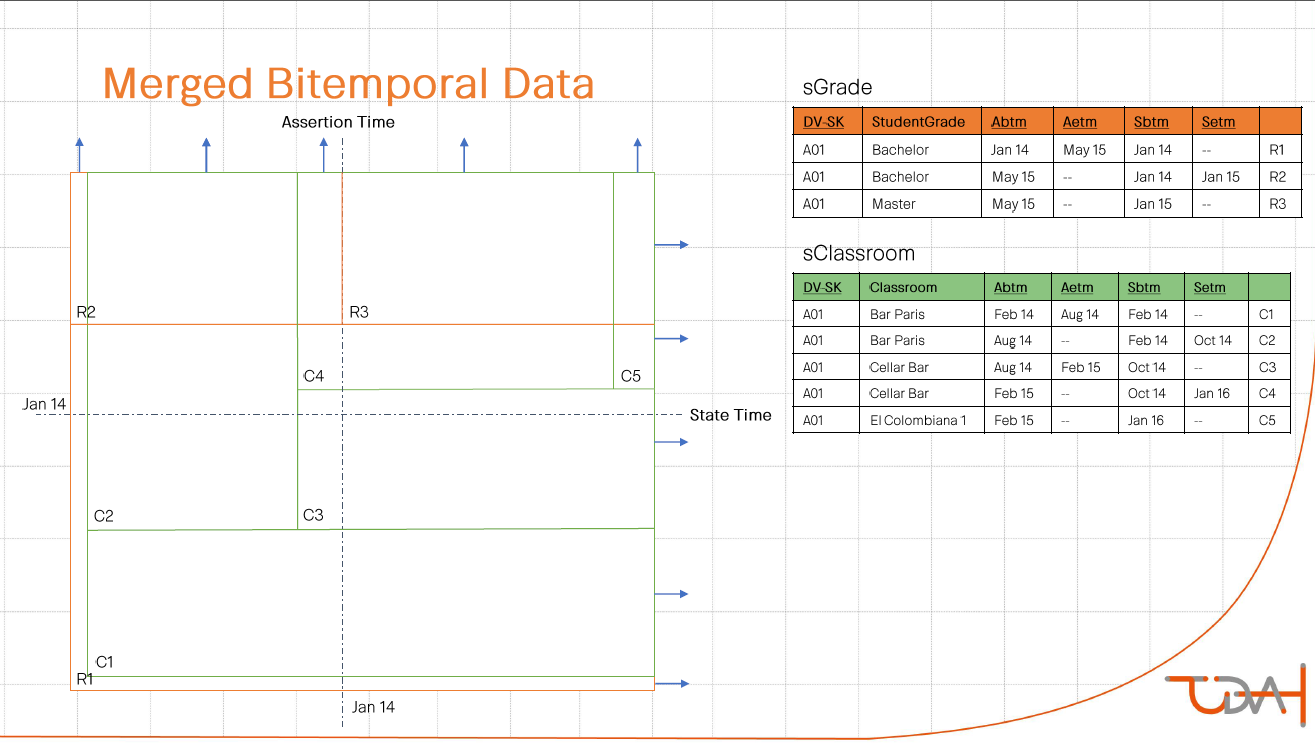
A curious visualization was used to demonstrate the solution. Double historicity was presented in the form of a coordinate plane. On the abscissa axis is business time, on the ordinate axis is technical time. Each record corresponds to one of the areas of the plane. The cutting goes diagonally - to the right and up.
The final example was the most difficult. Initial data - a plan of price changes in relation to the day of the Black Friday marketing campaign.
Staging table
The difficulty was that the plan was revised not only in terms of changing the price itself, but also in terms of breaking down the time continuum of the decision. I note that the key to the successful completion of the task was the understanding that for any moment of "technical" time in the repository there should be data that completely covers the entire "business" chronology. Not without effort, the problem was solved "on a piece of paper", but the question of automation of this not the most trivial algorithm remained open.
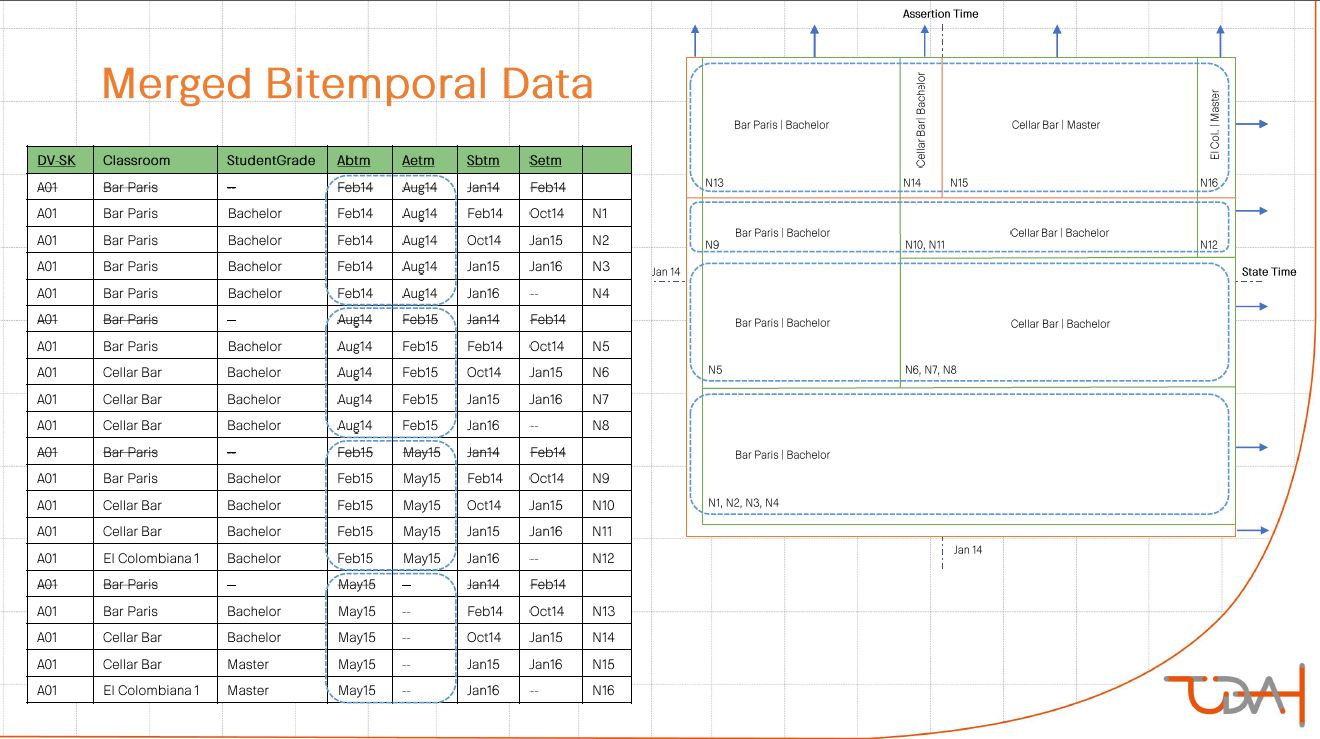
The next point of the program was a description of how to merge information from two satellites with double historicity into one dimension. To demonstrate, they chose an example with a student with a specific class schedule. He has a history of graduate change. The essence of the proposed method: cross join with the collapse of consecutive intervals.
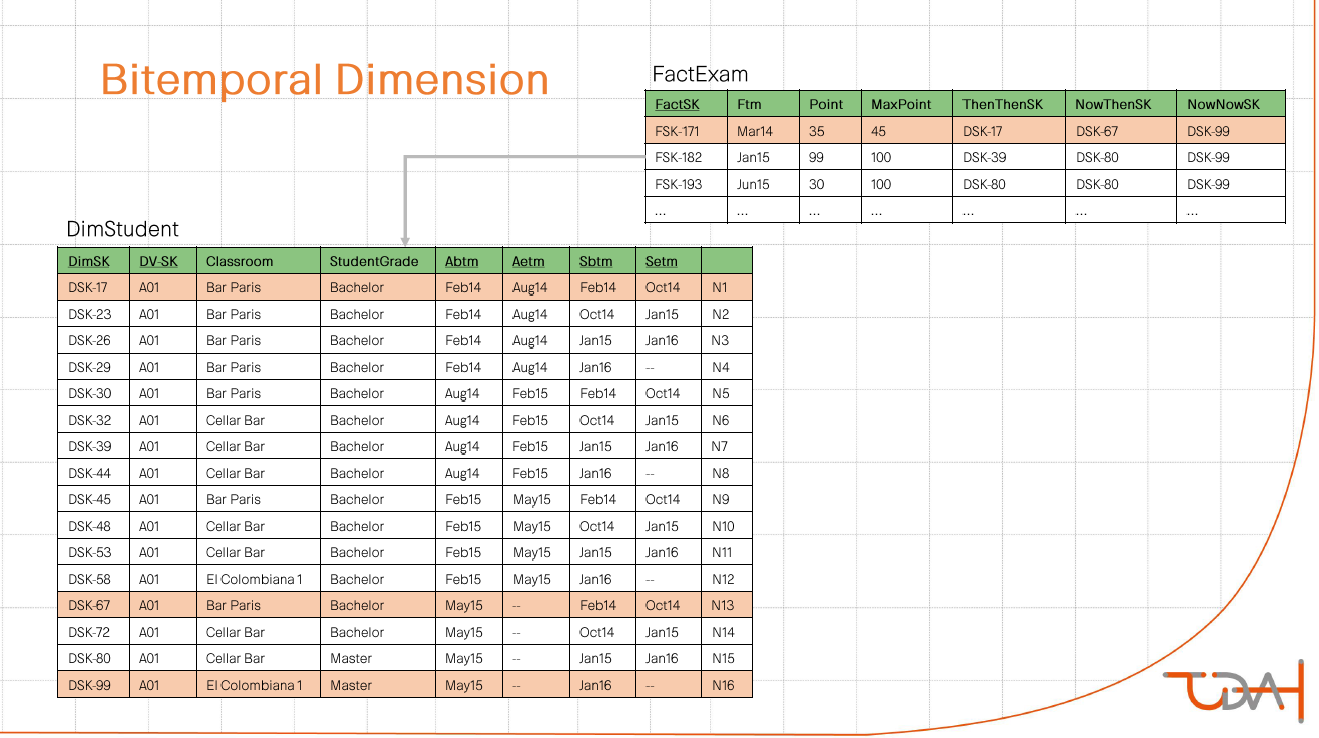
The last considered aspect of this topic was variability in the interpretation of information received at the output. There is a fact that a student has passed the exam. Information on the student’s timetable and academic degree for this fact can be determined in three different ways:
Perhaps this presentation was the most informative and informative for me personally. After it was followed by a block of performances in the genre of key notes.
The organizers made a set of on-duty phrases, from which the mention of the gender distribution among the participants was remembered: 165 men to 17 women. Then the “rock star” of data modeling came on the scene, the author of numerous books on the topic - Steve Hoberman. Steve said that today the most popular IT issues in this area are nosql databases and the cultivation of new modelers. He dwelled on the second in more detail, saying that the growth in the volume of metadata significantly exceeds the growth in the number of modelers. In this regard, he identified the 5 most popular skills in the coming years:
The next speaker was the data architect of the Central Bank of the Netherlands - Ronald Damkhov. Ronald told how he and his colleagues managed to build a repository on the principle of "multireality". It was a methodology that:
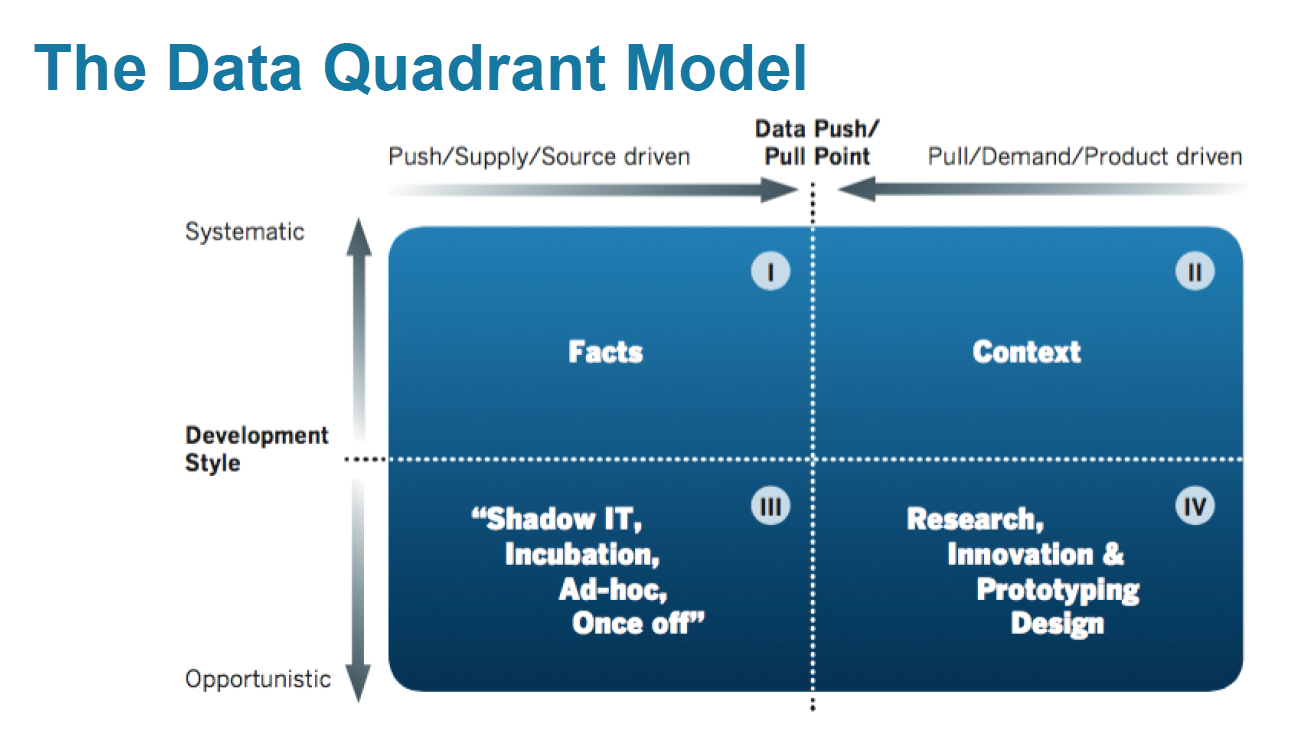
The idea is to present the entire storage in the form of a quadrant constructed in the coordinate system “flexibility-systematization” + “sources-business” and divided into 4 sectors:
It was emphasized that the division of data into “master data”, “big data” "," Metadata "and others are inefficient.
In the resulting coordinate system, there was an order for solving each of the 7 main tasks for designing a CD:
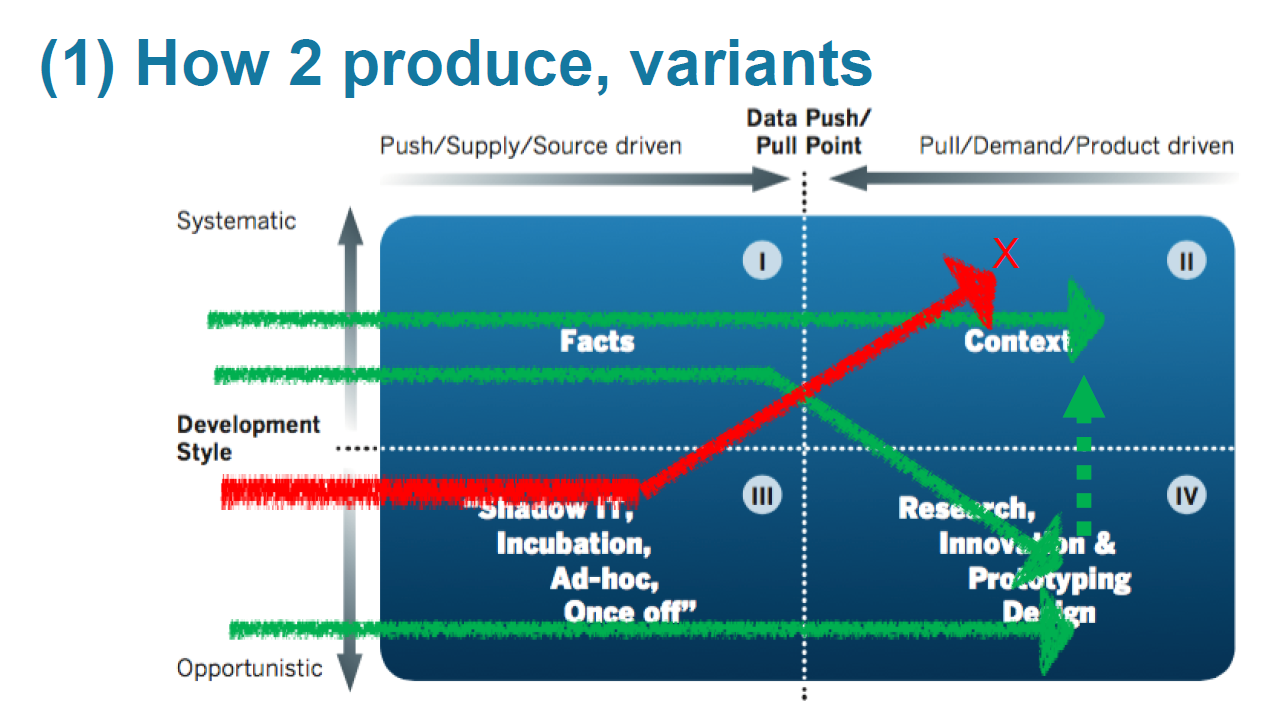
To solve the construction issue, for example, they proposed options (green - ok, red - not ok):
After Ronald, Steve Hoberman again took the floor. He told how the main determining factor in the development of IT in the next decade - blockchain technology - affects data modeling issues. Since Steve is the guru of modeling everything and everyone, the blockchain was immediately given a definition in the form of a logical data model.

According to Steve, the influence of the blockchain will be felt most strongly in matters of data management, data standardization and design of the architecture of data storage systems. Blockchain is unlikely to touch the development vector of relational DBMSs. But how it affects the Agile methodology is not yet clear.
It is curious that, as an example of the spread of this technology, Steve talked about the Ukrainian project, within the framework of which it is proposed to switch to the use of cryptocurrency for calculating state property sales transactions. This should help in the fight against corruption.
Everyone was invited to practice the delivery of the most famous in the field of data management certification DAMA DMBOK2. The training version of the exam included 20 questions. For instance:
Etc.
Curious theory. Enough abstract, but at the same time consistent and logical.
Initially, a demonstration of a system that provides a range of services for building a storage architecture was planned in a workshop format. But there were much fewer laptops, so the format was changed to presentation.
As a preamble, a series of statements of the class “Volga flows into the Caspian Sea” were declared. For example, that the main thing is to listen to the business, and automation is part of the process, not a technical solution. For example, a failed project was presented with a customer represented by a Russian company, whose representatives “believed that buying a system, they buy a magic wand”. After the presentation, I went over to inquire in more detail about this project. But all I heard is a request not to take these words as blasphemy of the Russian people - "this mistake is common to everyone." At the end of the introductory part, Power Designer was thoroughly criticized - old, ugly, complex, it makes no sense to keep the version.
The system itself during the demonstration looked really impressive. In fact, we saw only part of the capabilities, but it was stated that WhereScape Red provides a complete set of metadata and ETL management capabilities. As a confirmation, a diagram was presented on which the standard elements of the storage architecture, covered by the functionality of the system, were marked red:
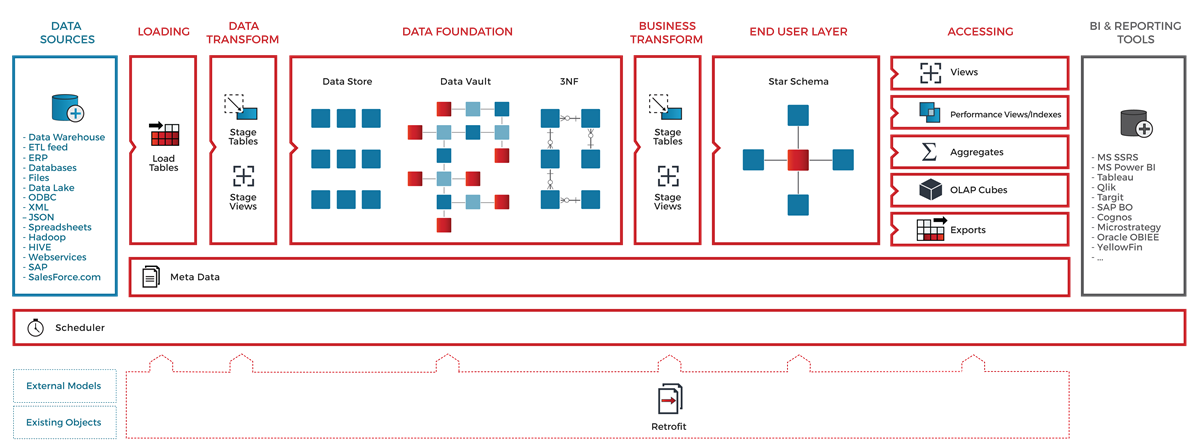
We started with the fact that the models of source systems are described, their changes are tracked. The modeling process itself consists in constructing a logical model of custom storefronts and determining the mapping of their fields with sources. After that, by pressing the magic button, the process of automatically building the staging and data vault layer model in accordance with predefined rules is started. The last step was to generate an ETL code and define a schedule. On the examples of the tutorial class, everything worked, of course, elegantly and elegantly. Among the features, I would single out the line by column. Verification and validation of changes have not yet been made, but they should appear in the next release. You can read more about the system features on the vendor page .
The first day ended with an amateur humorous show. Scenes from two adult men, whose keynote was self-irony about the hype around Data Vault, got bored after the first 15 minutes, although the whole performance lasted more than an hour. Looking at the number of screens of phones burning in the dark, it was hard not to feel sympathy for the speaking uncles.
The three-hour Australian seminar by John Gills was essentially a summary of his 2012 book, The Nimble Elephant. The topic is useful and does not lose its relevance. It is about using industrial patterns in model design. Currently, large vendors (for example, IBM and TeraData) offer off-the-shelf top-level model templates for different subject areas - “Industry Reference Model”. The most common classification of entities for many templates is the same. The concept John talked about is no exception. It provides for the use of types:
At the seminar, the participants needed to build a data model describing this business process to describe the production activities of the enterprise. It was proposed to do this with:
In addition, John presented an accurate schedule for constructing a data model using this approach:
The resulting conceptual model can be used not only to build a logical model of CD, but also as a single formalized business model of the enterprise, in accordance with which it is necessary to create logical models of these operating business systems.
The second seminar I was able to attend was conducted by Steve Hoberman. Steve is known not only for his books and the patented “Data Model Scorecard”. He is also popular as a teacher at seminars and related courses. In general, he confirmed his reputation: he spoke in an accessible, interesting and humorous way. True, the name of the seminar did not correspond to reality: it was about important and useful, but still basic principles of model building.
First, he talked about the concept of super-entities and their extensions, which intersected with the contents of the previous seminar. After that there was an assignment: it was necessary to study a small set of data presented in a flat denormalized display case and describing the assortment of a bookstore, and build a 3NF model. According to Steve, completing this task, we should have felt like archaeologists of data.
The next task was more entertaining. The source data was the schedule of commuter trains in one of the directions in the vicinity of New York.
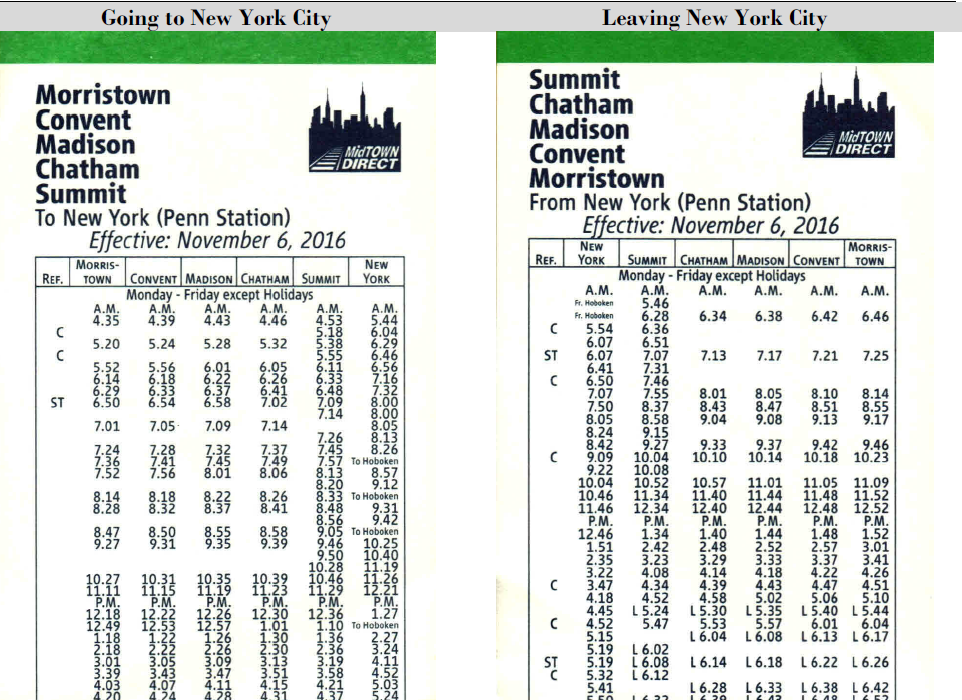
The task was to design a data model on the basis of which you can build analytics on the quality of the work of electric trains, namely, how accurately the schedule is implemented. The target model was to preserve data on both the timetable and the actual train schedule. The models presented by the three teams did not differ much in the set of entities, except for the differences in the names. What we commonly call a “branch” or “line” in different models was called: line, journey, route, trip, and “stage” - link or leg. From this, one of the obvious, but extremely important rules of modeling was deduced - the need to give a clear, most comprehensive definition to the entities represented in the model. The fundamental difference between the models was the method of storing actual data on the movement of trains: in some models, the granularity of these data was determined as the fact of the arrival of a train from the initial station to the given one. An alternative approach was to keep the train moving between two neighboring stations. In comparing the two methods, we came to the conclusion that it is important to remember when building a model which process we want to measure with its help.
In addition, paradigms for constructing logical models differed: one team chose Multi-Dimensional, the rest 3NF. Based on this, we formulated the thesis about the priority of creating a high-quality conceptual model, which can be easily converted to Multi-Dimensional, 3NF, Data Vault, and so on.
An extensive philosophical presentation on the role of architects in the modern world. The key idea is best expressed by the quote from architect Norman Foster:
" As an architect you design for the present,
with an awareness of the past,
for a future which is essentially unknown ."
Of the greats, Aristotle was still quoted with his words that architecture rests on three pillars: durability, beauty and functionality.
It was something about everything and about an hour span in keynote format. Among other things, it is worth highlighting an extremely important observation: the architect of the building differs from the architect of the industrial system in that it is not built into the object of his creation.
Not the most exciting presentation on how to properly save the history of an entity change. Key thoughts:
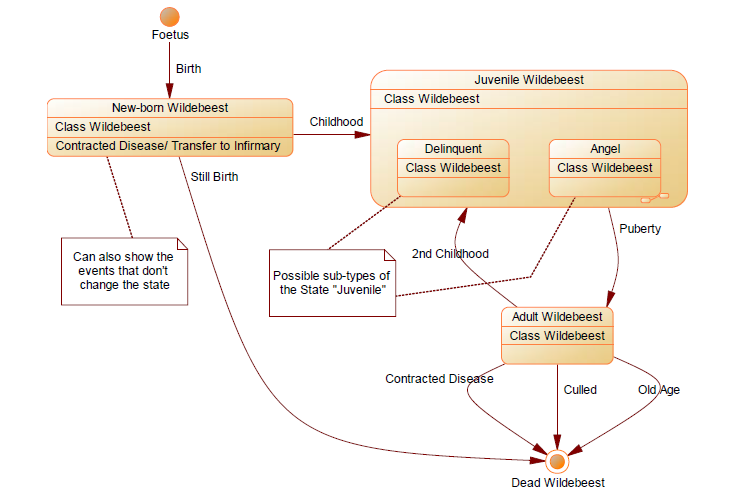
To demonstrate these good and important thoughts, a primitive example was chosen with the wildebeest life cycle model:
To consolidate the information received, we were offered to build a data model that automates the process of clearing bank checks. Either the task was formulated too abstractly, or the participants got tired by the end of the second day, but in the end there were no ready-made solutions.
The author is Gabor Golnhofer, an architect with 20 years of experience working on CD projects in finance, insurance, telecom, retail and education. The presented project was to transfer the storage of an indefinitely mixed architecture to Data Vault. The name of the customer company was not called, they only said that it is the market leader in its field in Hungary and is part of an international holding. According to the “tactical and technical characteristics”, their storage is comparable to our Tinkoff DWH:
From a technical point of view, the main prerequisite for rebuilding the repository was the high cost of the refinement process and performance problems. In addition, 20 years of evolution, including the transition from 3NF to Dimensional and the introduction of versioning, have led to architectural chaos. There were requirements from the business side: high speed of changes, completeness of history preservation, opportunities for self-service BI. In short, as usual - more, faster and cheaper.
I am sure that many of the main problems faced by my colleagues are familiar. This is the lack of suitable business keys in the source data, only surrogate, and the low quality of the source data, and integrity violations in the sources. Also, a lot of effort had to be spent on automating the construction of Dimensional - DV-based showcases - and developing templates for ETL procedures for loading large amounts of data. Perhaps the key feature of the project was the emphasis on automating model changes and ETL, resulting in:
In addition, it has been rightly argued that Data Vault is useful in controlling data quality, as it allows you to store “facts” rather than “truth.”
The report was interesting and informative. In a personal conversation after the presentation, they agreed with Gabor that Data Vault should not be taken as a dogma, but adapted to the needs of a particular project.
Summarizing the content of the conference, I note:
There were not enough presentations of real projects that talked about ways to solve real, rather than hypothetical, problems that project teams face when using beautiful and well-organized [on paper] methodologies, about adapting such approaches to the harsh prose of life.
If we talk about the general impression, the main effect is motivating. Motivating to read more about the approaches presented. Motivating to engage in this rather demanded business. Perhaps DWH analysts with experience of up to three years would be primarily interested in the presentations themselves, and their senior fellow architects would have found more pleasure in communicating with colleagues on the sidelines. Personally, I managed to meet several colleagues from Europe, America, and, oddly enough, Russia. Lucky to chat with some gurus. By the way, Hans Haltgren said in a personal conversation that the two Russian guys with whom he works in the Valley are simply “amazing”. And left an autograph on his, perhaps, the most popular book about Data Vault.

Introduction
Data Modeling Zone is a franchise that brings together conferences on the construction of a logical database architecture. The past few years have been held in the USA and Europe, and this year will be held for the first time in Australia. In 2017, two forums were organized under the DMZ brand, both were held in the fall: October 16–18 - in Hartford, USA, and October 23–25 - in German Düsseldorf. I happened to take part in the role of a listener in the last of them. This article provides a brief overview of the presentations that I saw at the conference, and my impressions of it in general.
The name of the conference makes it clear that the key issue is the different aspects of building a data model. Most of the topics announced were related to data warehouses, but they were also relevant for any information system. My expectations were contradictory: on the one hand, the speakers included recognized community leaders, and on the other, an abundance of hourly presentations that did not provide for in-depth consideration of issues.
The main program was presented by five tracks:
- Foundational Data Modeling
- Agile and requirements
- Big data and architecture
- Hands-On and Case Studies
- Advanced data modeling
1st day
registration
Together with the badge, the participants were given a set of stickers. With their help, the badge holder could indicate the languages he speaks and select one or more professional roles. The idea is original and entertaining, but useless.
Send Bitemporal data from Ground to Vault to the Stars
The first day began with a three-hour lecture on various aspects of versioned data storage. Building historicity is a topic around which there have been many lively debates within our team. Therefore, I could not pass by the keywords merging timelines, Data Vault Satellites, historization in the announcement of the speech.
Speaker - Dirk Lerner, one of the Data Vault missionaries in Germany, founder of TEDAMOH (The Data Modeling Hub), author of a good professional blog .
The presentation began with an overview of recording formats for time intervals. We examined 4 formats that differed in the way they recorded the beginning and end of the interval: open or closed. In the first example, a sequence of two intervals was selected: T1 = 2016, T2 = 2017. From the explanations, I realized that the open format for recording the boundary of an interval (open) implies an exception of the border, and closed (closed) means inclusion. Like the way numerical intervals are written in algebra.
| Format | T1 | T1 |
|---|---|---|
| Closed / closed | Jan16 - Dec16 | Jan17 - Dec17 |
| Closed / open | Jan16 - Jan17 | Jan17 - Jan18 |
| Open / closed | Dec15 - Dec16 | Dec16 - Dec17 |
| Open / open | Dec15 - Jan17 | Dec16 - Jan18 |
But the following example baffled me. It had one interval - the period of the conference. The first point of the problem (closed / closed) did not cause any difficulties. But a discussion arose over the other three, during which the definitions of all formats were finally clarified.
The bottom line is that the period boundary in the open format is denoted by the first determined value from the adjacent period. That is, the “open” end of the period is designated as the first measure of the next period, and the beginning is designated as the last measure of the previous one. The periods from the first example had “neighbors” on the fact of their belonging to the Gregorian calendar. The second example was more specific and local, so it was impossible to determine the boundaries of the proposed interval through the "open" format.
In conclusion, they talked about the preference of the close / open format, since it is it that allows us not to depend on the clock cycle of the monitoring system. Indeed, if you build a continuous history of changes in the state of the object, then the end of the current period occurs at the moment of the change of state, that is, with the beginning of the next period. To calculate the end of a closing interval when using the close / close format, it is necessary to subtract 1 clock clock from the time when a new state is fixed. Whereas the use of the close / open format allows the state change time to be indicated both as the beginning of a new period and as the end of the old one. And it doesn’t matter in what units the time is measured - the close / open format is independent of the clock cycle size of the storage. This is one of the reasons why it is most popular and included in the ISO 9075: 2011 standard.
The next topic was the classification of intersections of time intervals. Dirk has clearly demonstrated how not to get confused in issues that seem obvious. In essence - nothing new, but the systematic consideration of the issue makes a good impression.
But all this was a warm-up before the main topic of the presentation, namely, saving data in the context of two chronologies: business and technical. The unusual word bitemporal in the topic title is just about that. Dirk began with a fairly simple abstract example, in which we have an array of data with a key, a pair of business attributes, the start date of the record's relevance from a business point of view, and the date the data was loaded into staging.
Stagingtable
| Somebk | Attr_1 | Attr_2 | ValidFrom | STGLoadDTS |
|---|---|---|---|---|
| % 662HK! ..? | 10 | 10 | 2014-12-01 | 2015-01-01 |
| % 662HK! ..? | eleven | 10 | 2015-01-03 | 2015-02-10 |
| % 662HK! ..? | eleven | 100 | 2015-03-30 | 2015-02-23 |
Satellite
| H_ID | Attr_1 | Attr_2 | Tech_from | Tech_to | Bsns_from | Bsns_to |
|---|---|---|---|---|---|---|
| 1 | 10 | 10 | 2015-01-01 | 2015-02-10 | 2014-12-01 | 2999-12-31 |
| 1 | 10 | 10 | 2015-02-10 | 2999-12-31 | 2014-12-01 | 2015-01-03 |
| 1 | eleven | 10 | 2015-02-10 | 2015-02-23 | 2015-01-03 | 2999-12-31 |
| 1 | eleven | 10 | 2015-02-23 | 2999-12-31 | 2015-01-03 | 2015-03-30 |
| 1 | eleven | 100 | 2015-02-23 | 2999-12-31 | 2015-03-30 | 2999-12-31 |
The idea is to keep a history of changes in history. Consider processing the first two records from staging. There are no problems with the first record - at the time of its loading, there is no talk of processing changes. A record is added to the satellite that a given key has an attribute vector (10.10) - “for centuries”. The second record from staging contains an update on one of the attributes, as a result of which the vector has taken the value (11,10). To handle this event, you need to do three things:
- To save the information that in the period from the moment of obtaining data on the first value (10.10) to the receipt of data on the second (11.10), we thought that the value (10.10) is “for centuries”. To do this, we update the first record by closing the interval of "technical" relevance to it, leaving the "business" open.
- Since the receipt of data (11.10), we know that the value (10.10) was relevant only in a certain period of time, and this knowledge is no longer subject to revision. To save this information, we inserted a second record from (10.10) with an open interval of "technical" relevance, but with a closed "business".
- To preserve our current view that the value (11.10) is valid now and will remain so for the indefinite future, a third record is inserted with this very value of the attribute vector and open intervals of both “technical” and “business” relevance (on the slide in this The “technical” interval is closed because the satellite contains the results of processing subsequent updates).
The following example was decided by the students on their own. It was about the student timetable.
A curious visualization was used to demonstrate the solution. Double historicity was presented in the form of a coordinate plane. On the abscissa axis is business time, on the ordinate axis is technical time. Each record corresponds to one of the areas of the plane. The cutting goes diagonally - to the right and up.
The final example was the most difficult. Initial data - a plan of price changes in relation to the day of the Black Friday marketing campaign.
Staging table
| Product | Price | Daystart | Dayend | STG Load DTS |
|---|---|---|---|---|
| Jeans | 100 | D1 | Bf | D1 |
| Jeans | 80 | Bf | Bf + w | D1 |
| Jeans | 110 | Bf + w | 9999 | D1 |
| Jeans | 95 | D1 | Bf | D10 |
| Jeans | 82 | Bf | Bf + 2w | D10 |
The difficulty was that the plan was revised not only in terms of changing the price itself, but also in terms of breaking down the time continuum of the decision. I note that the key to the successful completion of the task was the understanding that for any moment of "technical" time in the repository there should be data that completely covers the entire "business" chronology. Not without effort, the problem was solved "on a piece of paper", but the question of automation of this not the most trivial algorithm remained open.
The next point of the program was a description of how to merge information from two satellites with double historicity into one dimension. To demonstrate, they chose an example with a student with a specific class schedule. He has a history of graduate change. The essence of the proposed method: cross join with the collapse of consecutive intervals.
The last considered aspect of this topic was variability in the interpretation of information received at the output. There is a fact that a student has passed the exam. Information on the student’s timetable and academic degree for this fact can be determined in three different ways:
- What do we know now about the schedule and the degree relevant for today.
- What do we know now about the schedule and degree relevant at the time of passing the exam.
- What we knew at the time of the exam was about the schedule and degree that was relevant at the time of the exam.
Perhaps this presentation was the most informative and informative for me personally. After it was followed by a block of performances in the genre of key notes.
Official opening
The organizers made a set of on-duty phrases, from which the mention of the gender distribution among the participants was remembered: 165 men to 17 women. Then the “rock star” of data modeling came on the scene, the author of numerous books on the topic - Steve Hoberman. Steve said that today the most popular IT issues in this area are nosql databases and the cultivation of new modelers. He dwelled on the second in more detail, saying that the growth in the volume of metadata significantly exceeds the growth in the number of modelers. In this regard, he identified the 5 most popular skills in the coming years:
- Communication
- Modeling
- Data Management in the Agile Paradigm
- Knowledge of various types of DBMS
- Business process knowledge
Data, a Managerial Perspective
The next speaker was the data architect of the Central Bank of the Netherlands - Ronald Damkhov. Ronald told how he and his colleagues managed to build a repository on the principle of "multireality". It was a methodology that:
- provides for both the completeness of reflection of sources and an adequate presentation of the business context;
- allows you to take advantage of a flexible approach to development along with a clear regulation of change processes.
The idea is to present the entire storage in the form of a quadrant constructed in the coordinate system “flexibility-systematization” + “sources-business” and divided into 4 sectors:
It was emphasized that the division of data into “master data”, “big data” "," Metadata "and others are inefficient.
In the resulting coordinate system, there was an order for solving each of the 7 main tasks for designing a CD:
- Building
- Automation
- Systematization
- Control
- User Access
- Ensuring manufacturability
- Modeling
To solve the construction issue, for example, they proposed options (green - ok, red - not ok):
The Blockchain Billionaire
After Ronald, Steve Hoberman again took the floor. He told how the main determining factor in the development of IT in the next decade - blockchain technology - affects data modeling issues. Since Steve is the guru of modeling everything and everyone, the blockchain was immediately given a definition in the form of a logical data model.
According to Steve, the influence of the blockchain will be felt most strongly in matters of data management, data standardization and design of the architecture of data storage systems. Blockchain is unlikely to touch the development vector of relational DBMSs. But how it affects the Agile methodology is not yet clear.
It is curious that, as an example of the spread of this technology, Steve talked about the Ukrainian project, within the framework of which it is proposed to switch to the use of cryptocurrency for calculating state property sales transactions. This should help in the fight against corruption.
Introducing the DAMA DMBOK2 certification
Everyone was invited to practice the delivery of the most famous in the field of data management certification DAMA DMBOK2. The training version of the exam included 20 questions. For instance:
- Who is the “provider" in the context of the data management process?
- What activities are included in the data development process?
- What support actions are basic for building a reliable data storage system?
- Who is most interested in a high-quality data management process?
Etc.
Curious theory. Enough abstract, but at the same time consistent and logical.
Wherescape test drive
Initially, a demonstration of a system that provides a range of services for building a storage architecture was planned in a workshop format. But there were much fewer laptops, so the format was changed to presentation.
As a preamble, a series of statements of the class “Volga flows into the Caspian Sea” were declared. For example, that the main thing is to listen to the business, and automation is part of the process, not a technical solution. For example, a failed project was presented with a customer represented by a Russian company, whose representatives “believed that buying a system, they buy a magic wand”. After the presentation, I went over to inquire in more detail about this project. But all I heard is a request not to take these words as blasphemy of the Russian people - "this mistake is common to everyone." At the end of the introductory part, Power Designer was thoroughly criticized - old, ugly, complex, it makes no sense to keep the version.
The system itself during the demonstration looked really impressive. In fact, we saw only part of the capabilities, but it was stated that WhereScape Red provides a complete set of metadata and ETL management capabilities. As a confirmation, a diagram was presented on which the standard elements of the storage architecture, covered by the functionality of the system, were marked red:
We started with the fact that the models of source systems are described, their changes are tracked. The modeling process itself consists in constructing a logical model of custom storefronts and determining the mapping of their fields with sources. After that, by pressing the magic button, the process of automatically building the staging and data vault layer model in accordance with predefined rules is started. The last step was to generate an ETL code and define a schedule. On the examples of the tutorial class, everything worked, of course, elegantly and elegantly. Among the features, I would single out the line by column. Verification and validation of changes have not yet been made, but they should appear in the next release. You can read more about the system features on the vendor page .
How to sell Data Vault to non-technical people
The first day ended with an amateur humorous show. Scenes from two adult men, whose keynote was self-irony about the hype around Data Vault, got bored after the first 15 minutes, although the whole performance lasted more than an hour. Looking at the number of screens of phones burning in the dark, it was hard not to feel sympathy for the speaking uncles.
2nd day
Developing Corporate Model Using Patterns
The three-hour Australian seminar by John Gills was essentially a summary of his 2012 book, The Nimble Elephant. The topic is useful and does not lose its relevance. It is about using industrial patterns in model design. Currently, large vendors (for example, IBM and TeraData) offer off-the-shelf top-level model templates for different subject areas - “Industry Reference Model”. The most common classification of entities for many templates is the same. The concept John talked about is no exception. It provides for the use of types:
- Member and role
- Product
- Resource
- The task
- Score
- Agreement
- Document
- Event
- Location
At the seminar, the participants needed to build a data model describing this business process to describe the production activities of the enterprise. It was proposed to do this with:
- creating subtypes of different levels of nesting in relation to the listed source types;
- determining the relationships between them.
In addition, John presented an accurate schedule for constructing a data model using this approach:
- 1 week: familiarization, draft conceptual model.
- 2-4 weeks: workshops on problem areas, iterative development of the conceptual model through refinement, creation of extensions of the main entities.
- Week 5: Business prioritizes, IT begins development.
- 6-8 weeks: building a prototype, starting the agile development process.
The resulting conceptual model can be used not only to build a logical model of CD, but also as a single formalized business model of the enterprise, in accordance with which it is necessary to create logical models of these operating business systems.
Advanced Data Modeling Challenges
The second seminar I was able to attend was conducted by Steve Hoberman. Steve is known not only for his books and the patented “Data Model Scorecard”. He is also popular as a teacher at seminars and related courses. In general, he confirmed his reputation: he spoke in an accessible, interesting and humorous way. True, the name of the seminar did not correspond to reality: it was about important and useful, but still basic principles of model building.
First, he talked about the concept of super-entities and their extensions, which intersected with the contents of the previous seminar. After that there was an assignment: it was necessary to study a small set of data presented in a flat denormalized display case and describing the assortment of a bookstore, and build a 3NF model. According to Steve, completing this task, we should have felt like archaeologists of data.
The next task was more entertaining. The source data was the schedule of commuter trains in one of the directions in the vicinity of New York.
The task was to design a data model on the basis of which you can build analytics on the quality of the work of electric trains, namely, how accurately the schedule is implemented. The target model was to preserve data on both the timetable and the actual train schedule. The models presented by the three teams did not differ much in the set of entities, except for the differences in the names. What we commonly call a “branch” or “line” in different models was called: line, journey, route, trip, and “stage” - link or leg. From this, one of the obvious, but extremely important rules of modeling was deduced - the need to give a clear, most comprehensive definition to the entities represented in the model. The fundamental difference between the models was the method of storing actual data on the movement of trains: in some models, the granularity of these data was determined as the fact of the arrival of a train from the initial station to the given one. An alternative approach was to keep the train moving between two neighboring stations. In comparing the two methods, we came to the conclusion that it is important to remember when building a model which process we want to measure with its help.
In addition, paradigms for constructing logical models differed: one team chose Multi-Dimensional, the rest 3NF. Based on this, we formulated the thesis about the priority of creating a high-quality conceptual model, which can be easily converted to Multi-Dimensional, 3NF, Data Vault, and so on.
Designing the Dream - Why Enterprises Need Architects
An extensive philosophical presentation on the role of architects in the modern world. The key idea is best expressed by the quote from architect Norman Foster:
" As an architect you design for the present,
with an awareness of the past,
for a future which is essentially unknown ."
Of the greats, Aristotle was still quoted with his words that architecture rests on three pillars: durability, beauty and functionality.
It was something about everything and about an hour span in keynote format. Among other things, it is worth highlighting an extremely important observation: the architect of the building differs from the architect of the industrial system in that it is not built into the object of his creation.
Business Milestones and Data Models - an Introduction to Entity Life Histories
Not the most exciting presentation on how to properly save the history of an entity change. Key thoughts:
- You need to keep the story as detailed as possible, without any analysis.
- It is important to separate the state of the entity and the new entity (candidate - employee, order - order).
- Not all entity statuses are equally useful for analytics - you need to collapse.
To demonstrate these good and important thoughts, a primitive example was chosen with the wildebeest life cycle model:
To consolidate the information received, we were offered to build a data model that automates the process of clearing bank checks. Either the task was formulated too abstractly, or the participants got tired by the end of the second day, but in the end there were no ready-made solutions.
Migrating an Enterprise DW from “traditional” to Data Vault based
The author is Gabor Golnhofer, an architect with 20 years of experience working on CD projects in finance, insurance, telecom, retail and education. The presented project was to transfer the storage of an indefinitely mixed architecture to Data Vault. The name of the customer company was not called, they only said that it is the market leader in its field in Hungary and is part of an international holding. According to the “tactical and technical characteristics”, their storage is comparable to our Tinkoff DWH:
- 40+ source systems.
- Milestones: 1998 - beginning, 2008 - SAS → Oracle, 2016 - Data Vault.
- 22 TB, 5,000 target tables, 9,000 ETL jobs.
From a technical point of view, the main prerequisite for rebuilding the repository was the high cost of the refinement process and performance problems. In addition, 20 years of evolution, including the transition from 3NF to Dimensional and the introduction of versioning, have led to architectural chaos. There were requirements from the business side: high speed of changes, completeness of history preservation, opportunities for self-service BI. In short, as usual - more, faster and cheaper.
I am sure that many of the main problems faced by my colleagues are familiar. This is the lack of suitable business keys in the source data, only surrogate, and the low quality of the source data, and integrity violations in the sources. Also, a lot of effort had to be spent on automating the construction of Dimensional - DV-based showcases - and developing templates for ETL procedures for loading large amounts of data. Perhaps the key feature of the project was the emphasis on automating model changes and ETL, resulting in:
- The rate of change has increased significantly
- the number of bugs decreased
- the quality and completeness of the documentation have improved,
- the ratio of developers and analysts in the team has changed in favor of the latter.
In addition, it has been rightly argued that Data Vault is useful in controlling data quality, as it allows you to store “facts” rather than “truth.”
The report was interesting and informative. In a personal conversation after the presentation, they agreed with Gabor that Data Vault should not be taken as a dogma, but adapted to the needs of a particular project.
Total
Summarizing the content of the conference, I note:
- Using Data Vault (Anchor Modeling - as an option) - the gold standard DWH.
- Today's trend is automation [of creating metadata, generating ETL, QA code].
- The trend of tomorrow is storage in the cloud.
- Good business knowledge is a prerequisite for building a good model.
There were not enough presentations of real projects that talked about ways to solve real, rather than hypothetical, problems that project teams face when using beautiful and well-organized [on paper] methodologies, about adapting such approaches to the harsh prose of life.
If we talk about the general impression, the main effect is motivating. Motivating to read more about the approaches presented. Motivating to engage in this rather demanded business. Perhaps DWH analysts with experience of up to three years would be primarily interested in the presentations themselves, and their senior fellow architects would have found more pleasure in communicating with colleagues on the sidelines. Personally, I managed to meet several colleagues from Europe, America, and, oddly enough, Russia. Lucky to chat with some gurus. By the way, Hans Haltgren said in a personal conversation that the two Russian guys with whom he works in the Valley are simply “amazing”. And left an autograph on his, perhaps, the most popular book about Data Vault.