Analysis of Cisco CDR and Microsoft Exchange Server Logs Using Splunk

Today, email and phone calls are the main means of communication in a business environment. Each message or call can potentially bring revenue to the company, and one employee can write several hundred messages per day or make about a hundred calls. In this article we will tell how using Splunk you can analyze the logs of Microsoft Exchange Server and Cisco Call Manager, as well as how this can be useful.
Do I need to analyze communications data?
Definitely needed! Analysis of mail and telephony may allow:
- Monitor external and internal messages and calls, analyze the interaction of employees and departments with contractors;
- To identify the relationship of internal units and conduct a comparative analysis of the nature of their activities;
- Analyze the effectiveness of employees: the structure and intensity of communications, the percentage of under-dialing, which can help affect the increase in sales and income of the company;
- Monitor messages to personal mail to prevent information leakage;
- To control the cost of calls by employees, departments and the whole company;
- Track the process of work on a specific topic: call forwarding, response speed, etc.
Implementation
In this article, we will not talk about how to upload data to Splunk, or how to parse logs. If it will be interesting to you, then you can write to us . Now we show the most interesting visualization of analytics and a couple of sample queries for the logs of Cisco and Ms Exchange.
Analytics of mail correspondence in the context of the whole organization

On this dashboard you can see analytics by correspondence with counterparties in time, how many people interact with the counterparty and the organization, whether there is an important counterparty's dependence on one employee.
Analysis of correspondence by department.
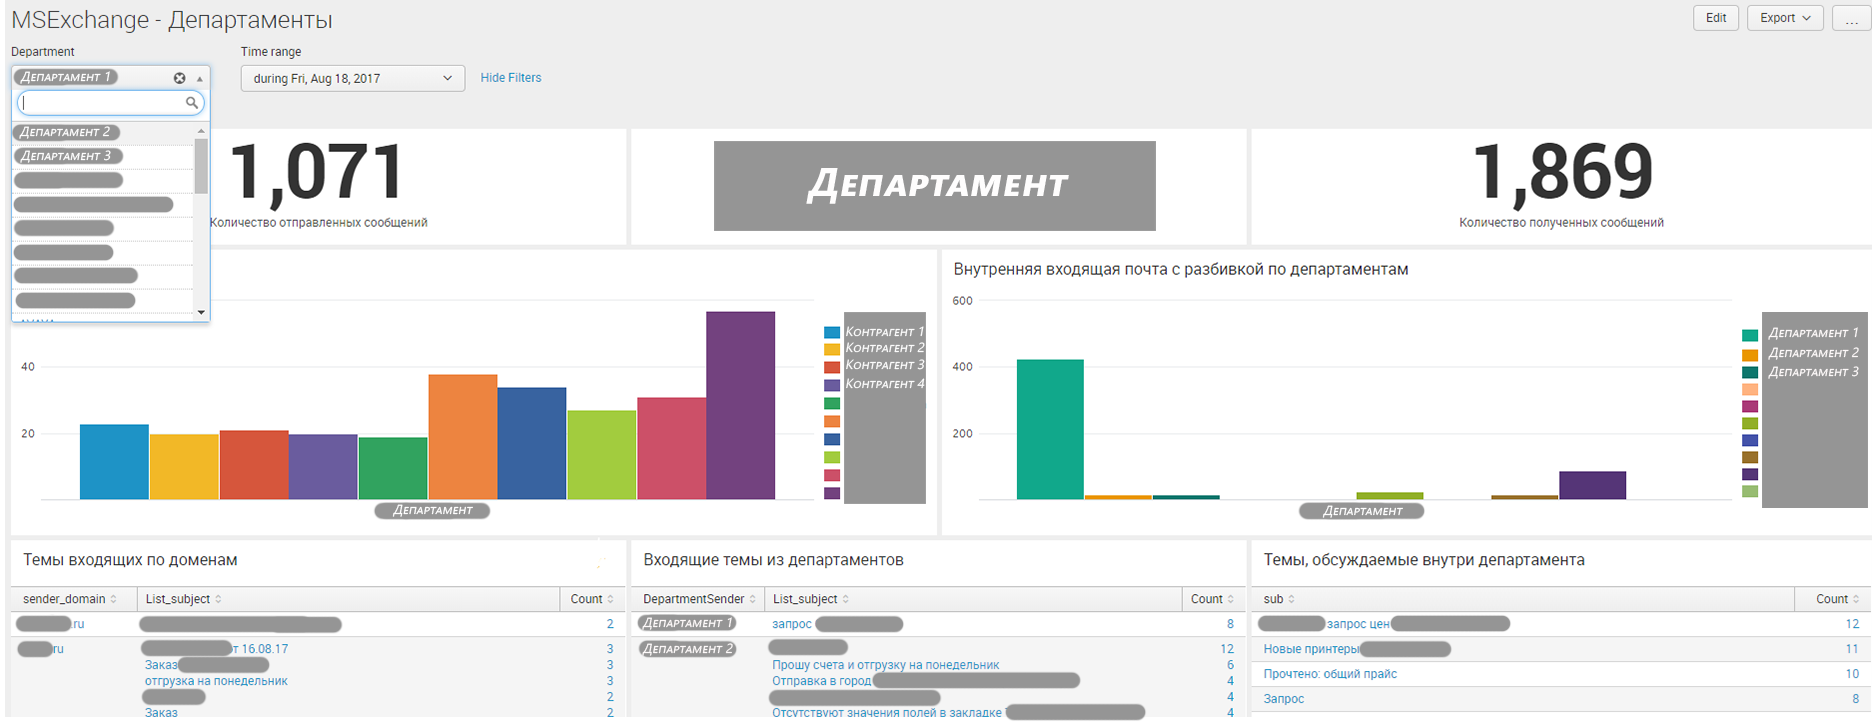
On this dashboard you can find out who the employees from this department interact with and how: how often communication is carried out, on which topics, etc.
Comparison of Departments

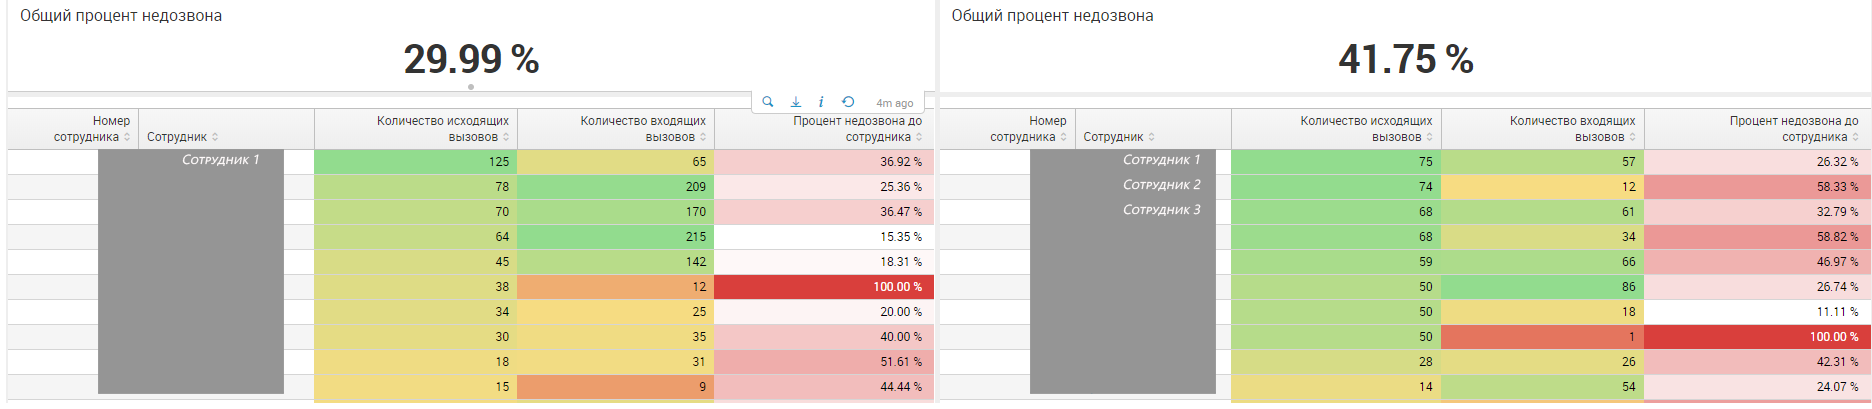

These figures show fragments of a dashboard where you can compare the intensity of calls and messages for departments, the difficulty of dialing, the quantitative characteristics of each employee, the distribution of messages by contractors and other indicators.
Comparison of employees
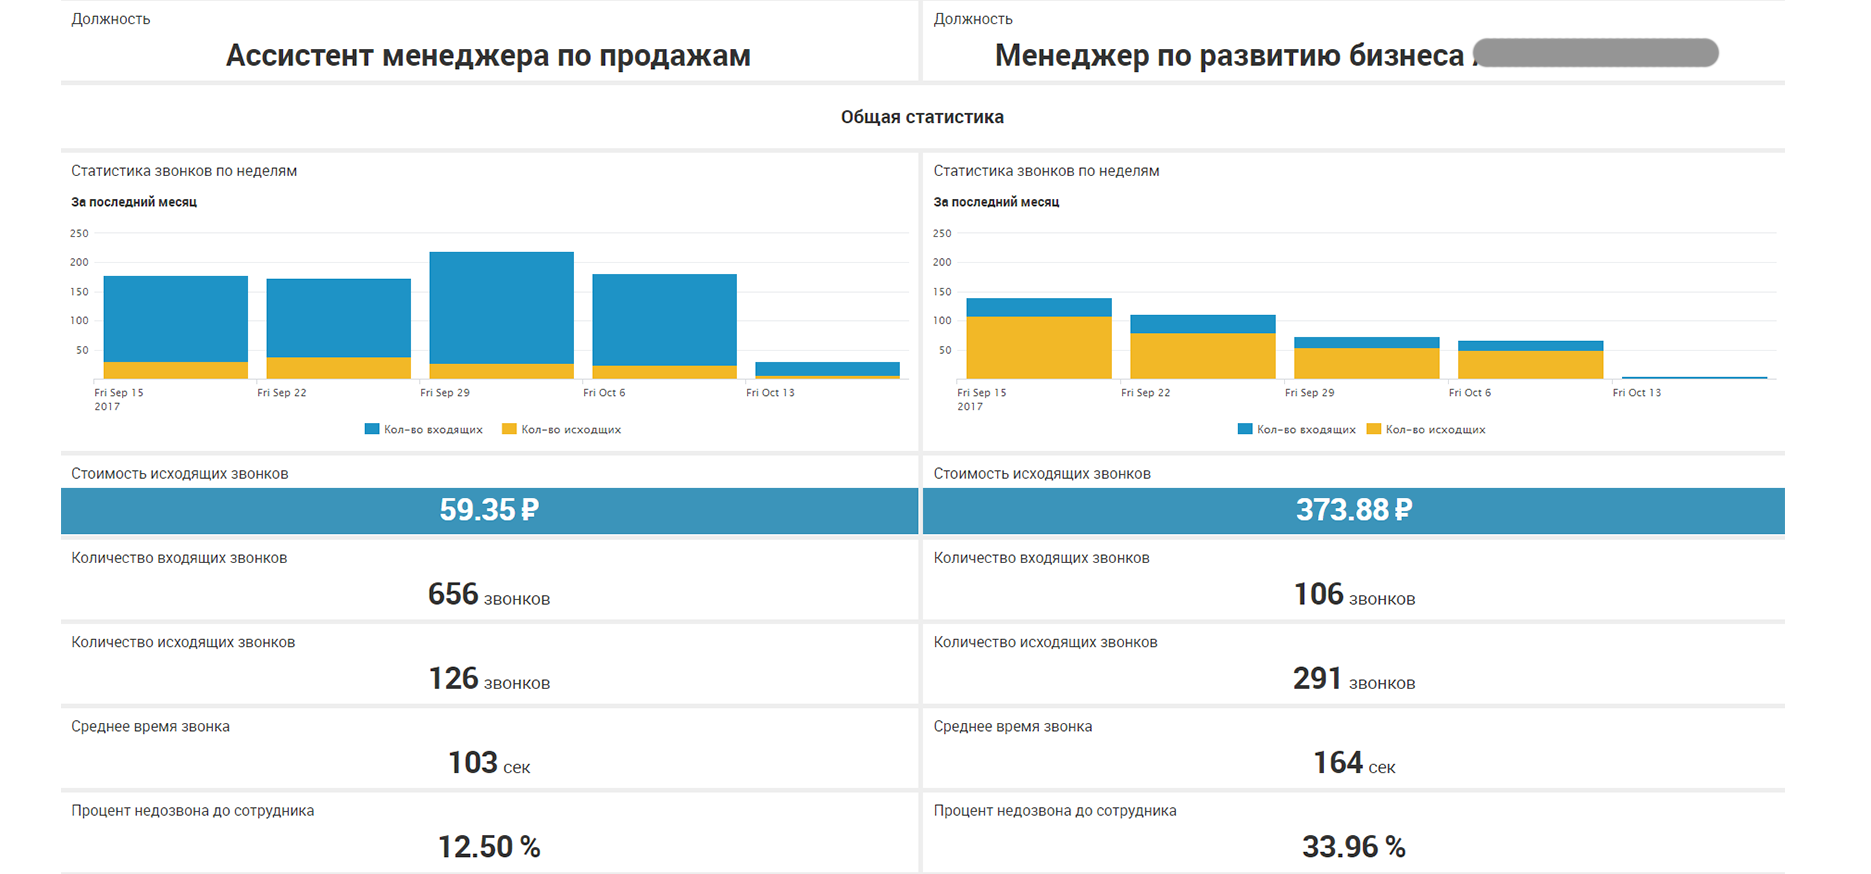
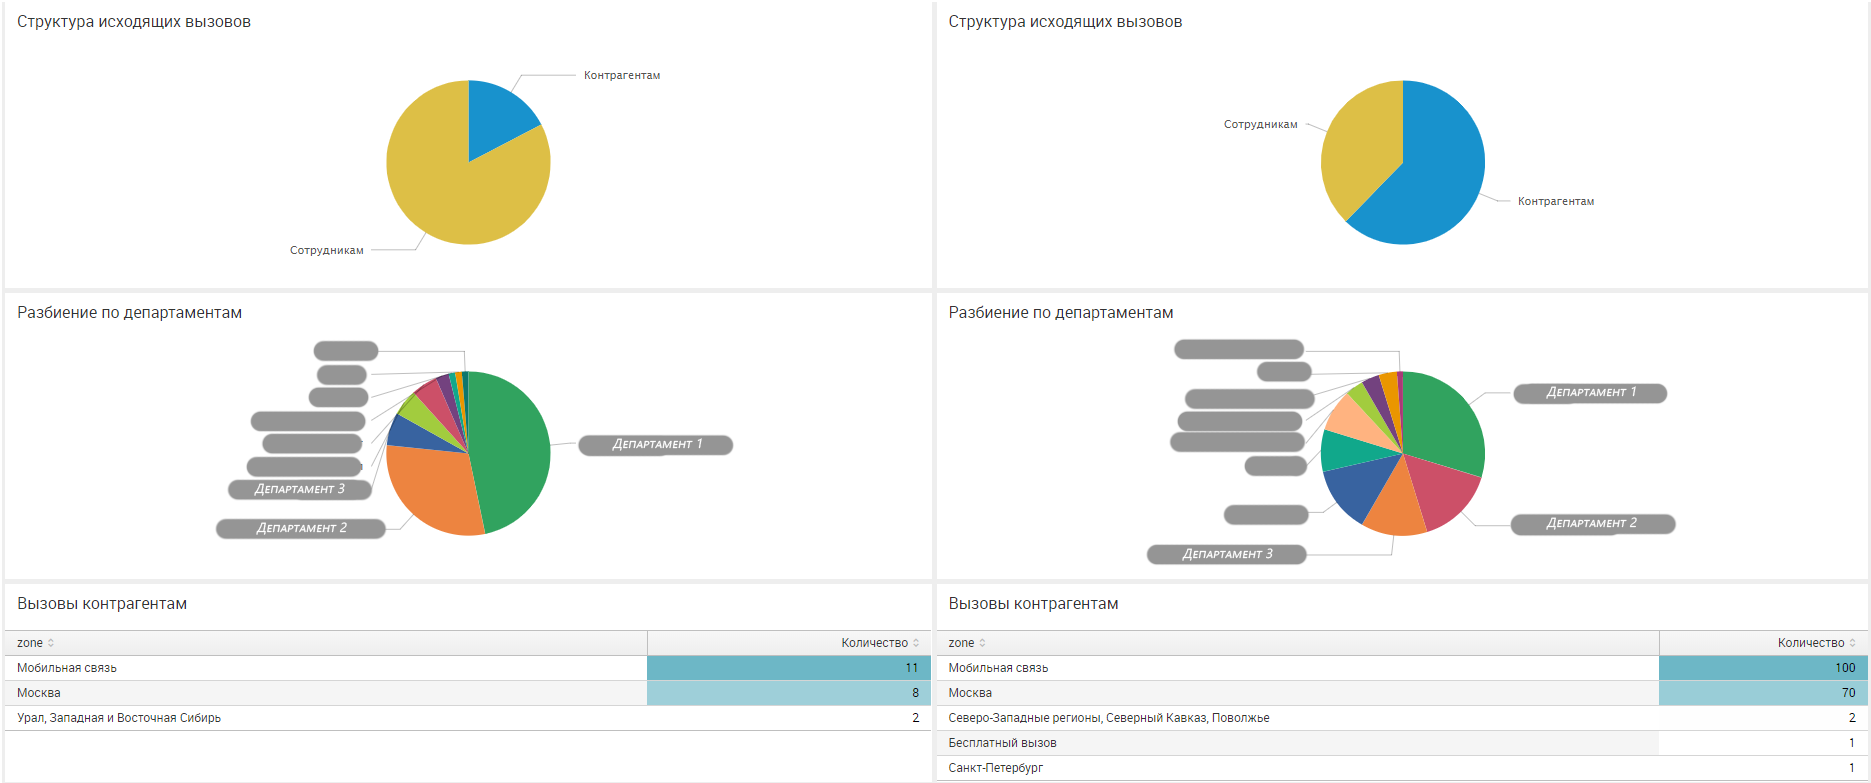

On this dashboard, the user will see which of the employees has more incoming, and who has outgoing, how much their calls cost for the organization, who communicates more with colleagues, and who with contractors, who find it harder to get through.
Correspondence on the topic
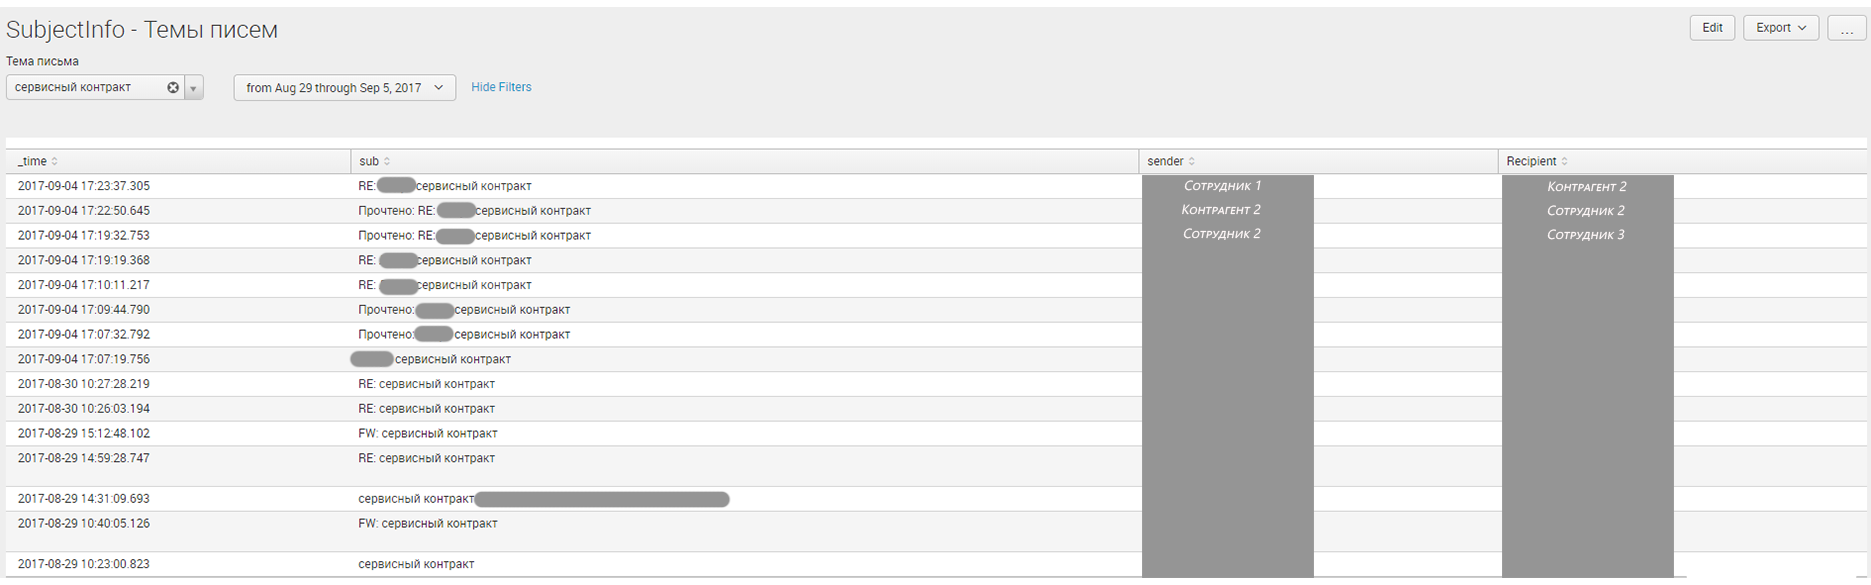
This dashboard reflects information about working on a specific topic, you can see who is chatting on this topic, its forwarding and speed of response.
Some more interesting statistics
Statistics who correspond during off hours.

Description of outgoing calls, to determine how many calls are made via mobile communications in Russia or abroad.

Of course, to get the whole variety of analysts, only the logs of the mail server and telephony are not enough, so a reference system was added to the solution to enrich the information.
Inquiries
Consider a few queries that were used for the diagrams shown above.
MS Exchange
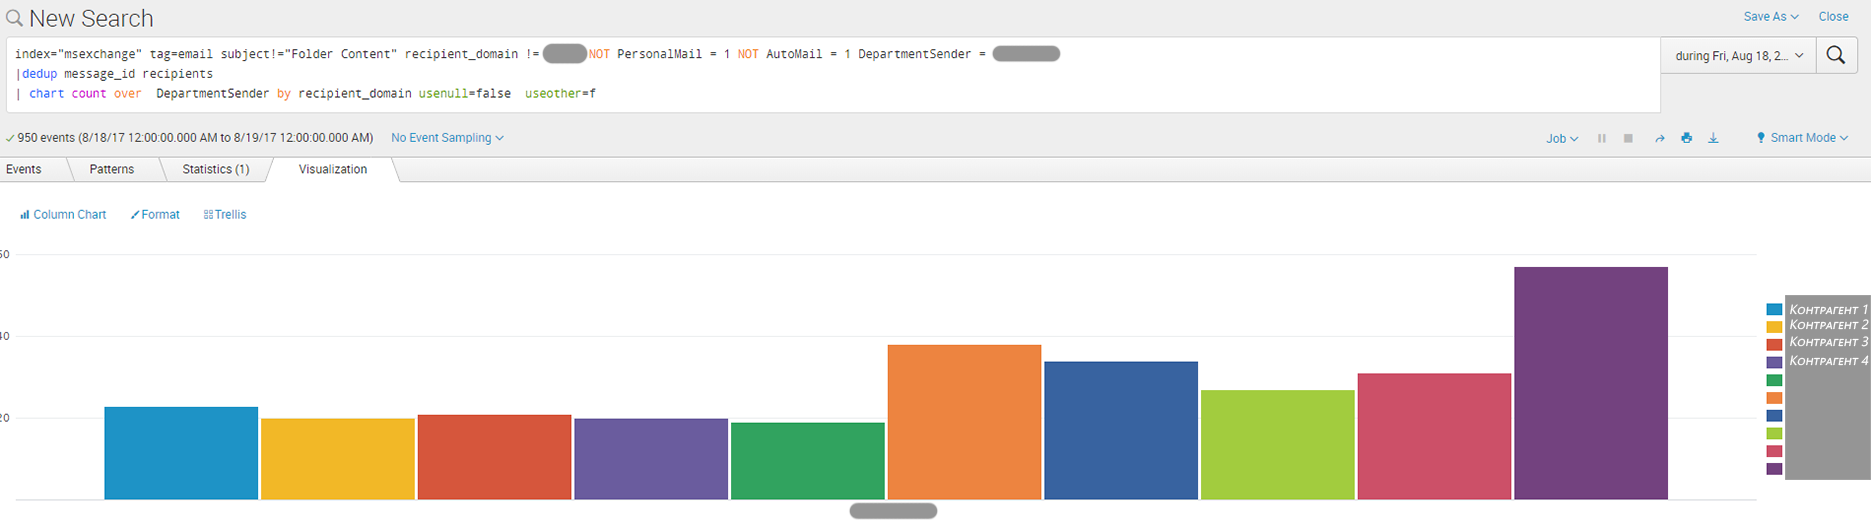
index="msexchange" tag=email subject!="Folder Content" recipient_domain != *xxxxxx* NOT PersonalMail = 1 NOT AutoMail = 1 DepartmentSender = "X"

|dedup message_id recipients

| chart count over DepartmentSender by recipient_domain usenull=false useother=f
Cisco CDR
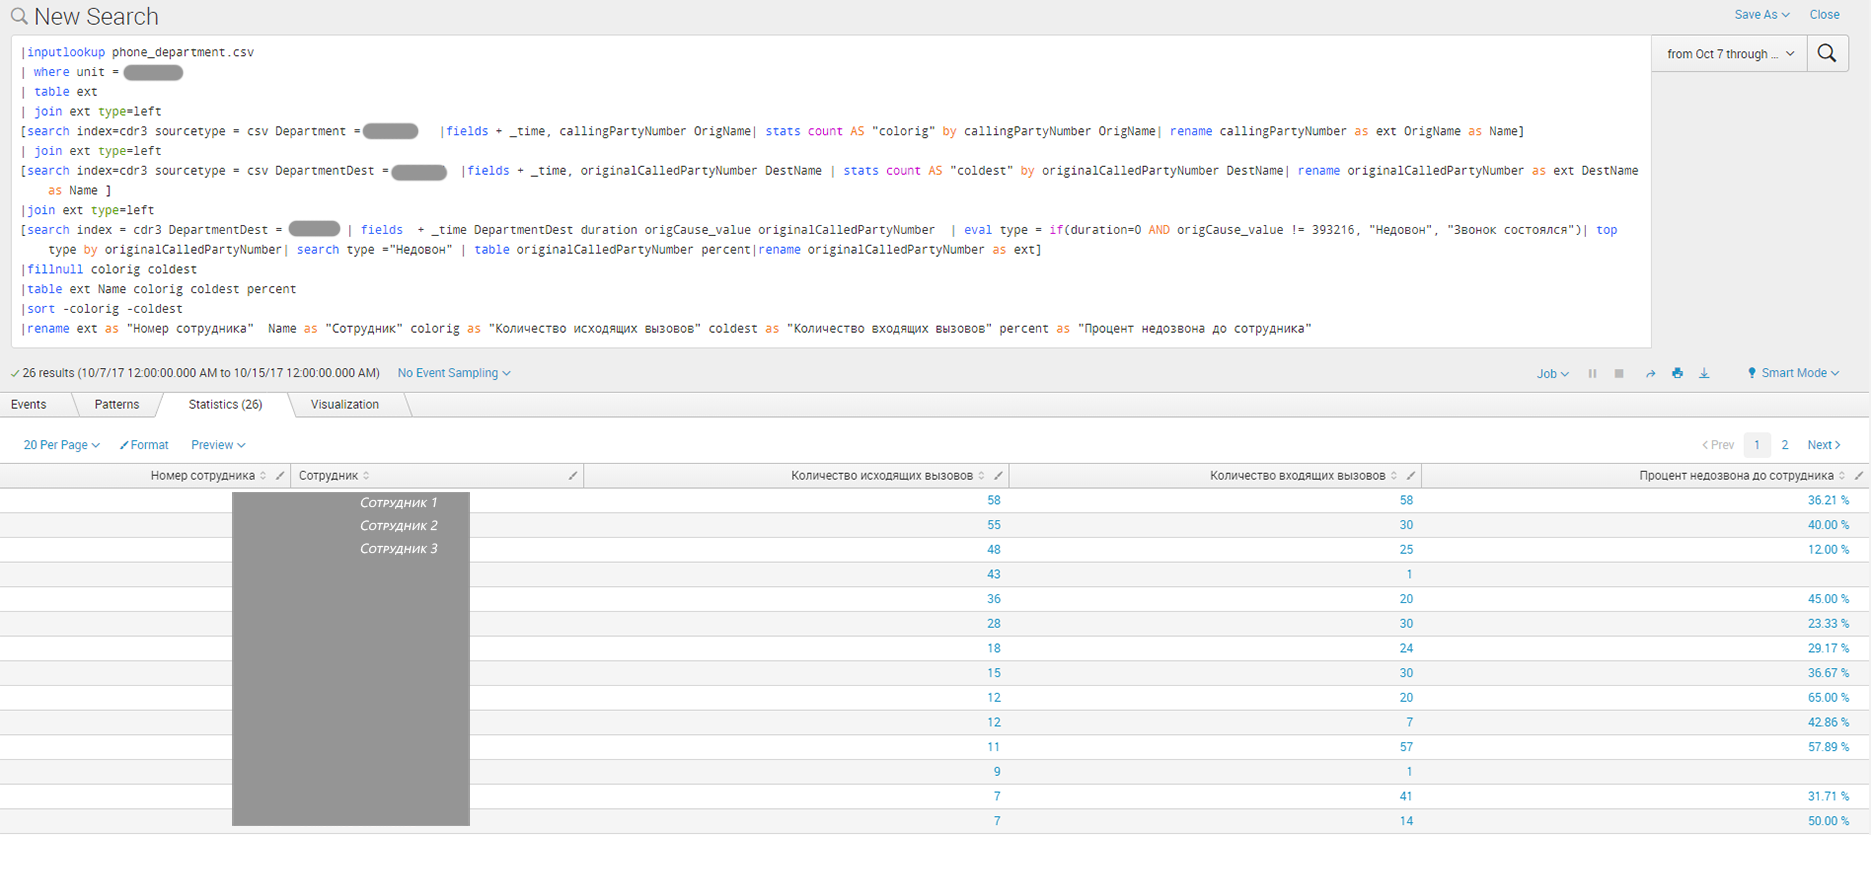
|inputlookup phone_department.csv

| where unit = "X"

| table ext

| join ext type=left

[search index=cdr3 sourcetype = csv Department = "X" |fields + _time, callingPartyNumber OrigName| stats count AS "colorig" by callingPartyNumber OrigName| rename callingPartyNumber as ext OrigName as Name]

| join ext type=left

[search index=cdr3 sourcetype = csv DepartmentDest = "X" |fields + _time, originalCalledPartyNumber DestName | stats count AS "coldest" by originalCalledPartyNumber DestName| rename originalCalledPartyNumber as ext DestName as Name ]

|join ext type=left

[search index = cdr3 DepartmentDest = "X" | fields + _time DepartmentDest duration origCause_value originalCalledPartyNumber | eval type = if(duration=0 AND origCause_value != 393216, "Недовон", "Звонок состоялся")| top type by originalCalledPartyNumber| search type ="Недовон" | table originalCalledPartyNumber percent|rename originalCalledPartyNumber as ext]

|fillnull colorig coldest

|table ext Name colorig coldest percent

|sort -colorig -coldest

|rename ext as "Номер сотрудника" Name as "Сотрудник" colorig as "Количество исходящих вызовов" coldest as "Количество входящих вызовов" percent as "Процент недозвона до сотрудника"
Conclusion
In this article, we showed how Splunk can be used to analyze MSExhange and CiscoCM data. The solution can be deepened and expanded depending on the needs of the customer.
We are happy to answer all your questions and comments on this topic. Also, if you are interested in something specifically in this area, or in the field of machine data analysis in general, we are ready to modify the existing solutions for you, for your specific task. To do this, you can write about it in the comments or simply send us a request through the form on our website .