November 27, 2017 at 14:05
Solving memory misuse issues in Node.js
- Transfer
Recently, the company Reside Real Estate ran into problems: at the most crucial moments, the Node.js server began to fall. Suspicion fell into memory. Employees of the company resorted to temporary measures, which eliminated the inconvenience of users, and began to search for the source of problems. As a result, they were able to find and fix the problems.

In this article, they talk about how to look for and fix memory usage errors. Namely, we will talk about memory leaks, and situations where programs use much more memory than they actually need. This story will help those who come across something similar to immediately understand the reason for the strange behavior of the server and quickly return it to service.
In computer science, a memory leak is a type of uncontrolled use of resources that occurs when a program incorrectly manages memory allocation, as a result of which memory that is no longer needed is not freed.
In low-level languages like C memory leaks often occur in situations where memory is allocated like this:
In languages with automatic memory release control, leaks occur when entities that are no longer needed can be accessed from an executable program, or from some root object. In the case of JavaScript, any object that can be accessed from the program is not destroyed by the garbage collector, respectively, the space it occupies on the heap is not freed. If the heap size grows too much, a shortage of memory will occur.
In a situation of excessive use of memory, the program takes up much more memory than it needs to solve the task assigned to it. For example, this can occur when links to large objects are stored for longer than necessary for the program to work correctly, which prevents garbage collection of these objects. This happens when large objects are stored in the memory that the program simply does not need (this causes one of the two main problems that we will discuss below).
Our memory problems showed themselves in a very obvious way, mainly in the form of this grim message from a magazine:
Signs of a memory leak also include a decrease in program performance over time. If the server periodically executes the same process, which is initially fast, and before the failure gradually becomes slower, this most likely indicates a memory leak.
Signs of excessive memory usage typically translate into poor program performance. However, overuse of memory without leakage over time does not lead to performance degradation.
Often, when something happens, there is no time to understand the essence of the problem and fix it. We definitely didn’t have it. Fortunately, there are ways to increase the amount of memory allocated to the Node process. The V8 engine has a standard memory limit of approximately 1.5 GB on 64-bit computers. Even if you run the Node process on a computer with much more RAM, this does not matter unless you increase this limit. In order to increase the limit, you can pass the key to the Node process
The parameter
We also used the Twilio service, set it up so that we would be notified every time a request arrives on the server that requires especially a lot of memory. This allowed us to monitor the request and restart the server after it was completed. Such a solution is not ideal, but in order to prevent our users from encountering failures, we were ready for anything, even for round-the-clock duty without days off.
So, thanks to the Node settings and the organization of server monitoring, we won the time that could be spent on reaching the root cause of the problem. At first glance, it might seem that the “server memory problem” is something terrible, and fantastic tools and skills will be required to get rid of this “problem”. However, in fact, everything is not so scary. There are quite accessible tools for researching applications, there are many materials in which you can find tips. We, for research of memory of the Node server, we will use tools of the developer of Chrome.
A memory leak is a problem that translates into an ever-increasing heap size. As a result, the heap is too large to continue the normal operation of the server. Therefore, at the very beginning of the study, you need to take a few snapshots (snapshots) of the heap, with a certain interval, and dive into the study of these snapshots using the Chrome developer tools in order to understand why the heap is so large and why it grows. Pay attention to the fact that several snapshots should be done, after a while, as a result, it will be possible to study objects that will switch from one snapshot to another. These objects are quite possibly the culprits of a memory leak. There are many ways to create a heap snapshot.
We used heapdump to create heap snapshots . This npm package turned out to be very useful. You can import it into the code and access it in those places of the program where you need to make snapshots. For example, we did a snapshot every time the server received a request that could cause a process that was heavily using memory. Immediately we formed a file name containing the current time. Thus, we could reproduce the problem by sending more and more new requests to the server. Here's what it looks like in the code:
If you are working with Node 6.3. or with a later version, you can use the remote Chrome debugger to create heap snapshots. To do this, first start Node with a command of this kind:
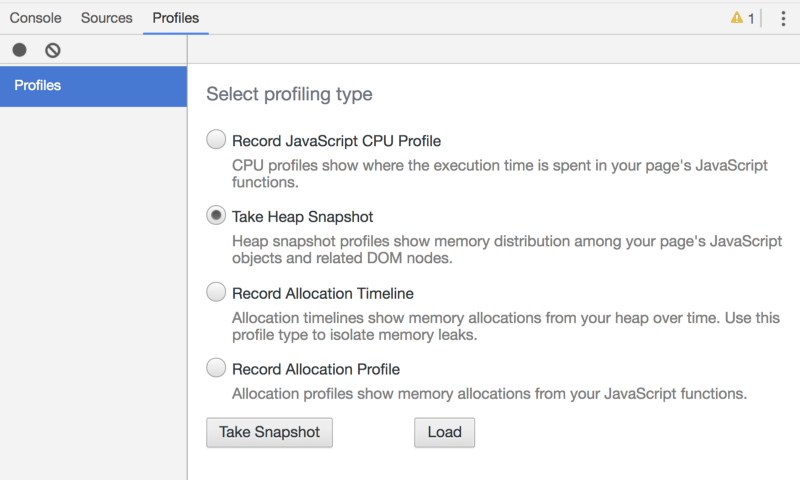
Chrome Remote Debugging Tools and Heap Snapshots
The next step is to download snapshots on the Memory tab of the Chrome Developer Tools. If you used the remote Chrome debugger to create heap snapshots, they will already be loaded. If you used heapdump, then you will need to download them yourself. Be sure to download them in the correct order, namely in the one in which they were made.
The most important thing that you need to pay attention to at this stage of work is to understand - what exactly are you faced with - a leak or with excessive use of memory. If you have a memory leak, then you probably have already received enough data to start exploring the heap in search of the source of the problem. However, if you have excessive memory usage, you need to try some other analysis methods in order to get meaningful data.
Our first memory issue looked on the Memory tab of the Chrome Developer Tools, as shown below. It’s easy to see that the pile is constantly growing. This indicates a memory leak.
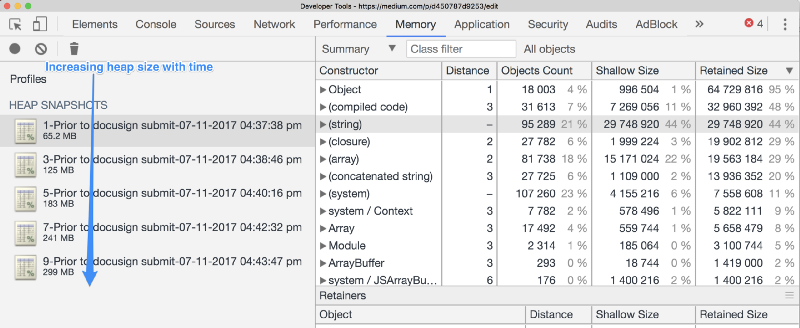
The heap increases over time - an obvious memory leak.
Our second memory problem, which a couple of months after fixing the leak, ended up looking at the same tests as shown in the figure below.
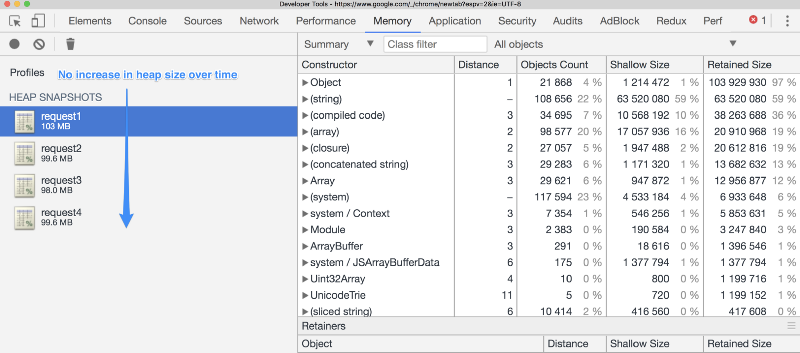
The heap does not grow over time - it is not a memory leak.
The heap size does not change over time. The thing is that with excessive use of memory, its size does not always exceed some expected indicators, but only when performing certain operations. At the same time, snapshots are made at some moments that are not tied to situations with excessive memory use. If at the time of the creation of the snapshot, an incorrectly written resource-intensive function was not executed, then the heap will not contain any valuable information about the memory used by this function.
To identify such problems, we recommend two methods that helped us identify the culprits of the problem - a function and a variable. This is a record of the memory allocation profile and the creation of snapshots on a server under serious load.
If you are using Node version 6.3 or later, you can record the memory allocation profile through the Chrome remote debugger by running Node with the key already mentioned
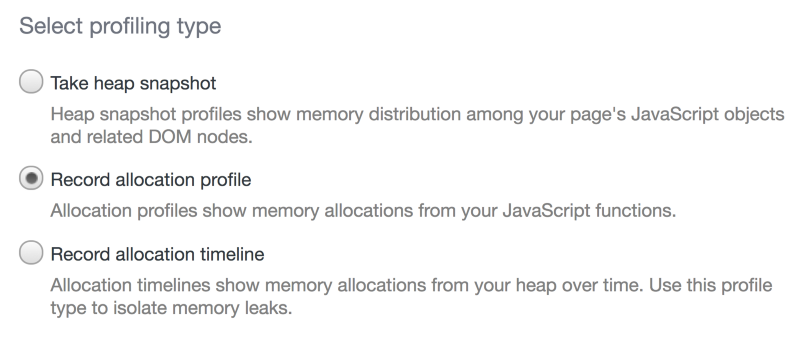
Writing a memory allocation profile
Another option is to send many simultaneous requests to your server and to create many snapshots during the processing of these requests (it is assumed that the server works asynchronously, as a result, some snapshots may be much larger than others, which will indicate a problem) . We bombarded the server with requests and made snapshots. Some of them turned out to be very large. You can study these snapshots to identify the source of the problem.
Now we have data that may very well help find the culprits of memory problems. In particular, we consider an analysis of a situation in which the sizes of sequentially made snapshots grow. Here is one of the snapshots that is loaded on the Memory tab of the Chrome Developer Tools.
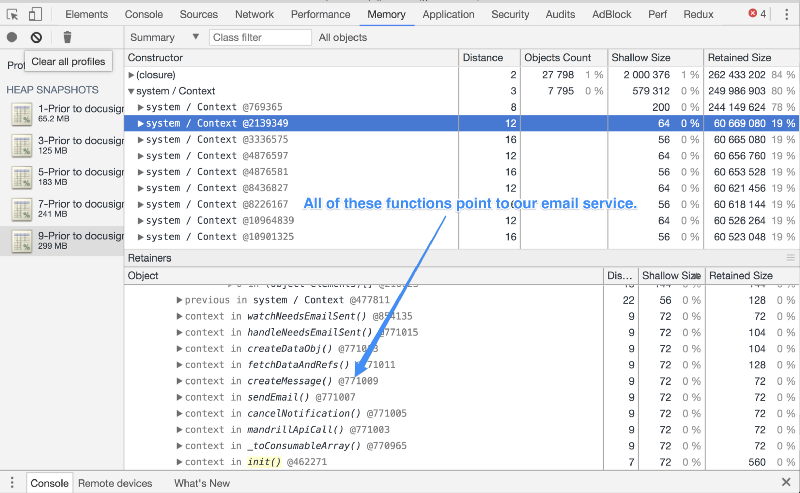
Memory leak investigation - all functions point to our email service
Retained Size is the size of memory freed up after an object is deleted along with its dependent objects that are unreachable from the root object.
Analysis can be started by sorting the list in descending order by the Retained Size parameter, and then proceed with the study of large objects. In our case, the function names pointed to the part of the code that caused the problem.
Since we were sure that we had a memory leak, we knew that the study should start by looking for variables with the wrong scope. We opened the
We sorted it all out, made the necessary changes, tested the project a few more times, and eventually fixed a memory leak.
The second problem was harder to debug, but the same approach worked. Below is the memory allocation profile that we recorded using the Chrome developer tools and the Node key

Finding the culprits of excessive memory usage
Just as when analyzing data while searching for a memory leak, many names of functions and objects cannot be recognized at first glance, since they are at a lower level than the code they write for Node.js. In a similar situation, having met an unfamiliar name, write it down.
The memory allocation profile led us to one of the functions
The two memory problems described above forced us to slow down the development of our project, which went very fast before that, and analyze the server performance. Now we understand the features of server performance at a much deeper level than before, and we know how much time is needed for the normal execution of individual functions, and how much memory they use. We have a much better understanding of what resources we need in further scaling up the project. And, most importantly, we no longer fear memory problems and no longer expect them to appear in the future.
Dear readers! Have you encountered memory issues in Node.js? If so, please tell us how you solved them.
In this article, they talk about how to look for and fix memory usage errors. Namely, we will talk about memory leaks, and situations where programs use much more memory than they actually need. This story will help those who come across something similar to immediately understand the reason for the strange behavior of the server and quickly return it to service.
Types of Memory Problems
▍ memory leak
In computer science, a memory leak is a type of uncontrolled use of resources that occurs when a program incorrectly manages memory allocation, as a result of which memory that is no longer needed is not freed.
In low-level languages like C memory leaks often occur in situations where memory is allocated like this:
buffer = malloc(num_items*sizeof(double));but do not release after the memory is no longer needed: free(buffer);.In languages with automatic memory release control, leaks occur when entities that are no longer needed can be accessed from an executable program, or from some root object. In the case of JavaScript, any object that can be accessed from the program is not destroyed by the garbage collector, respectively, the space it occupies on the heap is not freed. If the heap size grows too much, a shortage of memory will occur.
▍ Overuse of memory
In a situation of excessive use of memory, the program takes up much more memory than it needs to solve the task assigned to it. For example, this can occur when links to large objects are stored for longer than necessary for the program to work correctly, which prevents garbage collection of these objects. This happens when large objects are stored in the memory that the program simply does not need (this causes one of the two main problems that we will discuss below).
Identify memory problems
Our memory problems showed themselves in a very obvious way, mainly in the form of this grim message from a magazine:
FATAL ERROR: CALL_AND_RETRY_LAST Allocation failed - JavaScript heap out of memorySigns of a memory leak also include a decrease in program performance over time. If the server periodically executes the same process, which is initially fast, and before the failure gradually becomes slower, this most likely indicates a memory leak.
Signs of excessive memory usage typically translate into poor program performance. However, overuse of memory without leakage over time does not lead to performance degradation.
Workaround
Often, when something happens, there is no time to understand the essence of the problem and fix it. We definitely didn’t have it. Fortunately, there are ways to increase the amount of memory allocated to the Node process. The V8 engine has a standard memory limit of approximately 1.5 GB on 64-bit computers. Even if you run the Node process on a computer with much more RAM, this does not matter unless you increase this limit. In order to increase the limit, you can pass the key to the Node process
max_old_space_size. It looks like this:node --max_old_space_size=$SIZE server.jsThe parameter
$SIZEis specified in megabytes and, theoretically, can be any number that makes sense on a particular computer. In our case, parameter 8000 was used, which, taking into account the features of the server, allowed to win enough time for research. In addition, we have increased dynamic memory. We use Heroku, there it is done simply. We also used the Twilio service, set it up so that we would be notified every time a request arrives on the server that requires especially a lot of memory. This allowed us to monitor the request and restart the server after it was completed. Such a solution is not ideal, but in order to prevent our users from encountering failures, we were ready for anything, even for round-the-clock duty without days off.
Debugging
So, thanks to the Node settings and the organization of server monitoring, we won the time that could be spent on reaching the root cause of the problem. At first glance, it might seem that the “server memory problem” is something terrible, and fantastic tools and skills will be required to get rid of this “problem”. However, in fact, everything is not so scary. There are quite accessible tools for researching applications, there are many materials in which you can find tips. We, for research of memory of the Node server, we will use tools of the developer of Chrome.
▍ Snapshot heaps
A memory leak is a problem that translates into an ever-increasing heap size. As a result, the heap is too large to continue the normal operation of the server. Therefore, at the very beginning of the study, you need to take a few snapshots (snapshots) of the heap, with a certain interval, and dive into the study of these snapshots using the Chrome developer tools in order to understand why the heap is so large and why it grows. Pay attention to the fact that several snapshots should be done, after a while, as a result, it will be possible to study objects that will switch from one snapshot to another. These objects are quite possibly the culprits of a memory leak. There are many ways to create a heap snapshot.
▍ Using heapdump to create heap snapshots
We used heapdump to create heap snapshots . This npm package turned out to be very useful. You can import it into the code and access it in those places of the program where you need to make snapshots. For example, we did a snapshot every time the server received a request that could cause a process that was heavily using memory. Immediately we formed a file name containing the current time. Thus, we could reproduce the problem by sending more and more new requests to the server. Here's what it looks like in the code:
import heapdump from 'heapdump';
export const handleUserRequest = (req) => {
  heapdump.writeSnapshot(
    `1.User_Request_Received-${Date.now()}.heapsnapshot`,
    (err, filename) => {
      console.log('dump written to', filename);
  });
  return startMemoryIntensiveProcess(req);
};
▍ Using the Chrome Remote Debugger to create heap snapshots
If you are working with Node 6.3. or with a later version, you can use the remote Chrome debugger to create heap snapshots. To do this, first start Node with a command of this kind:
node --inspect server.js. Then go to the address chrome://inspect. Now you can remotely debug Node processes. To save time, you can install this Chrome plugin , which will automatically open the debugger tab when launching Node with a flag --inspect. After that, just do snapshots when you consider it necessary.Chrome Remote Debugging Tools and Heap Snapshots
Loading snapshots and determining the type of memory problem
The next step is to download snapshots on the Memory tab of the Chrome Developer Tools. If you used the remote Chrome debugger to create heap snapshots, they will already be loaded. If you used heapdump, then you will need to download them yourself. Be sure to download them in the correct order, namely in the one in which they were made.
The most important thing that you need to pay attention to at this stage of work is to understand - what exactly are you faced with - a leak or with excessive use of memory. If you have a memory leak, then you probably have already received enough data to start exploring the heap in search of the source of the problem. However, if you have excessive memory usage, you need to try some other analysis methods in order to get meaningful data.
Our first memory issue looked on the Memory tab of the Chrome Developer Tools, as shown below. It’s easy to see that the pile is constantly growing. This indicates a memory leak.
The heap increases over time - an obvious memory leak.
Our second memory problem, which a couple of months after fixing the leak, ended up looking at the same tests as shown in the figure below.
The heap does not grow over time - it is not a memory leak.
The heap size does not change over time. The thing is that with excessive use of memory, its size does not always exceed some expected indicators, but only when performing certain operations. At the same time, snapshots are made at some moments that are not tied to situations with excessive memory use. If at the time of the creation of the snapshot, an incorrectly written resource-intensive function was not executed, then the heap will not contain any valuable information about the memory used by this function.
To identify such problems, we recommend two methods that helped us identify the culprits of the problem - a function and a variable. This is a record of the memory allocation profile and the creation of snapshots on a server under serious load.
If you are using Node version 6.3 or later, you can record the memory allocation profile through the Chrome remote debugger by running Node with the key already mentioned
--inspect. This will provide information on how individual functions use memory over time.Writing a memory allocation profile
Another option is to send many simultaneous requests to your server and to create many snapshots during the processing of these requests (it is assumed that the server works asynchronously, as a result, some snapshots may be much larger than others, which will indicate a problem) . We bombarded the server with requests and made snapshots. Some of them turned out to be very large. You can study these snapshots to identify the source of the problem.
Snapshot Analysis
Now we have data that may very well help find the culprits of memory problems. In particular, we consider an analysis of a situation in which the sizes of sequentially made snapshots grow. Here is one of the snapshots that is loaded on the Memory tab of the Chrome Developer Tools.
Memory leak investigation - all functions point to our email service
Retained Size is the size of memory freed up after an object is deleted along with its dependent objects that are unreachable from the root object.
Analysis can be started by sorting the list in descending order by the Retained Size parameter, and then proceed with the study of large objects. In our case, the function names pointed to the part of the code that caused the problem.
Since we were sure that we had a memory leak, we knew that the study should start by looking for variables with the wrong scope. We opened the
index.jsmail service file and immediately found a module level variable at the top of the file.const timers = {};We sorted it all out, made the necessary changes, tested the project a few more times, and eventually fixed a memory leak.
The second problem was harder to debug, but the same approach worked. Below is the memory allocation profile that we recorded using the Chrome developer tools and the Node key
--inspect.Finding the culprits of excessive memory usage
Just as when analyzing data while searching for a memory leak, many names of functions and objects cannot be recognized at first glance, since they are at a lower level than the code they write for Node.js. In a similar situation, having met an unfamiliar name, write it down.
The memory allocation profile led us to one of the functions
recordFromSnapshot, it became a good starting point. Our study of the heap snapshot, which was not particularly different from the study performed when searching for a memory leak, revealed a very large object target. It was a variable declared inside a function.recordFromSnapshot. This variable remained from the old version of the application, it was no longer needed. Having got rid of it, we corrected the situation with excessive use of memory and accelerated the execution of the process, which used to take 40 seconds, to about 10 seconds. This process did not require additional memory.Summary
The two memory problems described above forced us to slow down the development of our project, which went very fast before that, and analyze the server performance. Now we understand the features of server performance at a much deeper level than before, and we know how much time is needed for the normal execution of individual functions, and how much memory they use. We have a much better understanding of what resources we need in further scaling up the project. And, most importantly, we no longer fear memory problems and no longer expect them to appear in the future.
Dear readers! Have you encountered memory issues in Node.js? If so, please tell us how you solved them.