Graylog2 Step-by-Step Setup
- Tutorial

In the first article of this series, I talked about how and why we chose the open source Graylog2 for centralized collection and viewing of logs in the company. This time I will share how we deployed the greylog in production, and what problems we encountered.
Let me remind you that the cluster will be hosted on the hosting site, logs will be collected from all over the world via TCP, and the average number of logs will be about 1.2 Tb / day under normal conditions.
We are currently using CentOS 7 and Graylog 2.2, so all configurations and options will be described exclusively for these versions (in Graylog 2.2 and Graylog 2.3, a number of options are different).
Placement planning
According to our estimates, we need 6 servers. Each server has 2 network interfaces; the first is 100MB to the world and a 1GB private network. On the external interface, it will listen to the web interface and HAproxy will listen to parts of the nodes, but more on that later. A private 1GB network is used to communicate everything else.
In total, we have 6 Hp DL380p Gen8 servers, 2x Intel Octa-Core Xeon E5-2650, 64 GB RAM, 12x4TB SATA. This is the standard host configuration. We divided the disks as follows: 1 disk for the system, mongu and graylog journal, the rest - in 0 raid and under the elastic storage. Since replication occurs at the level of the elastic itself, we do not need other raids very much.
Servers are distributed as follows:
- on the first 4: HAproxy, elasticsearch, graylog, mongod, keepalived, cerebro;
- on the remaining 2 only elasticsearch and graylog.
Schematically, it looks like this:
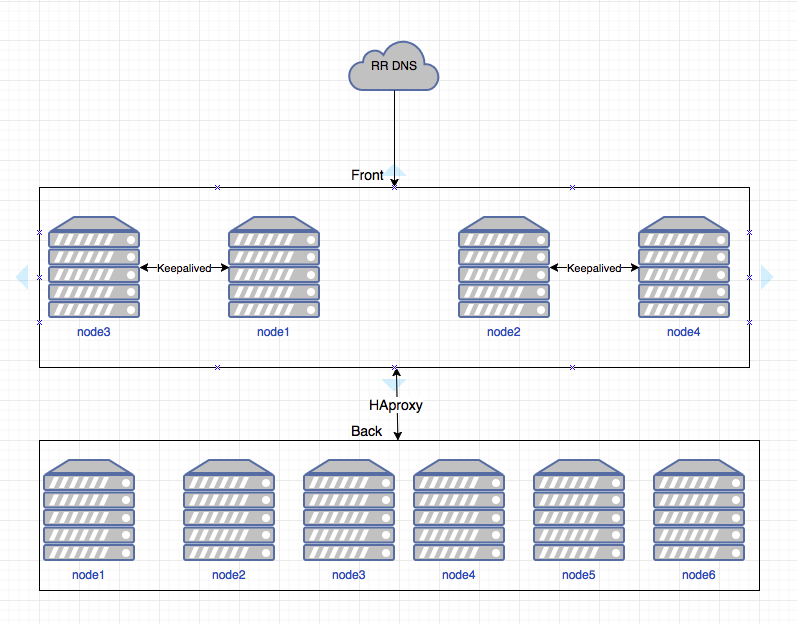
Settings:
- 2 addresses are specified in DNS, which are usually located on 1 and 2 nodes;
- HAproxy is configured between 1-3 and 2-4, so that in the event of a node failure, the address rises on another node;
- further, each node using HAproxy scatters traffic across all graylog nodes;
- greylog, in turn, also balances the processing of logs by nodes.
(We will not stop on setting HAproxy and keepalived, since this is beyond the scope of this article.)
Initial setup
The initial setup of Graylog2 is quite simple and banal, so I just highly recommend that everyone follow the official instructions:
- docs.graylog.org/en/2.2/pages/installation/operating_system_packages.html
- docs.graylog.org/en/2.2/pages/architecture.html#big-production-setup
- docs.graylog.org/en/2.2/pages/configuration/multinode_setup.html#configure-multinode
There is a lot of useful information that will further help in understanding the principles of configuration and tuning. During the initial setup, I never had any problems, so let's move on to the configuration files.
In server.conf graylog, at the first stage we specified:
# Specify our time zone
root_timezone = Europe/Moscow# Since there are not so many hosts, here we indicate all the elastic hosts
elasticsearch_discovery_zen_ping_unicast_hosts =
elasticsearch_discovery_zen_ping_multicast_enabled = false
# We allow you to start the search with a wildcard, because we all understand that this and what threatens
allow_leading_wildcard_searches = true# This relates more to tuning, but at the first stage we specified ring_size equal to half the processor’s L2 cache.
# And we specify the data for sending letters as a greylog (you need to insert your data into empty lines).
#Email transport
transport_email_enabled = true
transport_email_hostname = smtp.gmail.com
transport_email_port = 465
transport_email_use_auth = true
transport_email_use_tls = false
transport_email_use_ssl = true
transport_email_auth_username =
transport_email_auth_password =
transport_email_subject_prefix = [graylog]
transport_email_from_email =
transport_email_web_interface_url =
Next, you need to tune the elastic hipsize in the / etc / sysconfig / elasticsearch file (31 GB is recommended in the dock):
ES_HEAP_SIZE=31gAt the initial stage, we did not rule anything else and for some time did not even know any problems. Therefore, we proceed directly to the launch and configuration of the graylog itself.
Storage and assembly of logs, access rights
It's time to set up our graylog and start receiving data. The first thing we need is to decide how we will receive the logs. We settled on GELF TCP - it allows you to configure the collectors via the web interface (I will show a bit below).
We configure our first input. In the System / Inputs web interface in the upper left, select GELF TCP and then Launch new input:
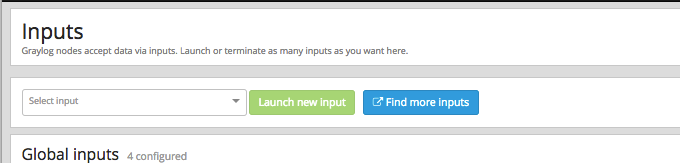
A window opens:
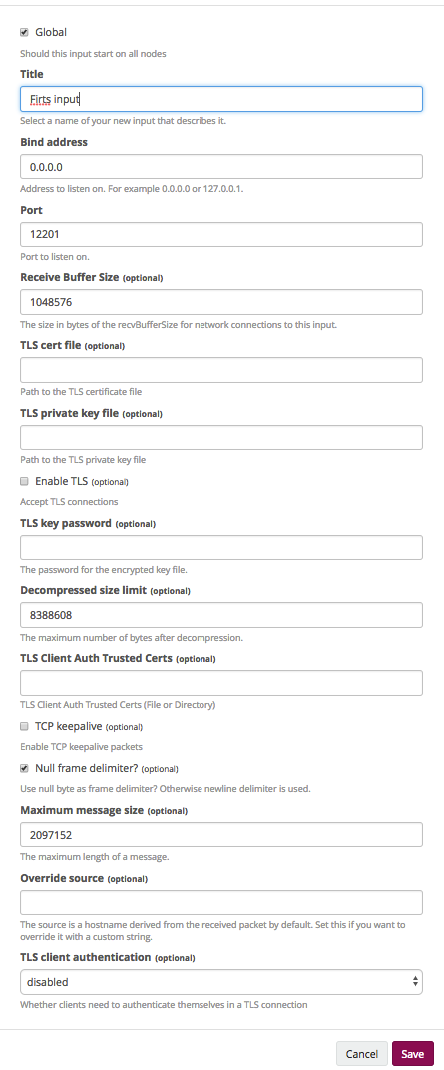
- Global It says that the input will be raised on all nodes.
- Title What will be called input.
- Bind address. What address our input will bind to (in our case it is 0.0.0.0, because all nodes have different addresses).
- Port Here you need to remember that we have HAproxy as a balancer in front of the inputs, respectively, here we enter the port to which the balancer will redirect.
- Receive Buffer Size, Decompressed size limit and Maximum message size. It is selected based on specific cases.
- Configure ssl as desired.
Now we have our first input, which will receive messages. Getting started setting up log storage. It is necessary to determine how many logs and how we will store them.
We divided everything into projects and logically related services within projects, and then divided by the number of logs that we need to store. Personally, we store part of the logs for 14 days, and part - 140.
Data is stored in graylog indices. Indexes in turn are divided into shards. Shards are primaries and replicas. By default, data is written to primary shards and replicated to a replica. We replicate only important indexes. Large indices we have 2 primaries shards and one replica, which guarantees the failure of 2 nodes without data loss.
Let's create an index that will have 2 shards and 1 replica and will store their logs for 14 days.
Go to System \ Indices, there click Create index set:
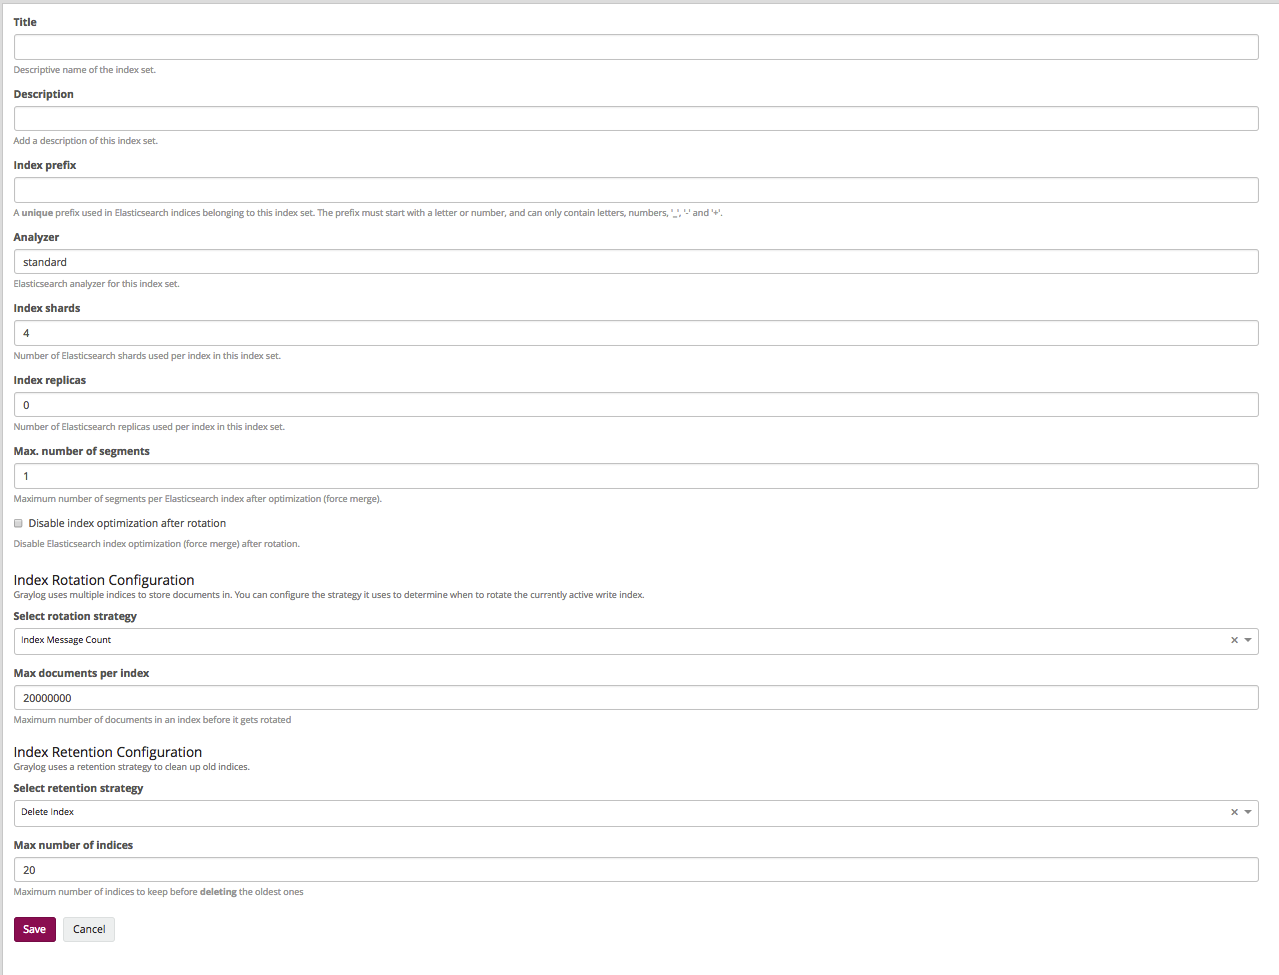
- Title and Description. Everything is clear here - the name and description.
- Index prefix. What prefix in elasticity will indexes have (usually somehow it reflects the name of the index itself in greylog).
- Analyzer We do not change.
- Index shards. The number of shards (we want to have 2 primary shards, so here we must put 2).
- Index replicas. The number of replicas of each shard is 1.
- Max number of segments. Usually we do not optimize shards, so we leave 1.
The following items are responsible for the number of logs stored and by the names it becomes clear that they can be stored by the number of messages, by time, and by the size of the index. We want to store 14 days.
- Select rotation strategy - Index Time.
- Rotation period (ISO8601 Duration). There is in the documentation, we leave P1D, which says: one index - one day.
- Select retention strategy - Delete index. We will delete the old indexes.
- Max number of indices. The maximum number of indices is set to 14, which in this case means that 14 indices will be stored for 1 day.
Now we need to make the so-called stream. Greylog provides rights at the level of these same streams. The bottom line is: in the stream indicate which index to write data to and under what conditions. This is in Sterams. Setup takes place in 2 stages.
1. Create a stream.
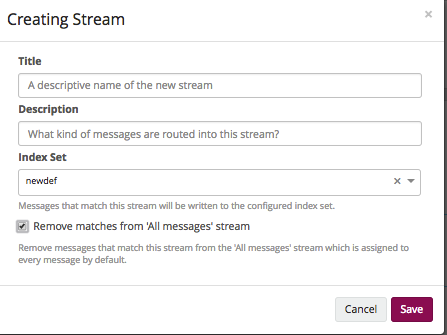
- Title and Description. As usual - name and description.
- Index set In which index to write data, here we select the one that we created earlier.
- Remove matches from 'All messages' stream. Delete messages from 'All messages'. To avoid confusion - delete.
2. Next Manage Rules.
Everything is simple there: we add the necessary rules by which the logs will get there.
Now we have an input that accepts logs; an index that saves them; and a stream that essentially collects a lot of logs into one space.
Next, we configure the sending of logs to the graylog itself.
Agent setup
The agent configuration path is described here . It all works as follows: the Graylog Collector Sidecar is installed on the client, which controls the backend of the log collector (in our case, for Linux and Windows this is nxlog).
We will prepare the system assembly rules for System \ Collectors \ Manage Configurations logs. We create the configuration and go to its configuration, immediately go to the NXLog tab. We see 3 fields: Output, Configure NXLog Inputs and Define NXLog Snippets. These are all pieces of the configs of this same NXLog, which will be the collector to climb to the final nodes. From here we will manage the fields and their values, as well as the files that we will monitor, etc.
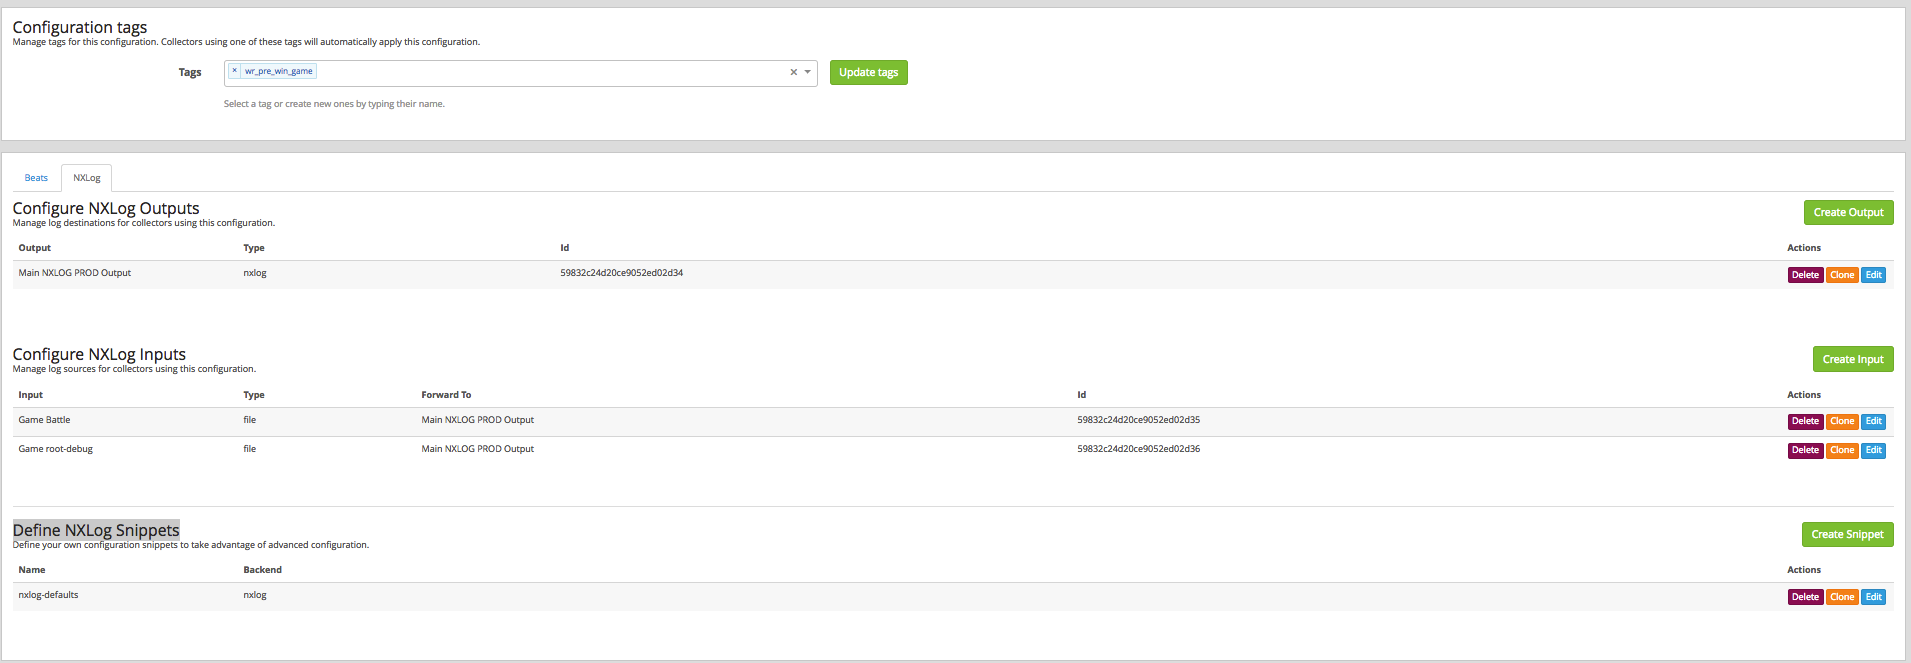
Let's start with the tags. We drive in tags on which the client will understand what configuration he needs to pick up.
Output field, there is one configuration:
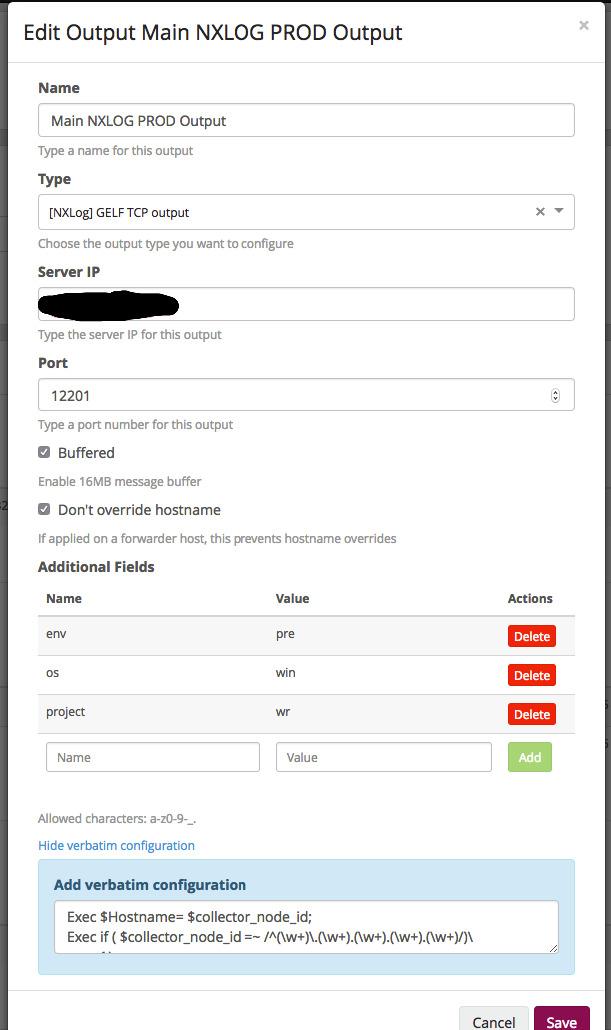
- Name Everything is clear here - the name by which we understand what it is.
- Type. In our case, it is TCP.
- Server IP Here we indicate the address where to send the logs (in our case, it is dns, the name of which is resolved into 2 addresses).
- Port As we recall, we use a balancer - at the input we specify the port of the balancer, which in turn will throw graylog nodes.
- Next, enable the buffer on the host.
- And do not rewrite the hostname.
- Additional Fields. Here we add additional fields that will be applied at the configuration level.
- Next is the field for manual configuration of the fields. You can read in detail on the NXLog website . In our case, as an example, just splitting the hostname into the required fields:
Exec $Hostname= $collector_node_id;
Exec if ( $collector_node_id =~ /^(\w+)\.(\w+).(\w+).(\w+).(\w+)/)\
         { \
               $name = $1;\
               $datacenter = $2; \
               $region = $3;\
               $platform = $5;\
         };
It was a general configuration setting, where to send and how to sign each log. Next, in the Configure NXLog Inputs field, we indicate which files to monitor.
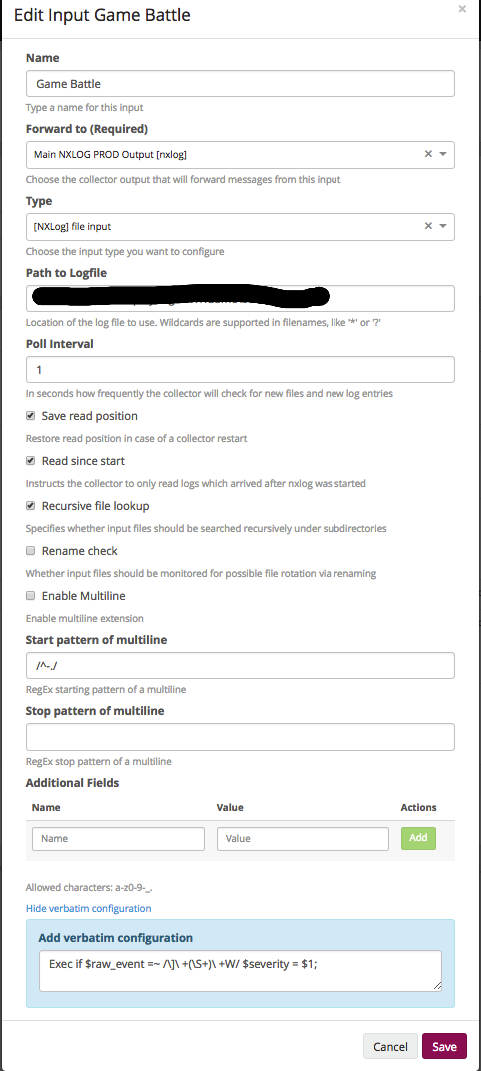
- Name - ...
- Forward to (Required). The above created output is here.
- Type. There are quite a few types that NXLog can do, in this case we will indicate a file, which means that we will take data from the file.
- Path to Logfile. The path to the file or files. Regexps are supported, you just need to remember that in the case of Windows, the file must have an extension and all the files in the directory look like this: “*. *”.
- Poll Interval. How often to check for changes in seconds.
- The following set of checkboxes describes the behavior of working with a file and depends on the specifics of your logs.
- And then again, custom fields and raw field. In this case, we select a field from the log and pass it as severity.
Define NXLog Snippets we usually do not touch.
On this, we assume that the default configuration is over, but you can add more files, fields, etc. to it.
Let's move on to installing the agent. In general, it is very well described by reference , so here we will not dwell on the manual rolling of agents, but immediately proceed to automation. We make it an ensemble.
In Linux conditions, there is nothing complicated, but there is a problem in Windows for automatic installation, so we just unzip the file and generate a unique UUID on the side of the ensemble. Roles for ansible:
On this setting can be considered complete and the first logs will already begin to appear in the system.
I would also like to talk about how we tuned the system to our needs, but since the article turned out to be quite voluminous, the continuation follows.