Jaeger Opentracing and Microservices in a real PHP and Golang project
Hello everyone, my name is Yuri Buylov, I lead the development at CarPrice. Briefly tell you how and why we came to microservices in PHP and Golang. What we use, how we instrument and monitor our applications in production. Next, I’ll talk about distributed trading, which provides us with transparency of the services.

Recently, microservices have been quite a trending topic and many want them even where it is not needed. This is a rather slippery path, stepping on which you need to understand what lies ahead. We did not come to microservices for the sake of trends, but out of necessity, with the realization of all the difficulties that we will encounter.
Initially, CarPrice was built as a monolithic application on Bitrix with the involvement of outsourced developers and focus on development speed. In a certain period, this played one of the important roles in the successful launch of the project on the market.
Over time, it became impossible to maintain the stable operation of the monolith - each release turned into a test for testers, developers and admins. Different processes interfered with the normal operation of each other. For example, a girl from the workflow could start generating documents for completed auctions and at that moment dealers could not bargain normally because of the brakes on the backend.
We started to change. Large parts of the business logic were carried out in separate services: logistics, the legal vehicle cleanliness check service, the image processing service, the service of recording dealers for inspection and issuance, billing, the service of accepting bids, the authentication service, the recommendation system, the API for our mobile and react applications.
At the moment, we have several dozen services on various technologies that communicate over the network.
These are mainly small applications on Laravel (php) that solve a specific business problem. Such services provide an HTTP API and may have an administrative Web UI (Vue.js)
. We try to arrange common components into libraries that composer delivers. In addition, services inherit a common php-fpm docker image. This relieves a headache when updating. For example, we have almost everywhere php7.1.
We write speed critical services on Golang.
For example, the jwt authentication service writes out and verifies tokens, and also knows how to log out an unscrupulous dealer whom the management for sins disconnects from the auction platform.
The betting service processes dealer bets, saves them to the database and deferredly sends events to rabbitmq and the RT-notification service.
For services on Golang we use go-kit and gin / chi.
The go-kit attracted with its abstractions, the ability to use various transports and wrappers for metrics, but it tires you a bit with a love of functionality and verbosity, so we use it in capital buildings with rich business logic.
On gin and chi, it’s convenient to build simple http services. This is ideal for quickly and with minimal effort to launch a small service in production. If we have complex entities, then we try to transfer the service to go-kit.
At the time of the monolith, newrelic was enough for us. Having jumped to the step of microservices, the number of servers increased and we abandoned it for financial reasons and rushed to the worst: Zabbix - for iron, ELK, Grafana and Prometheus - for APM.

First of all, we added nginx logs from all services in ELK, built graphs in Grafana, and for requests that spoiled us the 99th percentile we went to Kibana.
And here the quest began - to understand what was happening with the request.
In a monolithic application, everything was simple - if it was php, then there used to be xhprof, armed with which it was possible to understand what was happening there. With microservices where the request passes through several services and even on different technologies, this trick will not work. Somewhere a network, somewhere synchronous requests or a bad cache.
Let's say we found a slow request for our API. According to the code, it was established that the request turned to three services, collected and returned the result. Now we need to find subordinate requests based on indirect signs (timestamp, request parameters) to understand which of the services was the reason for the slow request. Even if we found that service, we need to go to the metrics or service logs and look for the reason there, and it often happens that the lower services work quickly, and the resulting request slows down. Vobschem is so-so pleasure.
And we realized that it was time - we needed distributed tracing.
Motivation:
Remembering Google's Dapper, we first came to Opentracing , the universal standard for distributed trading. It is supported by several tracers. The most famous are Zipkin (Java) and Appdash (Golang).
Recently, however, a new and promising Jaeger from Uber Technologies has appeared among old-timers who support the standard . We’ll talk about him.
Beckend - Go
UI - React
Storage - Cassandra / Elasticsearch
Initially developed under the OpenTracing standard.
Unlike the same Zipkin, the Jaeger model natively supports key-value logging and traces are presented as a directed acyclic graph (DAG) and not just a span tree.
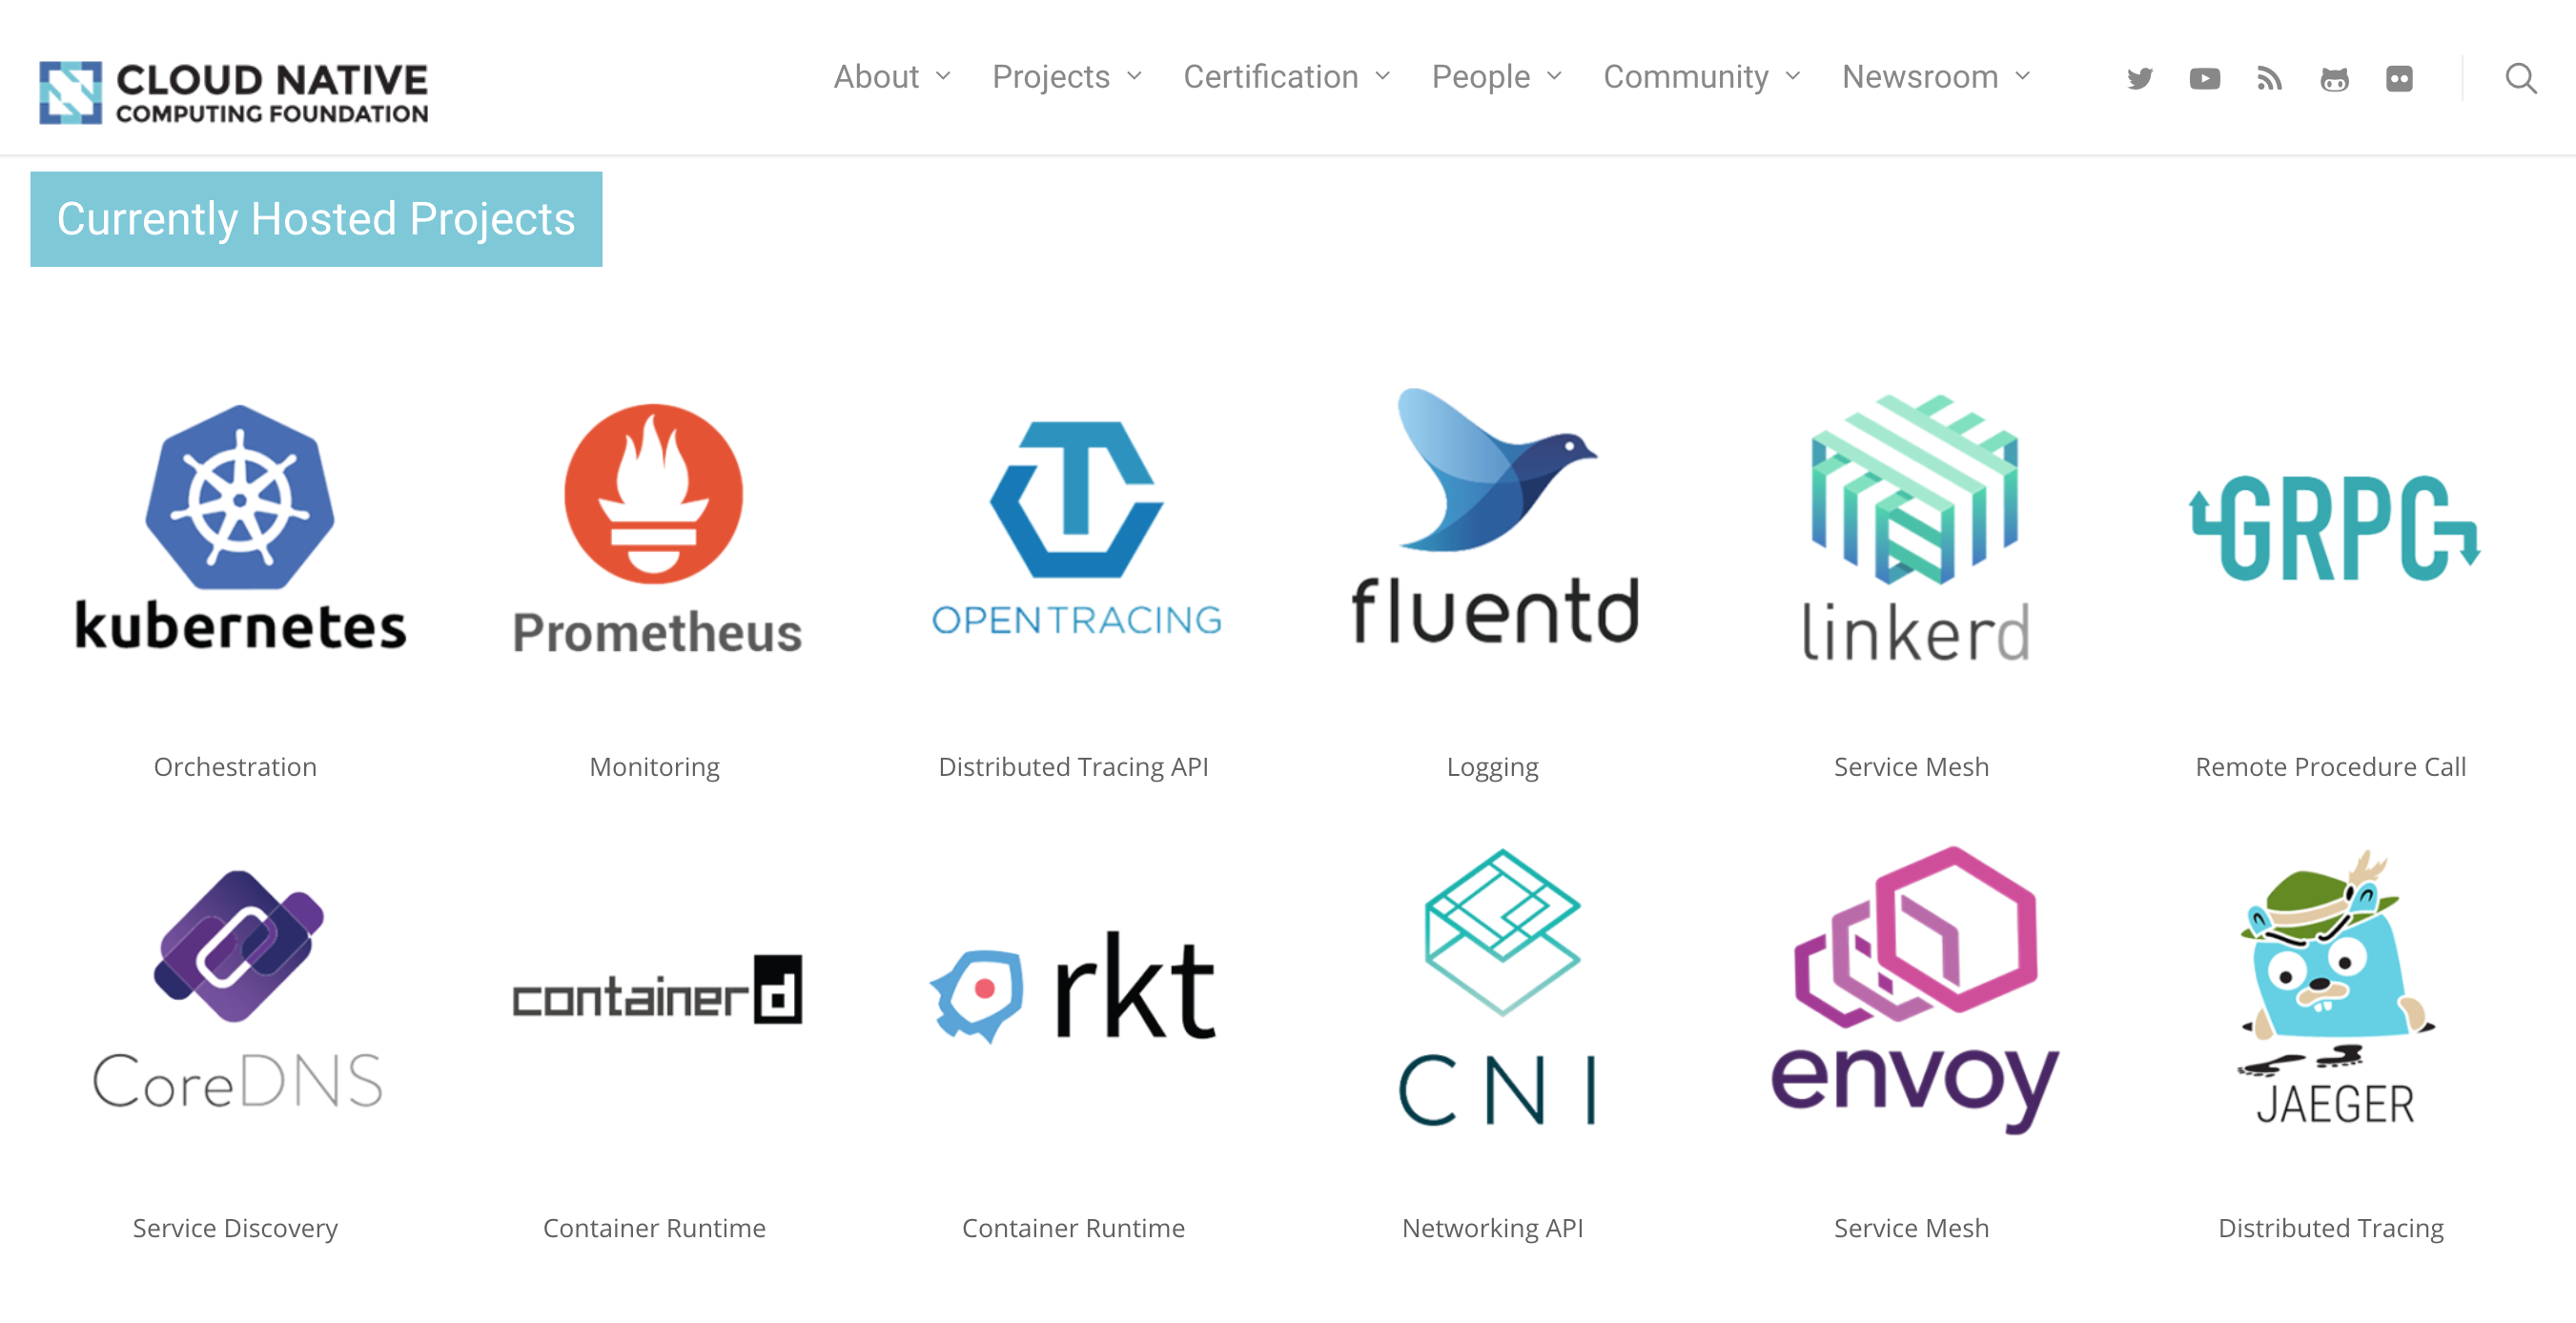
In addition, more recently at the Open Source Summit in LA, Jaeger was put on a par with such honorable projects as Kubernetes and Prometheus.
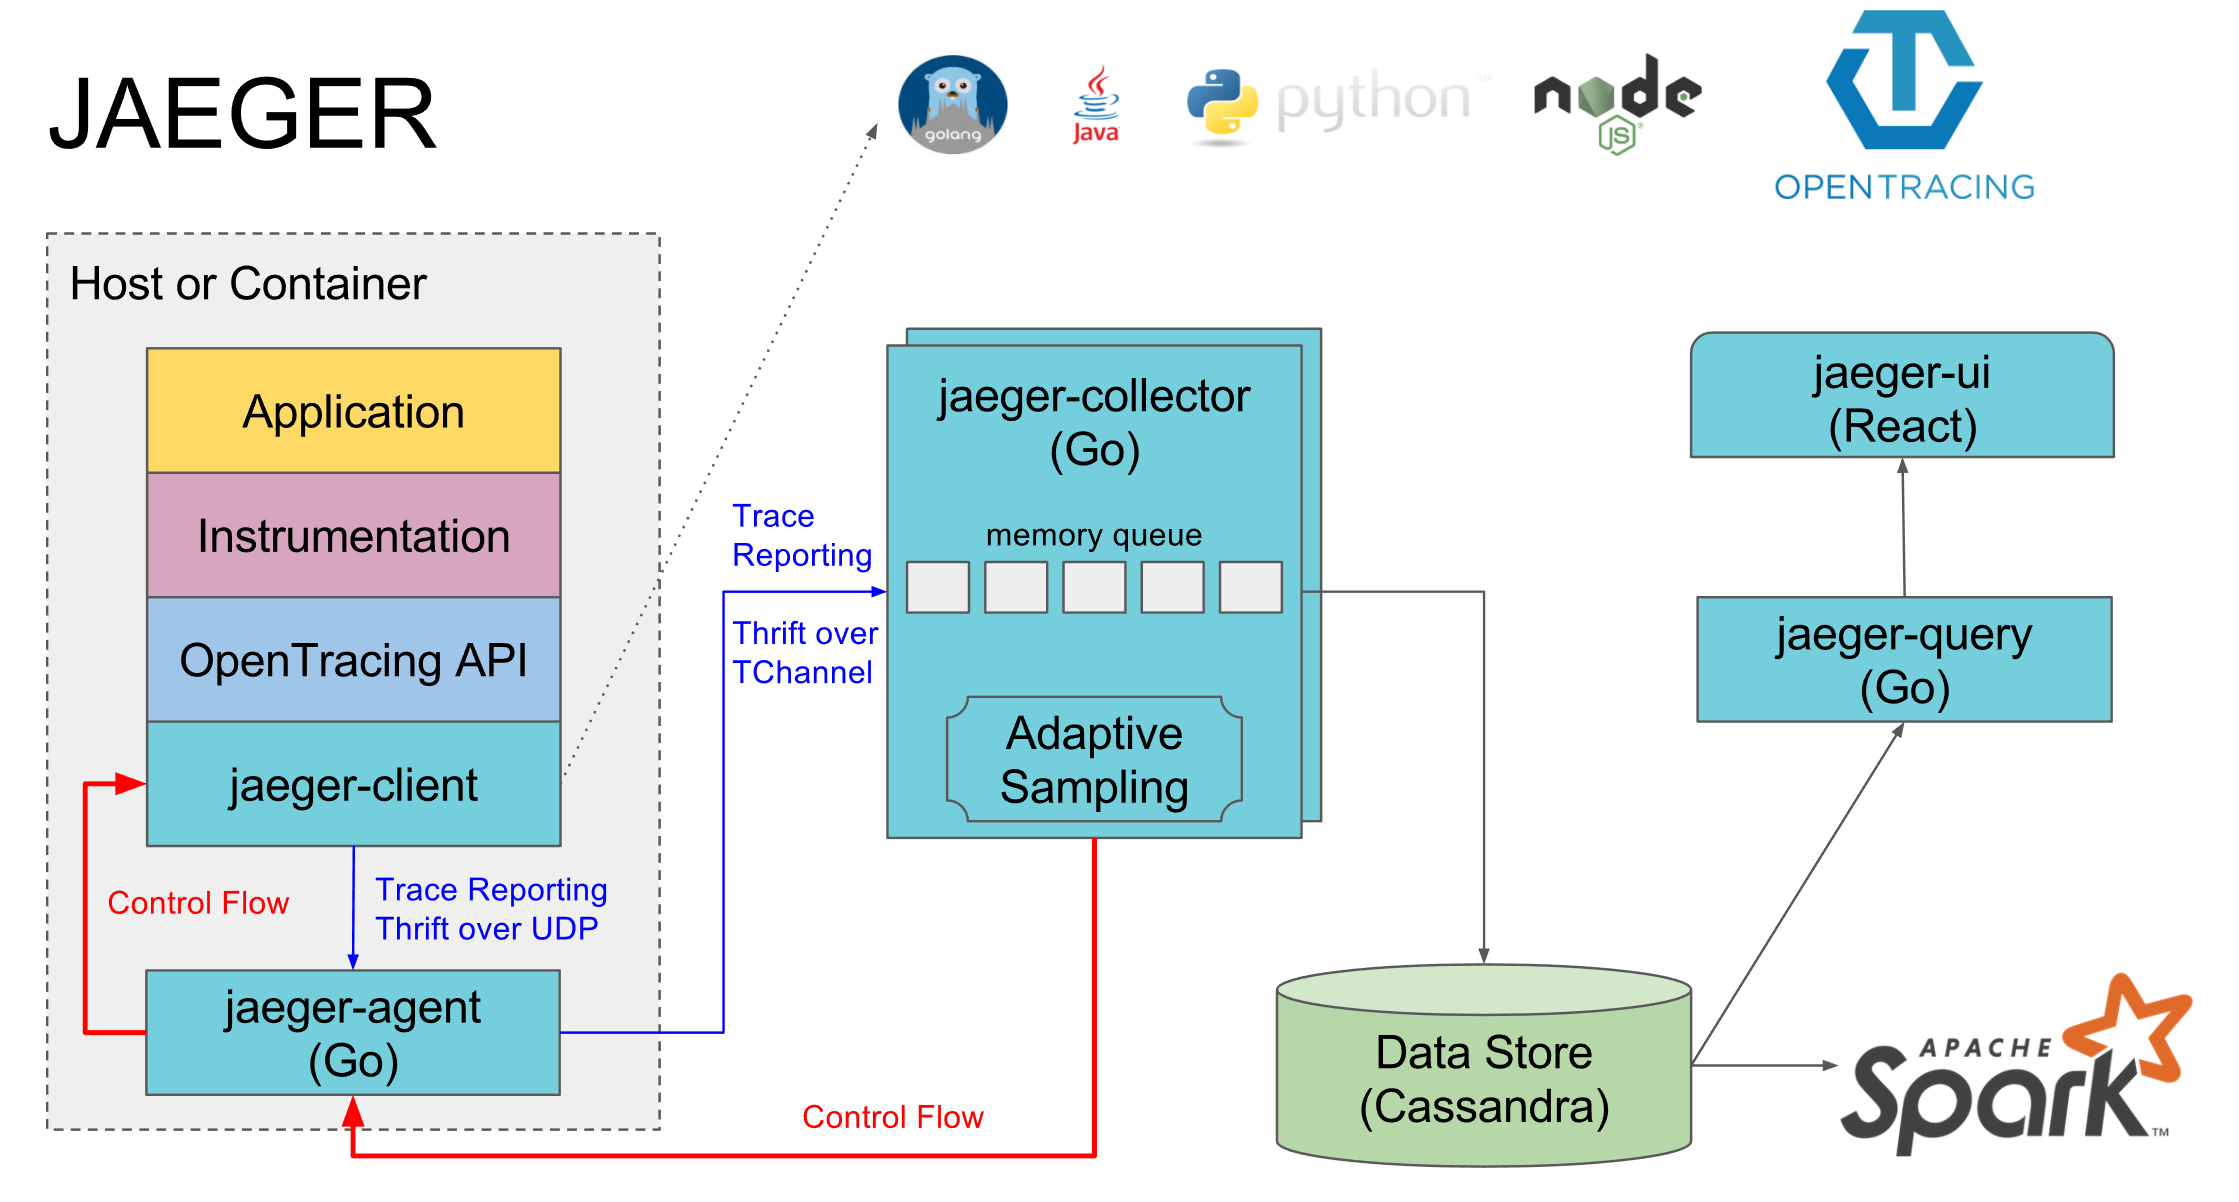
Each service collects timings and additional info into spans and drops them into the nearby jaeger-agent by udp. That, in turn, sends them to jaeger-collector. After that, the traces are available in jaeger-ui. On of.sayte architecture is depicted as follows:
Most of our services are deployed in Docker containers. Drone collects them, and deploy Ansible. Unfortunately (no), we have not yet switched to orchestration systems like k8s, nomad or openshift and the containers are running Docker Compose.
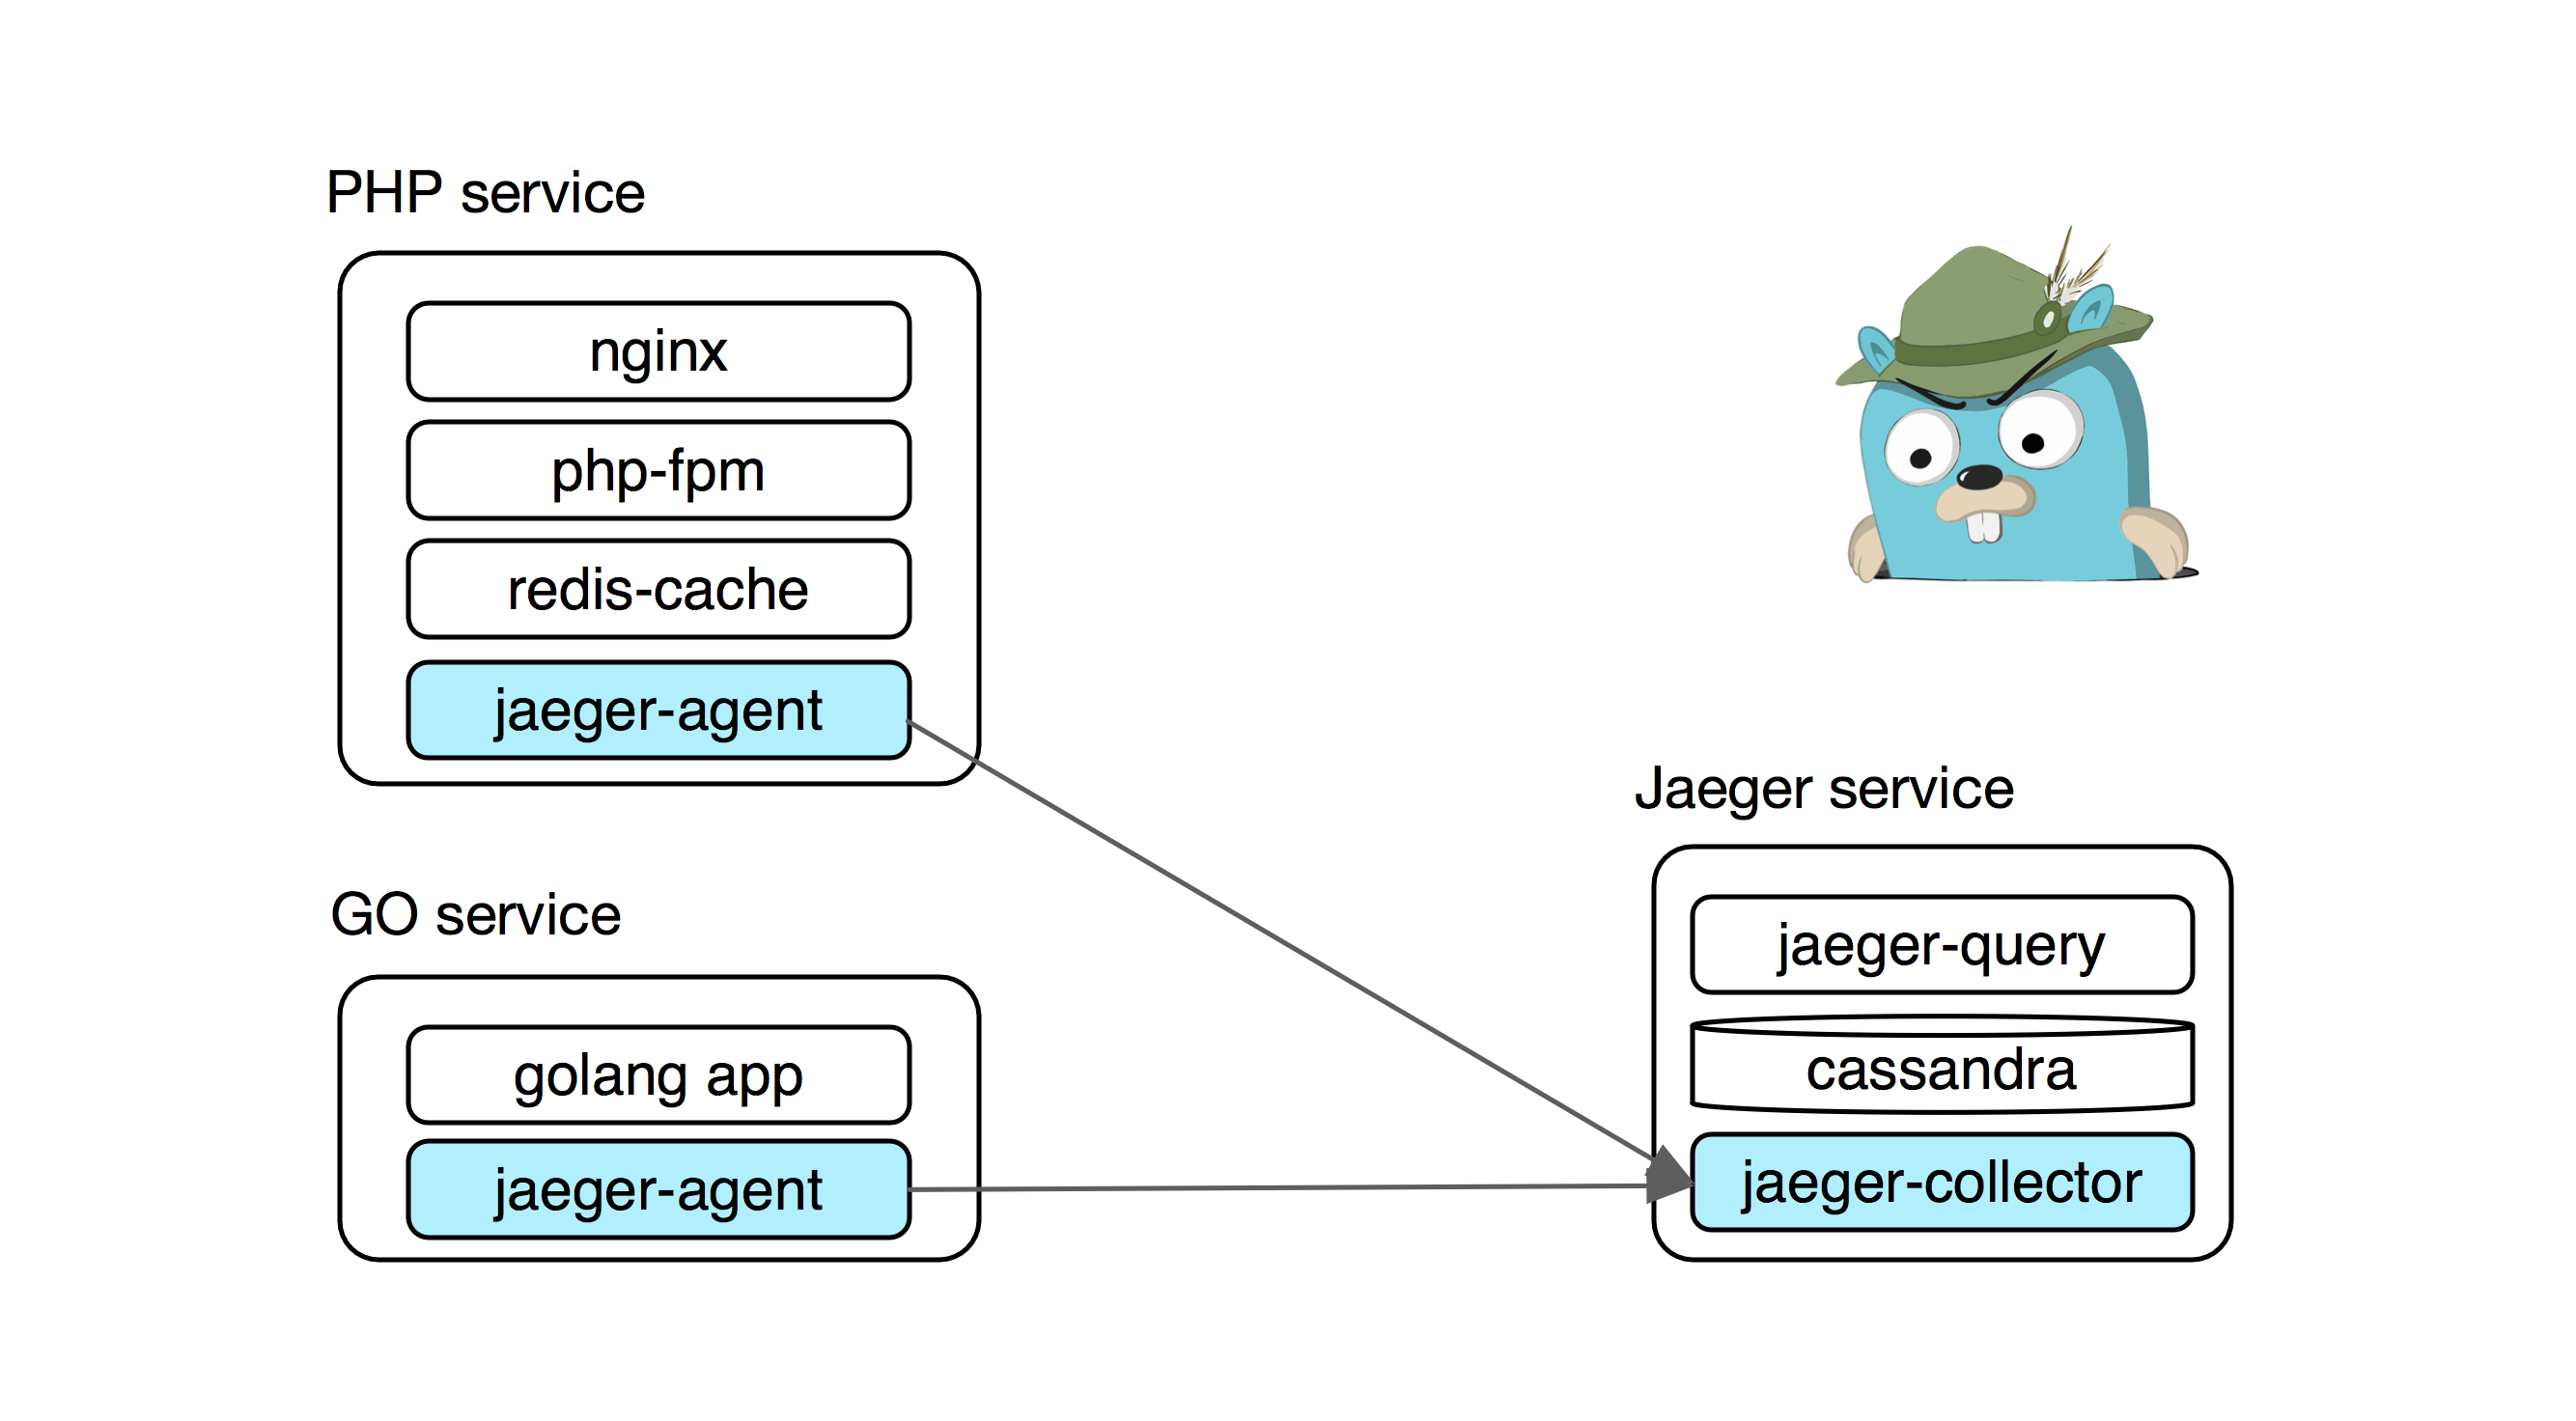
Our typical services in conjunction with jaeger look like this:
Installing Jaeger in production is a collection of several services and storage.
→ collector - receives spans from services and writes them to storage
→ query - Web UI and API for reading spans from storage
→ storage - stores all spans. You can use either cassandra or elasticsearch.
For virgins and local development it is convenient to use the Jaeger all-in-one build with in-memory storage for traces
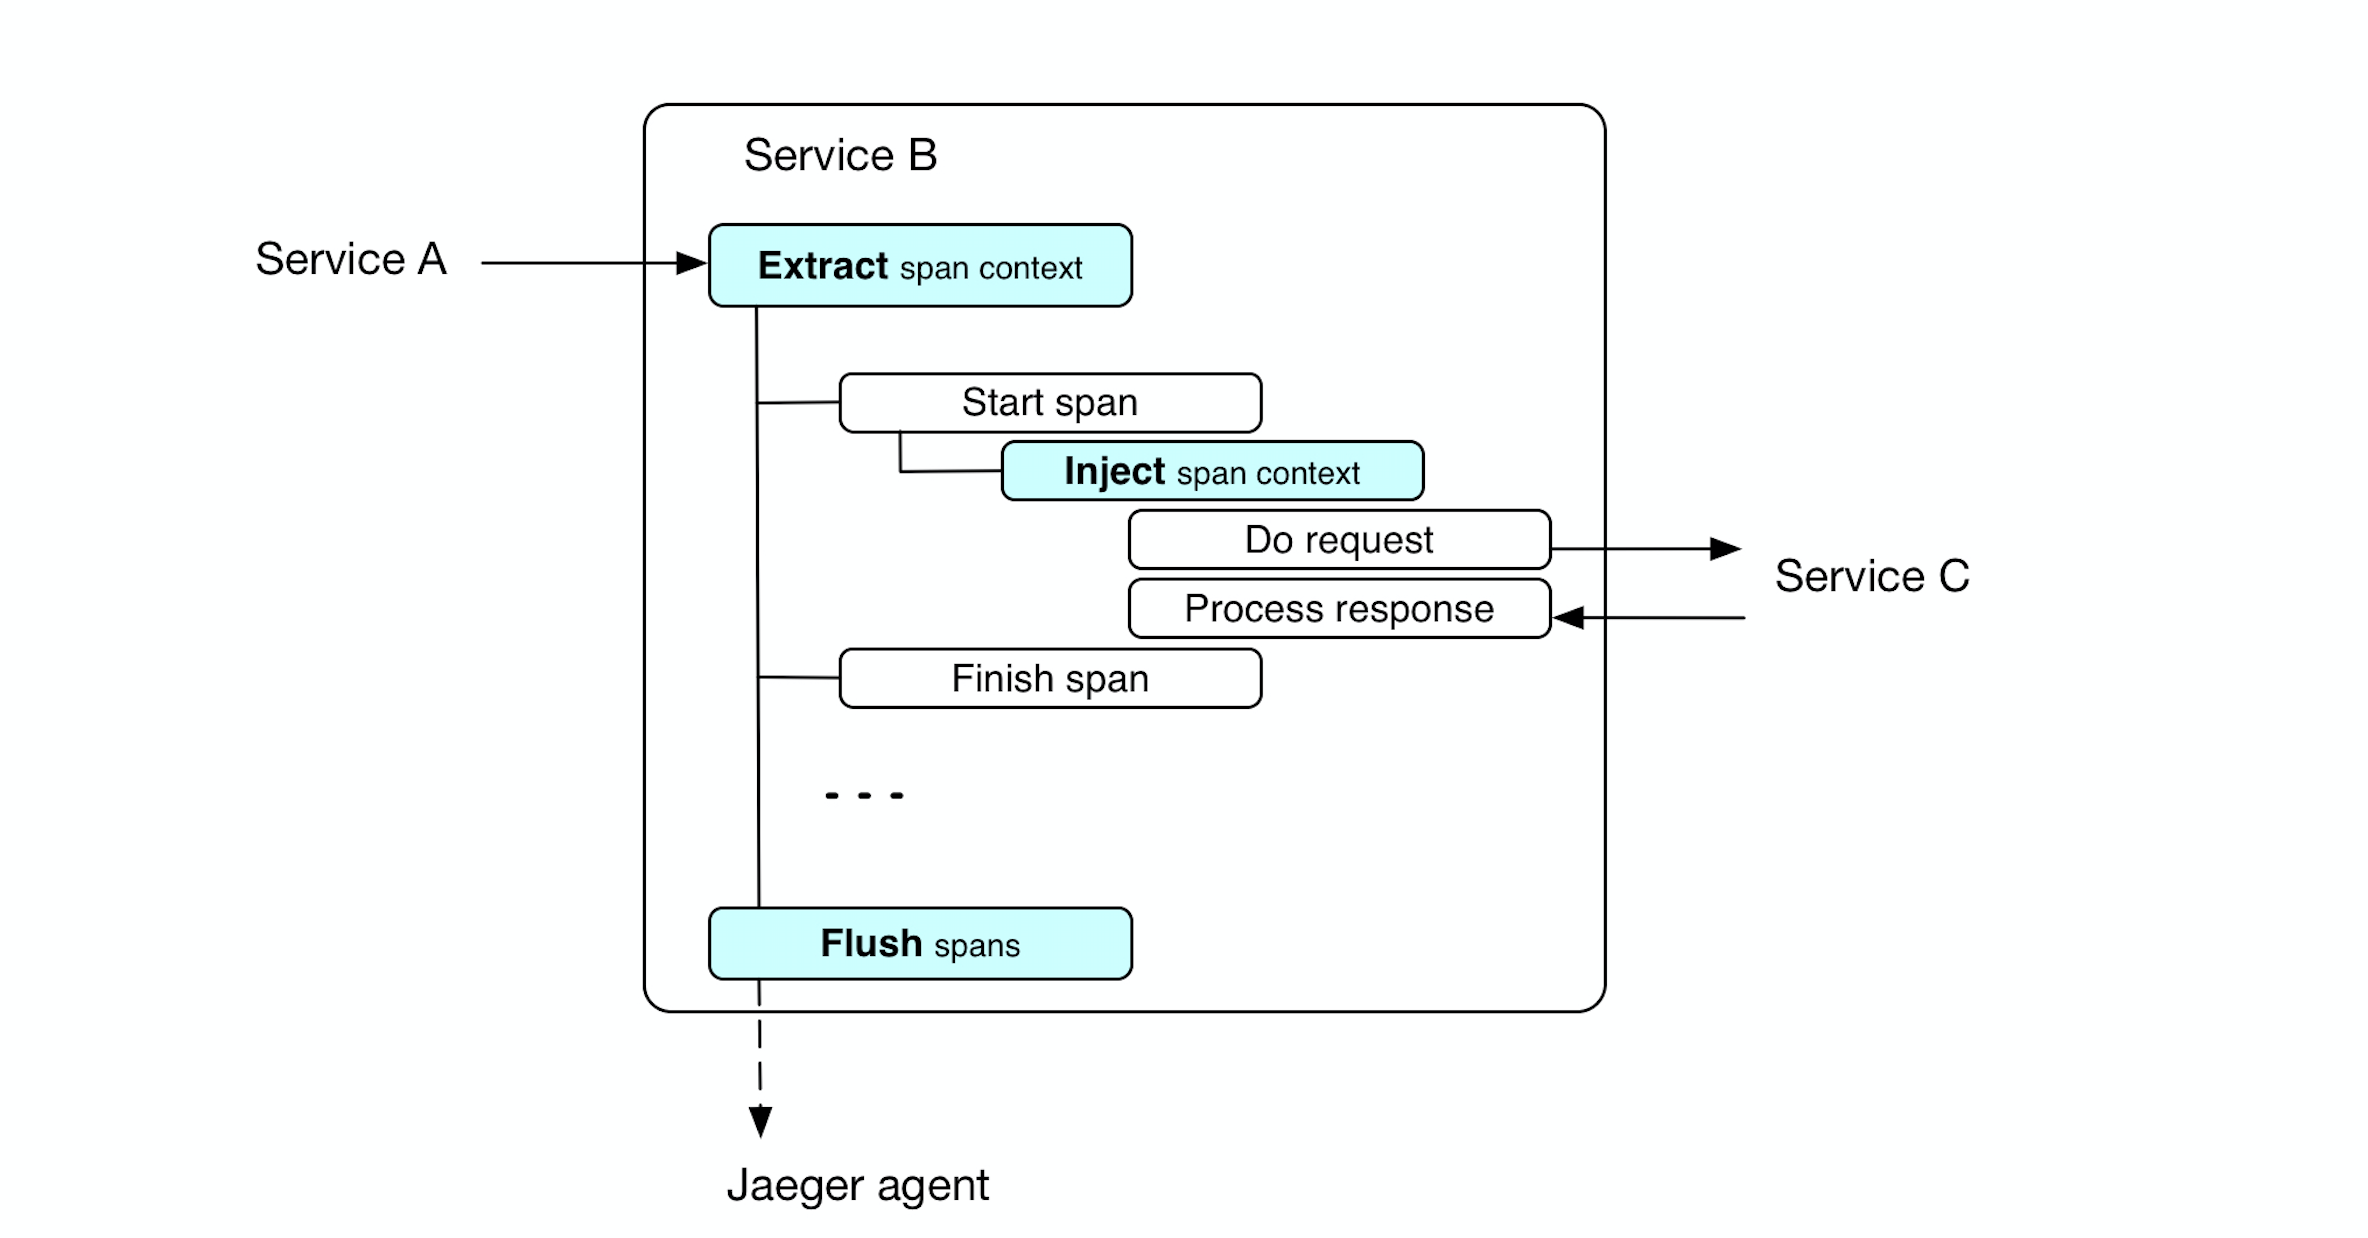
The service collects information on timings and meta request information in spans. Span is passed between methods through the context, and downstream services through the injection of context into the header.
To demonstrate, the uber team prepared a good example illustrating tracing in a driver search service: Hotrod
First we need to create the tracer itself
Add middleware (opentracing.TraceServer) - creates a root span for the api method. All nested spans will be tied to it.
In addition, we extract the Extract context of the trace from the header of the incoming request (opentracing.FromHTTPRequest). Thus, our service will be associated with a superior service, provided that it passed the context of the trace in the request (Inject).
Next we instrument our methods:
Well, the start of the span itself looks like this
It's all. Now we can monitor the operation of our service in real time.
( Big picture )

For example, in the picture above we found a braking request and saw that half of the time was consumed by the network between services, and the second half - update to the database. You can already work with this.
Thanks for attention. I hope this note will be useful, and Jaeger will help someone to bring transparency to the work of services.
→ Of the project website
→ Repository
→ Opentracing website
→ Example
Why microservices
Recently, microservices have been quite a trending topic and many want them even where it is not needed. This is a rather slippery path, stepping on which you need to understand what lies ahead. We did not come to microservices for the sake of trends, but out of necessity, with the realization of all the difficulties that we will encounter.
Initially, CarPrice was built as a monolithic application on Bitrix with the involvement of outsourced developers and focus on development speed. In a certain period, this played one of the important roles in the successful launch of the project on the market.
Over time, it became impossible to maintain the stable operation of the monolith - each release turned into a test for testers, developers and admins. Different processes interfered with the normal operation of each other. For example, a girl from the workflow could start generating documents for completed auctions and at that moment dealers could not bargain normally because of the brakes on the backend.
We started to change. Large parts of the business logic were carried out in separate services: logistics, the legal vehicle cleanliness check service, the image processing service, the service of recording dealers for inspection and issuance, billing, the service of accepting bids, the authentication service, the recommendation system, the API for our mobile and react applications.
What are we writing on
At the moment, we have several dozen services on various technologies that communicate over the network.
These are mainly small applications on Laravel (php) that solve a specific business problem. Such services provide an HTTP API and may have an administrative Web UI (Vue.js)
. We try to arrange common components into libraries that composer delivers. In addition, services inherit a common php-fpm docker image. This relieves a headache when updating. For example, we have almost everywhere php7.1.
We write speed critical services on Golang.
For example, the jwt authentication service writes out and verifies tokens, and also knows how to log out an unscrupulous dealer whom the management for sins disconnects from the auction platform.
The betting service processes dealer bets, saves them to the database and deferredly sends events to rabbitmq and the RT-notification service.
For services on Golang we use go-kit and gin / chi.
The go-kit attracted with its abstractions, the ability to use various transports and wrappers for metrics, but it tires you a bit with a love of functionality and verbosity, so we use it in capital buildings with rich business logic.
On gin and chi, it’s convenient to build simple http services. This is ideal for quickly and with minimal effort to launch a small service in production. If we have complex entities, then we try to transfer the service to go-kit.
Evolution of monitoring
At the time of the monolith, newrelic was enough for us. Having jumped to the step of microservices, the number of servers increased and we abandoned it for financial reasons and rushed to the worst: Zabbix - for iron, ELK, Grafana and Prometheus - for APM.
First of all, we added nginx logs from all services in ELK, built graphs in Grafana, and for requests that spoiled us the 99th percentile we went to Kibana.
And here the quest began - to understand what was happening with the request.
In a monolithic application, everything was simple - if it was php, then there used to be xhprof, armed with which it was possible to understand what was happening there. With microservices where the request passes through several services and even on different technologies, this trick will not work. Somewhere a network, somewhere synchronous requests or a bad cache.
Let's say we found a slow request for our API. According to the code, it was established that the request turned to three services, collected and returned the result. Now we need to find subordinate requests based on indirect signs (timestamp, request parameters) to understand which of the services was the reason for the slow request. Even if we found that service, we need to go to the metrics or service logs and look for the reason there, and it often happens that the lower services work quickly, and the resulting request slows down. Vobschem is so-so pleasure.
And we realized that it was time - we needed distributed tracing.
Jaeger, welcome!
Motivation:
- Search for anomalies - why the 99th percentile is flaked, for example, network timeouts, service drops, or database blockages.
- Diagnosis of mass problems (50th or 75th percentile) after the deployment, changing the configuration of the service or the number of instances
- Distributed profiling - find slow services, components, or features.
Visualization (Gantt) of request stages - you can understand what is happening inside
Remembering Google's Dapper, we first came to Opentracing , the universal standard for distributed trading. It is supported by several tracers. The most famous are Zipkin (Java) and Appdash (Golang).
Recently, however, a new and promising Jaeger from Uber Technologies has appeared among old-timers who support the standard . We’ll talk about him.
Beckend - Go
UI - React
Storage - Cassandra / Elasticsearch
Initially developed under the OpenTracing standard.
Unlike the same Zipkin, the Jaeger model natively supports key-value logging and traces are presented as a directed acyclic graph (DAG) and not just a span tree.
In addition, more recently at the Open Source Summit in LA, Jaeger was put on a par with such honorable projects as Kubernetes and Prometheus.
Architecture
Each service collects timings and additional info into spans and drops them into the nearby jaeger-agent by udp. That, in turn, sends them to jaeger-collector. After that, the traces are available in jaeger-ui. On of.sayte architecture is depicted as follows:
Jaeger in production
Most of our services are deployed in Docker containers. Drone collects them, and deploy Ansible. Unfortunately (no), we have not yet switched to orchestration systems like k8s, nomad or openshift and the containers are running Docker Compose.
Our typical services in conjunction with jaeger look like this:
Installing Jaeger in production is a collection of several services and storage.
→ collector - receives spans from services and writes them to storage
→ query - Web UI and API for reading spans from storage
→ storage - stores all spans. You can use either cassandra or elasticsearch.
For virgins and local development it is convenient to use the Jaeger all-in-one build with in-memory storage for traces
jaegertracing/all-in-one:latestHow it works
The service collects information on timings and meta request information in spans. Span is passed between methods through the context, and downstream services through the injection of context into the header.
To demonstrate, the uber team prepared a good example illustrating tracing in a driver search service: Hotrod
As in code
First we need to create the tracer itself
import (
	"github.com/uber/jaeger-client-go"
	"github.com/uber/jaeger-client-go/config"
        ...
)
jcfg := config.Configuration{
	Disabled: false, // Nop tracer if True
	Sampler: &config.SamplerConfig{
		Type:  "const",
		Param: 1,
	},
	Reporter: &config.ReporterConfig{
		LogSpans:            true,
		BufferFlushInterval: 1 * time.Second,
		// Адрес рядом стоящего jaeger-agent, который будет репортить спаны
		LocalAgentHostPort: cfg.Jaeger.ReporterHostPort,
	},
}
tracer, closer, err := jcfg.New(
	cfg.Jaeger.ServiceName,
	config.Logger(jaeger.StdLogger),
)
Add middleware (opentracing.TraceServer) - creates a root span for the api method. All nested spans will be tied to it.
endpoint := CreateEndpoint(svc)
// Middleware создает корневой спан для метода api
endpoint = opentracing.TraceServer(tracer, opName)(endpoint)
In addition, we extract the Extract context of the trace from the header of the incoming request (opentracing.FromHTTPRequest). Thus, our service will be associated with a superior service, provided that it passed the context of the trace in the request (Inject).
r.Handle(path, kithttp.NewServer(
	endpoint,
	decodeRequestFn,
	encodeResponseFn,
	// Извлекает контекст трейса из хедера и помещает в context.Context
	append(opts, kithttp.ServerBefore(opentracing.FromHTTPRequest(tracer, opName, logger)))...,
)).Methods("POST")
Next we instrument our methods:
func (s Service) DoSmth() error {
    span := s.Tracing.StartSpan("DoSmth", ctx)
    defer span.Finish()
    // do smth
    return nil
}
Well, the start of the span itself looks like this
func (t AppTracing) StartSpan(name string, ctx context.Context) opentracing.Span {
	span := opentracing.SpanFromContext(ctx);
	if span != nil {
		span = t.Tracer.StartSpan(name, opentracing.ChildOf(span.Context()))
	} else {
		span = t.Tracer.StartSpan(name)
	}
	return span
}
It's all. Now we can monitor the operation of our service in real time.
( Big picture )
For example, in the picture above we found a braking request and saw that half of the time was consumed by the network between services, and the second half - update to the database. You can already work with this.
Thanks for attention. I hope this note will be useful, and Jaeger will help someone to bring transparency to the work of services.
useful links
→ Of the project website
→ Repository
→ Opentracing website
→ Example