Configure Display Folders in the SSAS 2016 Tabular Model
- Transfer
- Tutorial
Task
SSAS 2016 created a large tabular model. Most tables have many different measures and measurement fields, making it difficult for users to navigate this abundance. Is there a way to combine objects into groups?
Decision
SSAS multidimensional model for a long time is an appropriate opportunity and it is called the display list (display folders). You can configure the display of dimension attributes in various folders, which makes working with them more convenient for the user. AdventureWorks test cube example .

The SSAS 2012/2014 tabular model does not officially support this feature. However, you can add it by directly editing the XMLA model or using BIDSHelper .
Fortunately, SSAS 2016 provides us with this functionality out of the box and makes it easy to work with it using Visual Studio (SQL Server Data Tools). In this article we will show how this is done.
Display Folder Setup
Let's set up a display folder for several attributes in the WideWorldImporters tabular model. If you select one or more columns, you can specify a Display Folder for them in the property bar.
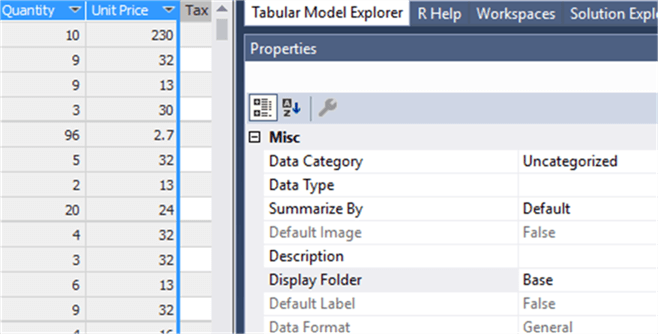
Setting up the display folder for measures is the same. When viewing a model in Excel, we will see a folder in the tree.
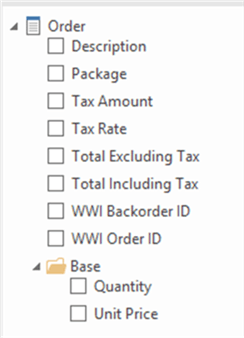
When setting up, you will not find a drop-down list of existing display folders, so you will need to enter their names manually (or copy, of course).
Setting output in multiple folders
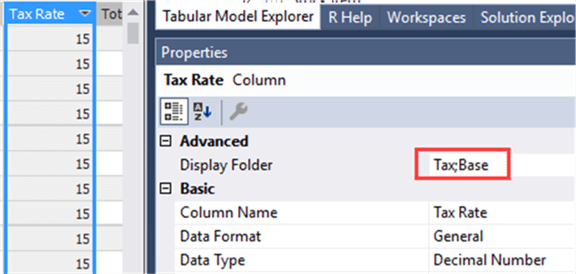
It is possible to configure the output of one measure or attribute in several folders at the same time. To do this, list the folders separated by semicolons. Let's put the Tax Rate column in two folders:
In Excel, it will look like this:
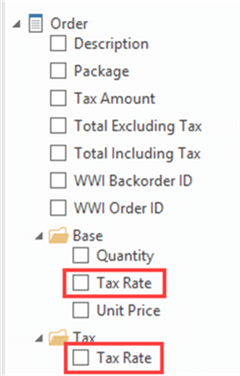
But do not forget that repeatedly displaying the same measure in different folders can be misleading to users.
Subfolders
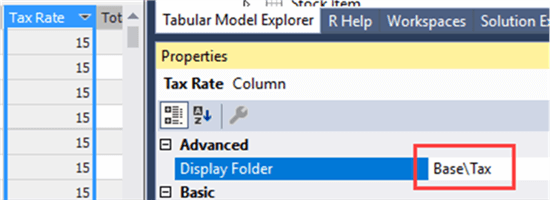
A more interesting option is to create subfolders, and it is achieved using a backslash. Instead of placing the Tax Rate measure in two different folders, let's put it in a subfolder.
Result:
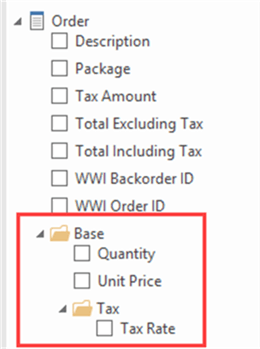
Display folders in various applications
Excel
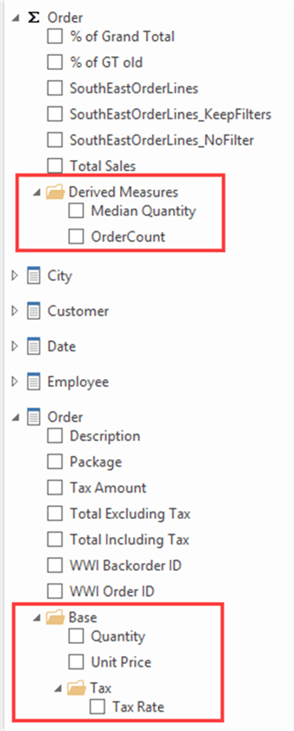
SSAS Tabular Model
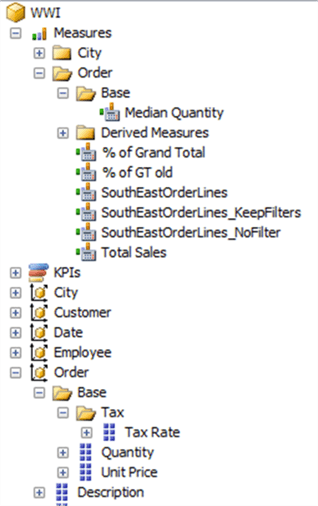
The display folder is located in the group of measures Order, despite the fact that the table model does not have such a concept. If the folder contains various types of objects - measures and dimension attributes, then it will be displayed in the list twice. This statement also applies to the SQL Server Management Studio browser (as this program is still tailored for a multidimensional model). SSMS Snapshot Version 17.2
Power BI Desktop
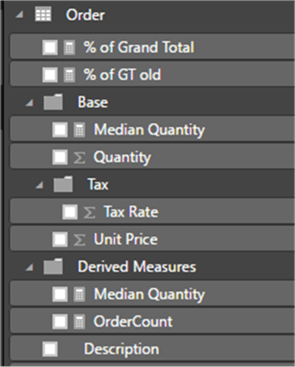
Power BI Desktop seamlessly displays measures and measurement fields in a single folder.
Reporting Services Query Designer
The SSRS query designer behaves in the same way as Excel and SSMS.
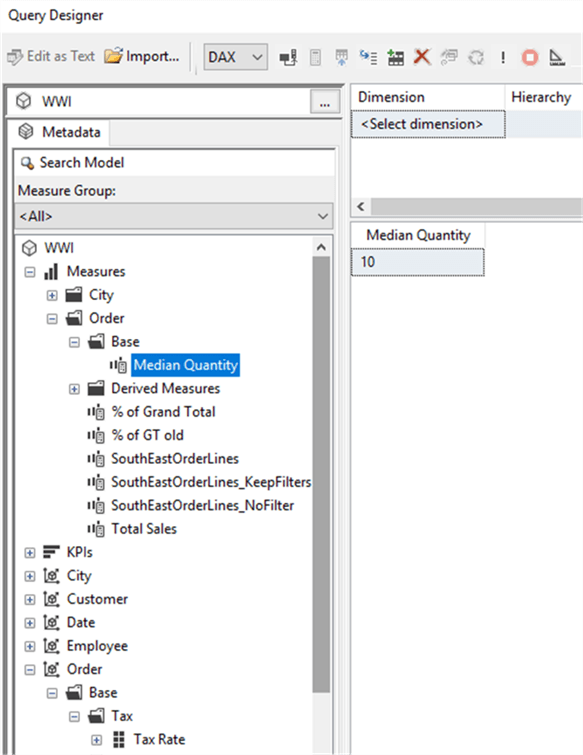
Note that although the query designer supports DAX (in the latest versions of SSDT), the list of fields is still displayed as if we were dealing with a multidimensional model.
Conclusion
Display folders are a great addition to the SSAS 2016 tabular model. This functionality makes it easy to create a more structured view. With it, you can place the same objects in different folders. However, depending on the client application, folders may look different.