Create tools for in-depth analysis of the rating of applications in the Google Play Store

From the translator: today we are publishing for you a joint article by three developers, Akaash Chikarmane, Erte Bablu and Nikhil Gaur, which describes the method for predicting the rating of applications on the Google Play Store.
In this article we will show how to process information that we use to predict the rating. We will also explain why we use one or another of them. We will talk about the transformations of the data package with which we work, and what can be achieved with the help of visualization.
Skillbox recommends: A two-year hands-on course “I am a PRO web developer . ”
We remind: for all readers of "Habr" - a discount of 10,000 rubles when writing to any Skillbox course on the promotional code "Habr".
Why we decided to do it
Mobile applications have long become an integral part of life, more and more developers are engaged in their creation alone. And many are directly dependent on the revenues that bring applications. Therefore, predicting success is of great importance to them.
Our goal is to determine the overall rating of the application, to do it in a comprehensive manner, since too many people judge the program based only on the number of asterisks set by users. Applications with 4-5 points are more credible.
Training
Most of this project is working with data, including preprocessing. Since all the information was taken from the Google Play Store, the resulting arrays contained a lot of errors. We used several regression models, including the Gradient-Boosting Regressor from the XGBoost, Linear Regression and RidgeRegression.
Data collection and analysis
The data set we worked with is available here . It consists of two parts. The first is objective information, such as application size, number of installations, category, number of reviews, type of application, its genre, date of last update, etc., and subjective, that is, user reviews.
The reviews themselves were also analyzed. After comparing the results, we decided to include or not the survey data in the final model.
We formed the objective data set by 12 functions and one target variable (rating). The package included 10.8 thousand units of information. As for user reviews, we selected the 100 most relevant and used five functions for 64.3 thousand items. All data was collected directly from the Google Play Store, the last time they were updated three months ago.
Preliminary data processing
The initial set of information looked like this:
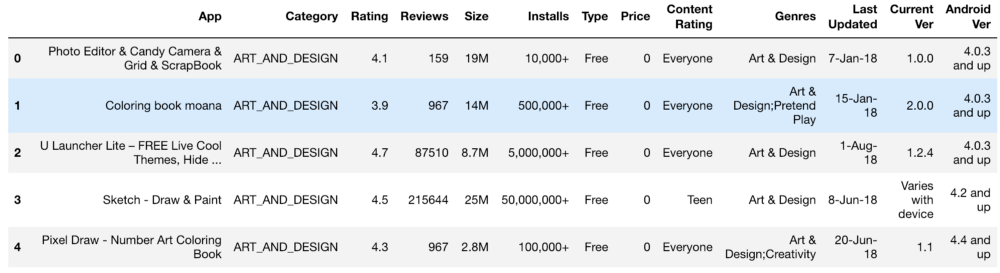
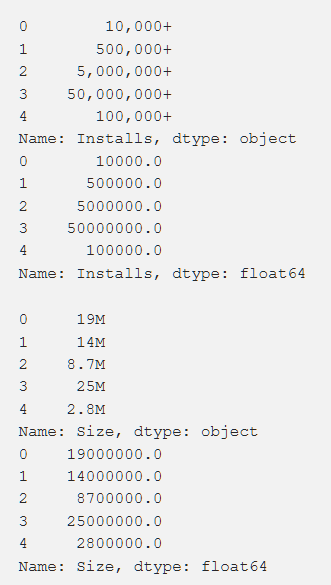
Settings, rating, cost, and size — we processed it all in order to get the numbers that are understandable to the machine. When processing various functions, there were problems like the need to delete the "+". In the cost, we removed $. The size of the application turned out to be the most problematic in terms of processing, since there were both KBs and MBs, so it was necessary to do some work on reducing everything to a single format. Below are the primary data and they are after processing.
In addition, we have converted some data, making it more relevant to our work. For example, information about the last update of the application was not very useful. In order to make them more meaningful, we have converted it into information about the time since the last update. The code for this task is shown below.
from datetime import datetime
from dateutil.relativedelta import relativedelta
n = 3# month bin size
last_updated_list = (new_google_play_store["Last Updated"]).values
last_n_months = list()
for (index, last_updated) in enumerate(last_updated_list):
    window2 = datetime.today()
    window1 = window2 - relativedelta(months=+n)
    date_bin = 1#print("{0}: {1}".format(index, last_updated))
    last_update_date = datetime.strptime(last_updated, "%d-%b-%y")
    while(not(window1 < last_update_date < window2)):
        date_bin = date_bin + 1
        window2 = window2 - relativedelta(months=+n)
        window1 = window1 - relativedelta(months=+n)
    last_n_months.append(date_bin)
new_google_play_store["Updated ({0} month increments)".format(n)] = last_n_months
new_google_play_store = new_google_play_store.drop(labels = ["Last Updated"], axis = 1)
new_google_play_store.head()
It was also necessary to bring to a single standard variables with several different values (for example, "Genre"). How it was done is shown below.
from copy import deepcopy
from sklearn.preprocessing import LabelEncoder
defone_hot_encode_by_label(df, labels):
df_new = deepcopy(df)
for label in labels:
dummies = df_new[label].str.get_dummies(sep = ";")
df_new = df_new.drop(labels = label, axis = 1)
df_new = df_new.join(dummies)
return df_new
deflabel_encode_by_label(df, labels):
df_new = deepcopy(df)
le = LabelEncoder()
for label in labels:
print(label + " is label encoded")
le.fit(df_new[label])
dummies = le.transform(df_new[label])
df_new.drop(label, axis = 1)
df_new[label] = pd.Series(dummies)
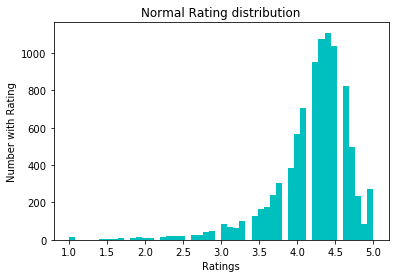
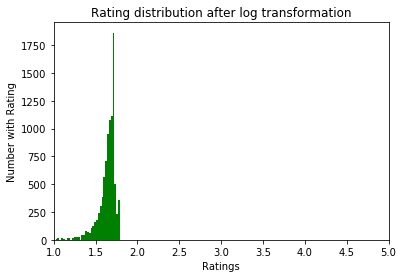
return df_newTo normalize the data, we tried the log1p conversion. Before him:
After:
Examine the data
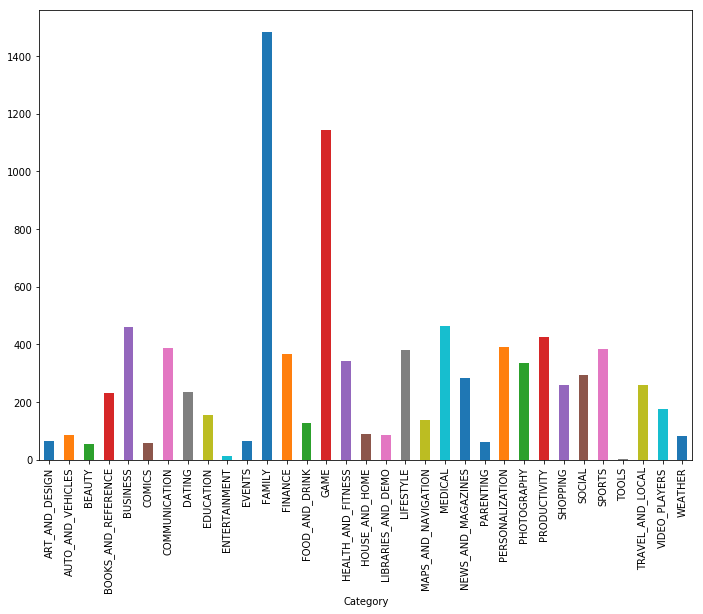
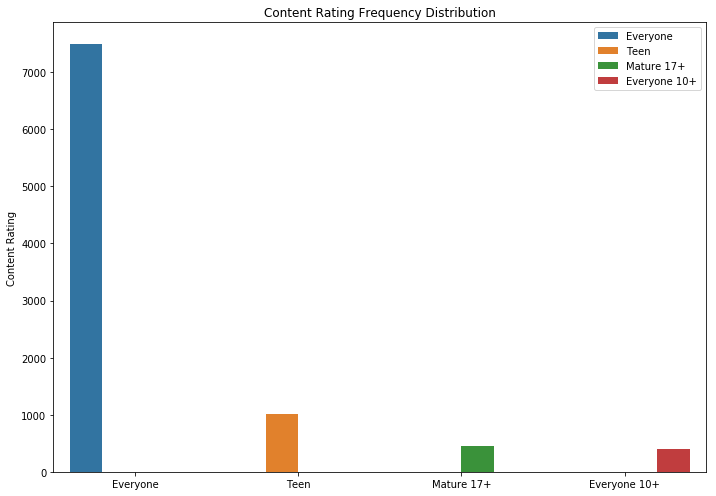
As you can see, games and applications for the family are the two most popular categories. Most of the applications in addition were included in the category "For all ages."

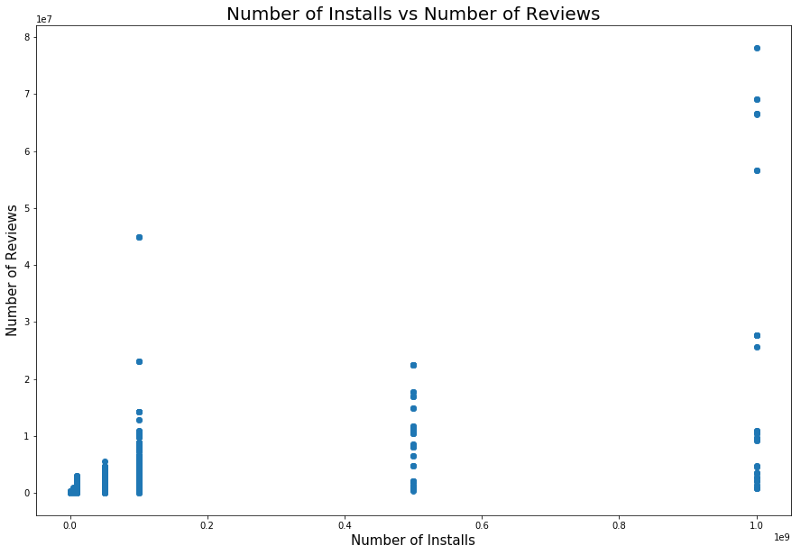
It is logical that applications with the highest rating have more reviews than low-rated ones. Some of them have much more reviews than all the others. Perhaps the reason for this is a pop-up message, a call to rate or other methods of a similar nature.

There is also a relationship between the number of installations and the number of reviews. The correlation is shown in the screenshot below.
A detailed analysis of this dependency can provide insight into why popular categories of applications have more installations and more reviews.
Models and results
We used split tests to break down data into test and training sets. Cross-validation using GridSearchCV was used to improve the model’s learning outcomes to find the best alpha using Lasso, Ridge regression and XGBRegressor from the XGBoost package. The latter model is generally extremely effective, but using it one must beware of fitting the results - this is one of the dangers that lie ahead of the researchers. The initial rms value without any particularly careful processing of objects (only coding and cleaning) was about 0.228.
After the logarithmic conversion of the ratings, the rms error decreased to 0.219, which was a slight improvement, but we understood that we did everything right.
We used linear regression after evaluating the relationship between surveys, installations, and ratings. In particular, they analyzed the statistical information of these variables, including r-squared and p, having made a decision on linear regression as a result. The first linear regression model used showed a correlation between attitudes and a rating of 0.2233, the linear regression model “Our Reviews” and “Ratings” gave us MSE 0.2107, and the combined linear regression model, “Reviews”, “Installations” and “Ratings” ”, Gave us MSE .214.
In addition, we used the KNeighborsRegressor model. The results of its application are shown below.

findings
After the primary data from the Google Play Store was converted to a usable format, we plotted the graphs and derived functions to understand the correlations between the individual values. Then we used these results to build an optimal model.
Initially, we thought that it would not be very difficult to find it, so that we would be able to build an exact model. But the task was harder than we expected.
In addition to what has been done, you can still:
- create a separate model for each genre;
- create new functions from the Android OS versions, as we previously did with dates;
- to learn the algorithm more deeply - we had a sufficient number of categorical and numeric data points;
- independently parse and clear data from the Google App Store.
All results are available here .
Skillbox recommends:
- Online course "Profession frontend-developer"
- Practical course "Mobile Developer PRO" .
- Practical annual course "PHP developer from 0 to PRO" .