VESNIN Server: First Disk Subsystem Tests
When debugging a server instance of the first revision, we partially tested the speed of the I / O subsystem. In addition to the numbers with the test results, in the article I tried to reflect the observations that may be useful to engineers in designing and configuring application I / O.

I'll start from afar. Up to 4 processors (up to 48 POWER8 cores) and a lot of memory (up to 8 TB) can be delivered to our server. This opens up many possibilities for applications, but the large amount of data in RAM entails the need to store them somewhere. Data must be quickly removed from the disks and also crammed back quickly. In the near future, we are waiting for a wonderful world of disaggregated non-volatile and shared memory. In this beautiful future, perhaps there will be no need for a backing store at all. The processor will copy bytes directly from the internal registers to non-volatile memory with an access time like DRAM (tens of ns) and the memory hierarchy will be reduced by one floor. This is all later, now all the data is usually stored on a block disk subsystem.
We decide on the initial conditions for testing:
The server has a relatively large number of processing cores. It is convenient to use for parallel processing of a large amount of data. That is, one of the priorities is a large bandwidth of the I / O subsystem with a large number of parallel processes. As a result, it is logical to use the microbenchmark and configure a lot of parallel threads.
In addition, the input / output subsystem is built on NVMe disks, which can handle many requests in parallel. Accordingly, we can expect performance gains from asynchronous I / O. In other words, the high throughput in parallel processing is interesting. This is more appropriate for the purpose of the server. Performance on single-threaded applications, and achieving minimum response time, although it is one of the goals of future tuning, is not considered in this test.
The benchmarks of individual NVMe disks are full on the network, it is not worthwhile to produce extra ones. In this article, I consider the disk subsystem as a whole, so we will mainly load disks in groups. As the load, we will use 100% random read and write with a block of different sizes.
On a small 4KB block, we will look at IOPS (the number of operations per second) and, secondly, latency (response time). On the one hand, the focus on IOPS is a legacy from hard drives, where random access by a small block brought the greatest delays. In today's world, all-flash systems are capable of delivering millions of IOPS, often more than software can use. Now “IOPS-intensive workloads” are valuable in that they show a balanced system in terms of computing resources and bottlenecks in the software stack.
On the other hand, for some tasks, it is not the number of operations per second that matters, but the maximum throughput on a large block of ≥64KB. For example, when dumping data from memory to disks (database snapshot) or loading a database into memory for in-memory computing, warming up the cache. For a server with 8 terabytes of memory, the throughput of the disk subsystem is of particular importance. On a large block, we will look at the bandwidth, that is, megabytes per second.
The server disk subsystem can include up to 24 NVMe standard disks. The disks are evenly distributed across four processors using two PCI Express switches PMC 8535. Each switch is logically divided into three virtual switches: one x16 and two x8. Thus, PCIe x16, or up to 16 GB / s, is available for each processor. Each processor has 6 NVMe drives connected. In total, we expect bandwidth up to 60 GB / s from all drives.
For tests, I have access to a server instance with 4 processors (8 cores per processor, maximum 12 cores). Disks are connected to two out of four sockets. That is, it is half of the maximum configuration of the disk subsystem. On the backplane with PCI Express switches of the first revision, two Oculink connectors turned out to be faulty, and therefore only half of the disks are available. In the second revision, this was already fixed, but here I was able to put only half of the disks, namely the following configuration was obtained:
The variety of disks is due to the fact that we are simultaneously testing them to form an assortment of standard components (disks, memory, etc.) from 2-3 manufacturers.
To begin, we will perform a simple test in the minimum configuration - one disk (Micron MTFDHAL2T4MCF-1AN1ZABYY), one POWER8 processor and one fio stream with queue = 16.
It turned out like this:
What do we see here? Received 133K IOPS with a response time of 119 μs. Note that the processor load is 73%. It's a lot. What is the processor busy with?
We use asynchronous I / O, and this simplifies the analysis of the results. fio separately considers slat (submission latency) and clat (completion latency). The first includes the execution time of the read system call before returning to user space. That is, all kernel overheads before the request leaves the hardware are shown separately.
In our case, slat is only 2.8 microseconds per request, but taking into account the repetition of this 133,000 times per second, a lot is obtained: 2.8 microseconds * 133,000 = 372 ms. That is, 37.2% of the time the processor spends only on IO submission. And there is also the code for fio itself, interrupts, the operation of the asynchronous input-output driver.
The total processor load is 73%. It seems that the kernel will not pull another fio, but let's try:
With two threads, the speed grew from 133k to 180k, but the kernel is overloaded. By top, CPU utilization is 100% and clat has grown. That is, 188k is the limit for one core at this load. At the same time, it is easy to see that the growth of clat is caused precisely by the processor, and not by the disk. Let's see 'biotop' ():
Due to the included tracing, the speed dipped somewhat, but the response time from the disks is ~ 109 μs, the same as in the previous test. Other measurements (sar -d) show the same numbers.
For the sake of curiosity, it is interesting to see what the processor is busy with:
Single core load profile (perf + flame graph) with multithreading disabled and two fio processes running. As you can see, he does something 100% of the time (idle = 0%).
Visually, the processor time is more or less evenly distributed between a large number of user (fio code itself) and kernel functions (asynchronous I / O, block level, driver, many small peaks - these are interruptions). One function is not visible where an abnormally large amount of processor time would be spent. It looks good and, when viewing the stacks, it doesn’t come up with any ideas what could be twisted here.
So, we found out that with an active load on IO, the processor is easy to overload. The processor utilization figure indicates that it is busy for the operating system, but does not say anything about loading the processor nodes. Including, the processor may seem busy while waiting for external components, such as memory. Here we do not have a goal to find out the processor efficiency, but to understand the tuning potential, it is interesting to look at the “CPU counters”, partially accessible through 'perf'.
The output above shows that IPC (insn per cycle) 0.73 is not so bad, but theoretically on Power8 it can be up to 8. In addition, 50% of the “backend cycles idle” (PM_CMPLU_STALL metric) can mean a memory wait. That is, the processor is busy for the Linux scheduler, but the resources of the processor itself are not particularly busy. It is quite possible to expect a performance gain from the inclusion of multithreading (SMT), with an increase in the number of threads. The result of what happened when you turned on SMT is shown in the graphs. I received a noticeable speed increase from additional fio processes running on other threads of the same processor. For comparison, the case where all threads work on different cores (diff cores) is given.
The graphs show that the inclusion of SMT8 gives an almost twofold increase in speed and a decrease in response time. It’s not bad, and with one core we shoot> 400K IOPS! Along the way, we see that one core, even with SMT8 turned on, is not enough to fully load an NVMe disk. Scattering fio streams across different cores, we get almost twice the best disk performance - this is what modern NVMe can do.
Thus, if the application architecture allows you to adjust the number of writing / reading processes, it is better to adjust their number to the number of physical / logical cores, in order to avoid slowdowns from overloaded processors. One NVMe drive can easily overload the processor core. The inclusion of SMT4 and SMT8 gives a multiple increase in productivity and can be useful for loads with intensive I / O.
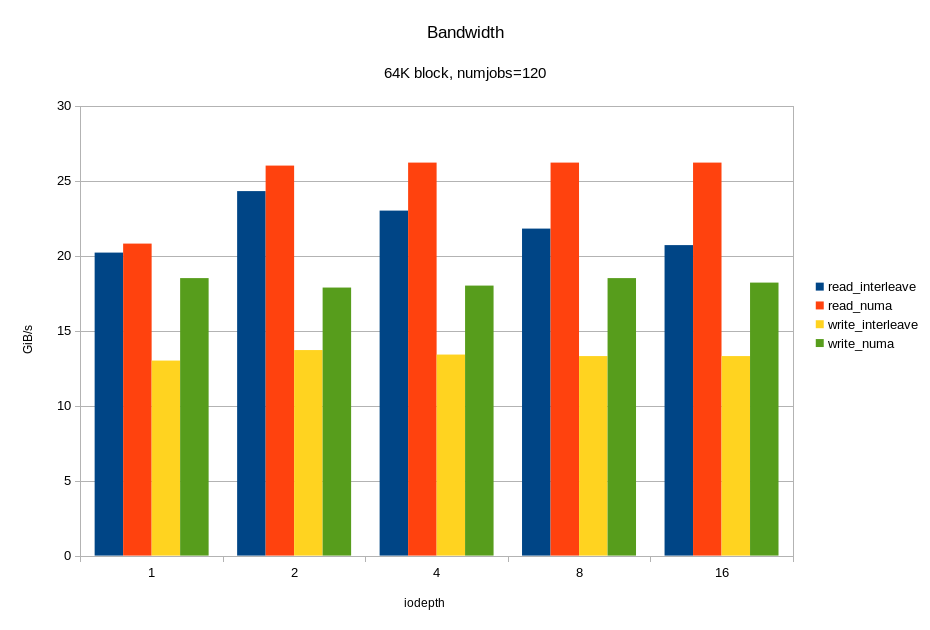
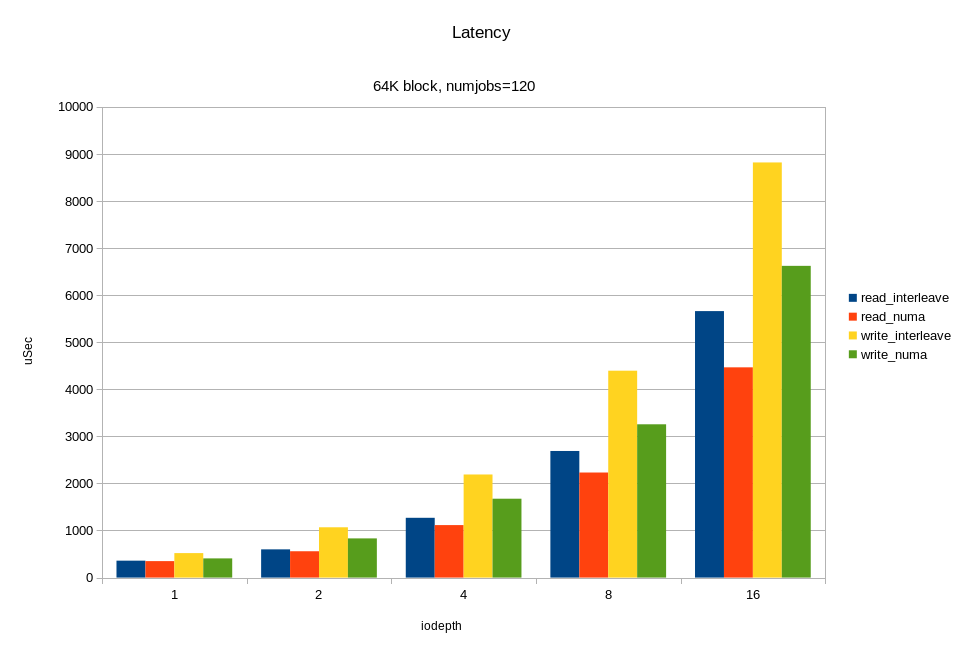
For load balancing, 24 internal NVMe server disks are evenly connected to four processor sockets. Accordingly, for each disk there is a “native” socket (NUMA locality) and “remote”. If the application accesses disks from a “remote” socket, then the overhead from the influence of the interprocessor bus is possible. We decided to see how access from a remote socket affects the final performance of the drives. For the test, run fio again and use numactl to bind fio processes to one socket. First to the "native" socket, then to the "remote". The purpose of the test is to understand whether it is worth the effort to configure NUMA, and what effect can be expected? On the graph, I compared only one remote socket out of three due to the lack of difference between them.
Fio configuration:
Changing the queue, I watched the bandwidth and response time, starting the load in the local socket, remote, and without binding to the socket at all.
As can be seen in the graphs, the difference between the local and remote socket is and is very noticeable at high load. Overhead occurs at queue 16 (iodepth = 16)> 2M IOPS with a 4K block (> 8 GB / s, simply put). One could conclude that NUMA is worth focusing only on tasks where a large I / O bandwidth is needed. But not everything is so simple, in a real application, besides I / O, there will be traffic on the interprocessor bus when accessing memory in a remote NUMA locality. As a result, a slowdown can occur with less I / O traffic.
And now, the most interesting. We load all 12 available disks at the same time. Moreover, taking into account previous experiments, we will do this in two ways:
We look at what happened:
For random read operations with a 4KB block, we got ~ 6M IOPS with a response time of <330 μs. For the 64KB block, we got 26.2 GB / s. Probably we rest on the x16 bus between the processor and the PCIe switch. Let me remind you that this is half the hardware configuration! Again, we see that under heavy load, linking I / O to the "home" locality gives a good effect.
Giving disks to the entire application is usually inconvenient. An application may either have too few single disks or too many. Often you want to isolate application components from each other through different file systems. On the other hand, I want to evenly balance the load between the I / O channels. LVM comes to the rescue. Disks are organized into disk groups and distribute space between applications through logical volumes. In the case of conventional spindles, or even disk arrays, the LVM overhead is relatively small compared to disk latency. In the case of NVMe, the response time from disks and the overhead of the software stack are digits of the same order. interesting to see them separately.
I created an LVM group with the same drives as in the previous test, and loaded the LVM volume with the same number of reading threads. As a result, I received only 1M IOPS and 100% processor utilization. With perf, I did a processor profiling, and this is what happened:
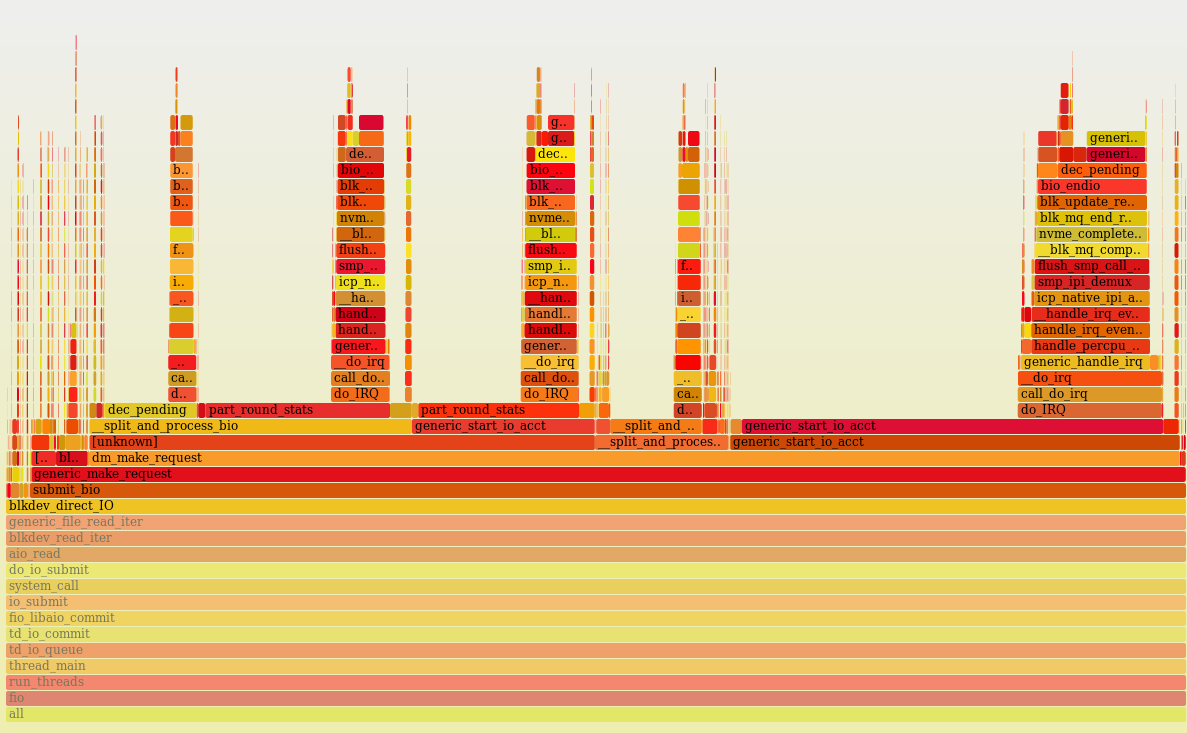
On Linux LVM uses Device Mapper, and obviously the system spends a lot of time counting and updating disk statistics in the generic_start_io_acct () function. I did not find how to disable statistics collection in Device Mapper, (in dm_make_request ()). There is probably potential for optimization. In general, at the moment, the use of Device Mapper can adversely affect performance under heavy IOPS load.
Polling is a new Linux input / output driver driver mechanism for very fast devices. This is a new feature, and I will mention it only to say why it is not tested in this review. The novelty of the feature is that the process is not removed from execution while waiting for a response from the disk subsystem. Context switching is usually performed while waiting for I / O and is expensive in itself. The overhead of context switching is estimated in units of microseconds (the Linux kernel needs to remove one process from execution, calculate the most worthy candidate for execution, etc., etc.) Interruptions during polling can be saved (only context switching is removed) or completely eliminated . This method is justified for a number of conditions:
The reverse side of polling is an increase in processor load.
In the current Linux kernel (now 4.10 for me), polling is turned on by default for all NVMe devices, but it works only for cases when the application specifically asks it to be used for individual "especially important" I / O requests. The application should set the flag RWF_HIPRI in the system calls preadv2 () / pwritev2 ().
Since single-threaded applications are not related to the main topic of the article, polling is postponed for the next time.
Although we have a test sample with half the configuration of the disk subsystem, the results are impressive: almost 6M IOPS with 4KB and> 26 GB / s for 64KB. For the built-in disk subsystem of the server, this looks more than convincing. The system looks balanced in terms of the number of cores, the number of NVMe disks per core, and the width of the PCIe bus. Even with terabytes of memory, the entire volume can be read from disks in minutes.
Linux NVMe stack is lightweight, the processor is overloaded only with heavy load fio> 400K IOPS, (4KB, read, SMT8).
An NVMe drive is fast on its own, and getting it saturated with the application is quite difficult. There is no longer a problem with slow disks, but there may be a problem with the limitations of the PCIe bus and the I / O software stack, and sometimes kernel resources. During the test, we practically did not rest against the disks. Intensive I / O is very stressful for all server subsystems (memory and processor). Thus, for I / O intensive applications, you need to configure all server subsystems: processors (SMT), memory (interleaving, for example), applications (number of writing / reading processes, queue, disk binding).
If the planned load does not require large calculations, but is intensive in I / O with a small block, it is still better to take POWER8 processors with the largest number of cores from the available line, that is 12.
The inclusion of additional software layers (such as Device Mapper) on the NVMe I / O stack can significantly reduce peak performance.
On a large block (> = 64KB), linking the IO load to the NUMA localities (processors) to which the disks are connected, reduces the response time from the disks and speeds up I / O. The reason is that at such a load, the width of the bus from the processor to the disks is important.
On a small block (~ 4KB), everything is less clear. When binding the load to the locality, there is a risk of uneven loading of processors. That is, you can simply reload the socket to which the disks are connected and the load is bound.
In any case, when organizing I / O, especially asynchronous, it is better to spread the load across different kernels using NUMA utilities on Linux.
Using SMT8 greatly improves performance with a large number of writing / reading processes.
Historically, the I / O subsystem is slow. With the advent of the flash, it became fast, and with the advent of NVMe it was very fast. Traditional discs have mechanics. It makes the spindle the slowest element in the computing complex. What follows from this?
Test Methodology and Load
I'll start from afar. Up to 4 processors (up to 48 POWER8 cores) and a lot of memory (up to 8 TB) can be delivered to our server. This opens up many possibilities for applications, but the large amount of data in RAM entails the need to store them somewhere. Data must be quickly removed from the disks and also crammed back quickly. In the near future, we are waiting for a wonderful world of disaggregated non-volatile and shared memory. In this beautiful future, perhaps there will be no need for a backing store at all. The processor will copy bytes directly from the internal registers to non-volatile memory with an access time like DRAM (tens of ns) and the memory hierarchy will be reduced by one floor. This is all later, now all the data is usually stored on a block disk subsystem.
We decide on the initial conditions for testing:
The server has a relatively large number of processing cores. It is convenient to use for parallel processing of a large amount of data. That is, one of the priorities is a large bandwidth of the I / O subsystem with a large number of parallel processes. As a result, it is logical to use the microbenchmark and configure a lot of parallel threads.
In addition, the input / output subsystem is built on NVMe disks, which can handle many requests in parallel. Accordingly, we can expect performance gains from asynchronous I / O. In other words, the high throughput in parallel processing is interesting. This is more appropriate for the purpose of the server. Performance on single-threaded applications, and achieving minimum response time, although it is one of the goals of future tuning, is not considered in this test.
The benchmarks of individual NVMe disks are full on the network, it is not worthwhile to produce extra ones. In this article, I consider the disk subsystem as a whole, so we will mainly load disks in groups. As the load, we will use 100% random read and write with a block of different sizes.
What metrics to watch?
On a small 4KB block, we will look at IOPS (the number of operations per second) and, secondly, latency (response time). On the one hand, the focus on IOPS is a legacy from hard drives, where random access by a small block brought the greatest delays. In today's world, all-flash systems are capable of delivering millions of IOPS, often more than software can use. Now “IOPS-intensive workloads” are valuable in that they show a balanced system in terms of computing resources and bottlenecks in the software stack.
On the other hand, for some tasks, it is not the number of operations per second that matters, but the maximum throughput on a large block of ≥64KB. For example, when dumping data from memory to disks (database snapshot) or loading a database into memory for in-memory computing, warming up the cache. For a server with 8 terabytes of memory, the throughput of the disk subsystem is of particular importance. On a large block, we will look at the bandwidth, that is, megabytes per second.
Integrated disk subsystem
The server disk subsystem can include up to 24 NVMe standard disks. The disks are evenly distributed across four processors using two PCI Express switches PMC 8535. Each switch is logically divided into three virtual switches: one x16 and two x8. Thus, PCIe x16, or up to 16 GB / s, is available for each processor. Each processor has 6 NVMe drives connected. In total, we expect bandwidth up to 60 GB / s from all drives.
For tests, I have access to a server instance with 4 processors (8 cores per processor, maximum 12 cores). Disks are connected to two out of four sockets. That is, it is half of the maximum configuration of the disk subsystem. On the backplane with PCI Express switches of the first revision, two Oculink connectors turned out to be faulty, and therefore only half of the disks are available. In the second revision, this was already fixed, but here I was able to put only half of the disks, namely the following configuration was obtained:
- 4 × Toshiba PX04PMB160
- 4 × Micron MTFDHAL2T4MCF-1AN1ZABYY
- 3 × INTEL SSDPE2MD800G4
- 1 × SAMSUNG MZQLW960HMJP-00003
The variety of disks is due to the fact that we are simultaneously testing them to form an assortment of standard components (disks, memory, etc.) from 2-3 manufacturers.
Minimum configuration load
To begin, we will perform a simple test in the minimum configuration - one disk (Micron MTFDHAL2T4MCF-1AN1ZABYY), one POWER8 processor and one fio stream with queue = 16.
[global]
ioengine=libaio
direct=1
group_reporting=1
bs=4k
iodepth=16
rw=randread
[ /dev/nvme1n1 P60713012839 MTFDHAL2T4MCF-1AN1ZABYY]
stonewall
numjobs=1
filename=/dev/nvme1n1
It turned out like this:
# numactl --physcpubind=0 ../fio/fio workload.fio
 /dev/nvme1n1 P60713012839 MTFDHAL2T4MCF-1AN1ZABYY: (g=0): rw=randread, bs=(R) 4096B-4096B, (W) 4096B-4096B, (T) 4096B-4096B, ioengine=libaio, iodepth=16
fio-2.21-89-gb034
time   3233 cycles_start=1115105806326
Starting 1 process
Jobs: 1 (f=1): [r(1)][13.7%][r=519MiB/s,w=0KiB/s][r=133k,w=0 IOPS][eta 08m:38s]
fio: terminating on signal 2
Jobs: 1 (f=0): [f(1)][100.0%][r=513MiB/s,w=0KiB/s][r=131k,w=0 IOPS][eta 00m:00s]
 /dev/nvme1n1 P60713012839 MTFDHAL2T4MCF-1AN1ZABYY: (groupid=0, jobs=1): err= 0: pid=3235: Fri Jul 7 13:36:21 2017
  read: IOPS=133k, BW=519MiB/s (544MB/s)(41.9GiB/82708msec)
  slat (nsec): min=2070, max=124385, avg=2801.77, stdev=916.90
  clat (usec): min=9, max=921, avg=116.28, stdev=15.85
   lat (usec): min=13, max=924, avg=119.38, stdev=15.85
 ………...
 cpu     : usr=20.92%, sys=52.63%, ctx=2979188, majf=0, minf=14
What do we see here? Received 133K IOPS with a response time of 119 μs. Note that the processor load is 73%. It's a lot. What is the processor busy with?
We use asynchronous I / O, and this simplifies the analysis of the results. fio separately considers slat (submission latency) and clat (completion latency). The first includes the execution time of the read system call before returning to user space. That is, all kernel overheads before the request leaves the hardware are shown separately.
In our case, slat is only 2.8 microseconds per request, but taking into account the repetition of this 133,000 times per second, a lot is obtained: 2.8 microseconds * 133,000 = 372 ms. That is, 37.2% of the time the processor spends only on IO submission. And there is also the code for fio itself, interrupts, the operation of the asynchronous input-output driver.
The total processor load is 73%. It seems that the kernel will not pull another fio, but let's try:
Starting 2 processes
Jobs: 2 (f=2): [r(2)][100.0%][r=733MiB/s,w=0KiB/s][r=188k,w=0 IOPS][eta 00m:00s]
/dev/nvme1n1 P60713012839 MTFDHAL2T4MCF-1AN1ZABYY: (g=0): rw=randread, bs=(R)
 pid=3391: Sun Jul 9 13:14:02 2017
  read: IOPS=188k, BW=733MiB/s (769MB/s)(430GiB/600001msec)
  slat (usec): min=2, max=963, avg= 3.23, stdev= 1.82
  clat (nsec): min=543, max=4446.1k, avg=165831.65, stdev=24645.35
   lat (usec): min=13, max=4465, avg=169.37, stdev=24.65
…………
 cpu     : usr=13.71%, sys=36.23%, ctx=7072266, majf=0, minf=72
With two threads, the speed grew from 133k to 180k, but the kernel is overloaded. By top, CPU utilization is 100% and clat has grown. That is, 188k is the limit for one core at this load. At the same time, it is easy to see that the growth of clat is caused precisely by the processor, and not by the disk. Let's see 'biotop' ():
PID  COMM       D MAJ MIN DISK    I/O Kbytes AVGus
3553  fio       R 259 1  nvme0n1 633385 2533540 109.25
3554  fio       R 259 1  nvme0n1 630130 2520520 109.25
Due to the included tracing, the speed dipped somewhat, but the response time from the disks is ~ 109 μs, the same as in the previous test. Other measurements (sar -d) show the same numbers.
For the sake of curiosity, it is interesting to see what the processor is busy with:
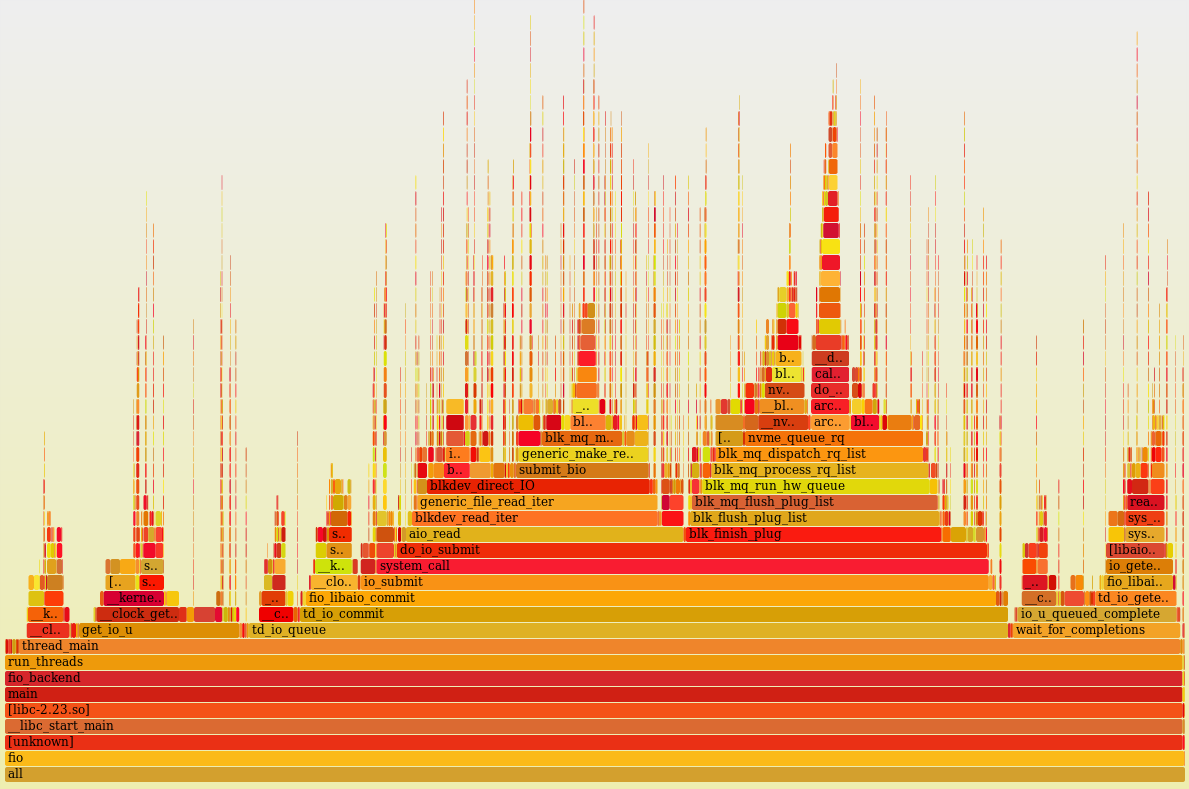
Single core load profile (perf + flame graph) with multithreading disabled and two fio processes running. As you can see, he does something 100% of the time (idle = 0%).
Visually, the processor time is more or less evenly distributed between a large number of user (fio code itself) and kernel functions (asynchronous I / O, block level, driver, many small peaks - these are interruptions). One function is not visible where an abnormally large amount of processor time would be spent. It looks good and, when viewing the stacks, it doesn’t come up with any ideas what could be twisted here.
The Impact of POWER8 Multithreading on I / O Speed
So, we found out that with an active load on IO, the processor is easy to overload. The processor utilization figure indicates that it is busy for the operating system, but does not say anything about loading the processor nodes. Including, the processor may seem busy while waiting for external components, such as memory. Here we do not have a goal to find out the processor efficiency, but to understand the tuning potential, it is interesting to look at the “CPU counters”, partially accessible through 'perf'.
root@vesninl:~# perf stat -C 0
Performance counter stats for 'CPU(s) 0':
    2393.117988   cpu-clock (msec)     #  1.000 CPUs utilized
       7,518   context-switches     #  0.003 M/sec
         0   cpu-migrations      #  0.000 K/sec
         0   page-faults        #  0.000 K/sec
   9,248,790,673   cycles          #  3.865 GHz           (66.57%)
    401,873,580   stalled-cycles-frontend  #  4.35% frontend cycles idle   (49.90%)
   4,639,391,312   stalled-cycles-backend  #  50.16% backend cycles idle   (50.07%)
   6,741,772,234   instructions       #  0.73 insn per cycle
                         #  0.69 stalled cycles per insn (66.78%)
   1,242,533,904   branches         # 519.211 M/sec          (50.10%)
    19,620,628   branch-misses       #  1.58% of all branches     (49.93%)
    2.393230155 seconds time elapsed
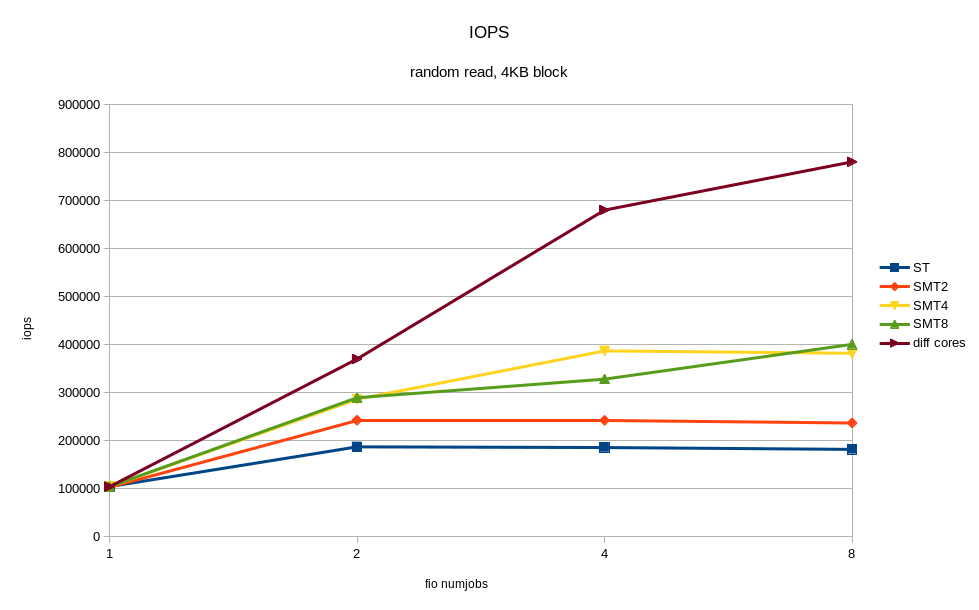
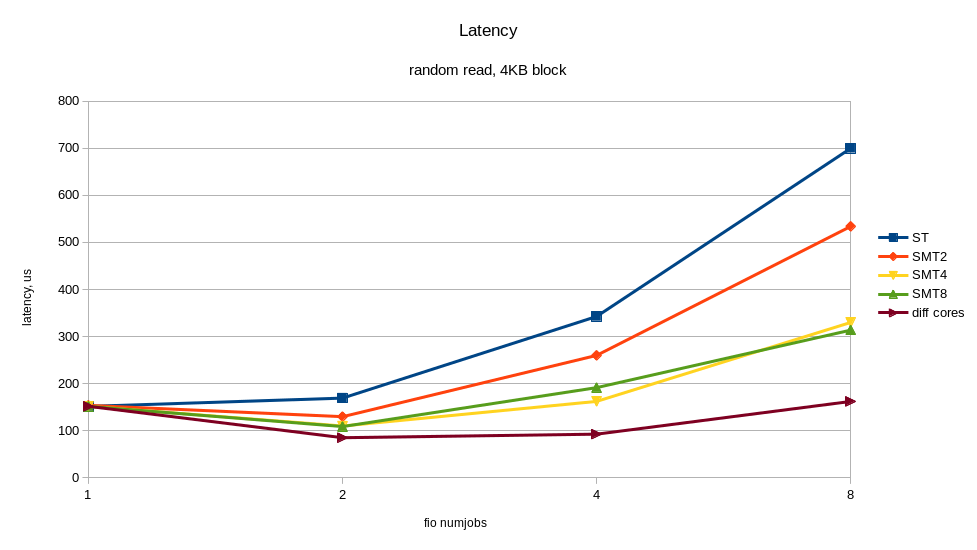
The output above shows that IPC (insn per cycle) 0.73 is not so bad, but theoretically on Power8 it can be up to 8. In addition, 50% of the “backend cycles idle” (PM_CMPLU_STALL metric) can mean a memory wait. That is, the processor is busy for the Linux scheduler, but the resources of the processor itself are not particularly busy. It is quite possible to expect a performance gain from the inclusion of multithreading (SMT), with an increase in the number of threads. The result of what happened when you turned on SMT is shown in the graphs. I received a noticeable speed increase from additional fio processes running on other threads of the same processor. For comparison, the case where all threads work on different cores (diff cores) is given.
The graphs show that the inclusion of SMT8 gives an almost twofold increase in speed and a decrease in response time. It’s not bad, and with one core we shoot> 400K IOPS! Along the way, we see that one core, even with SMT8 turned on, is not enough to fully load an NVMe disk. Scattering fio streams across different cores, we get almost twice the best disk performance - this is what modern NVMe can do.
Thus, if the application architecture allows you to adjust the number of writing / reading processes, it is better to adjust their number to the number of physical / logical cores, in order to avoid slowdowns from overloaded processors. One NVMe drive can easily overload the processor core. The inclusion of SMT4 and SMT8 gives a multiple increase in productivity and can be useful for loads with intensive I / O.
The influence of NUMA architecture
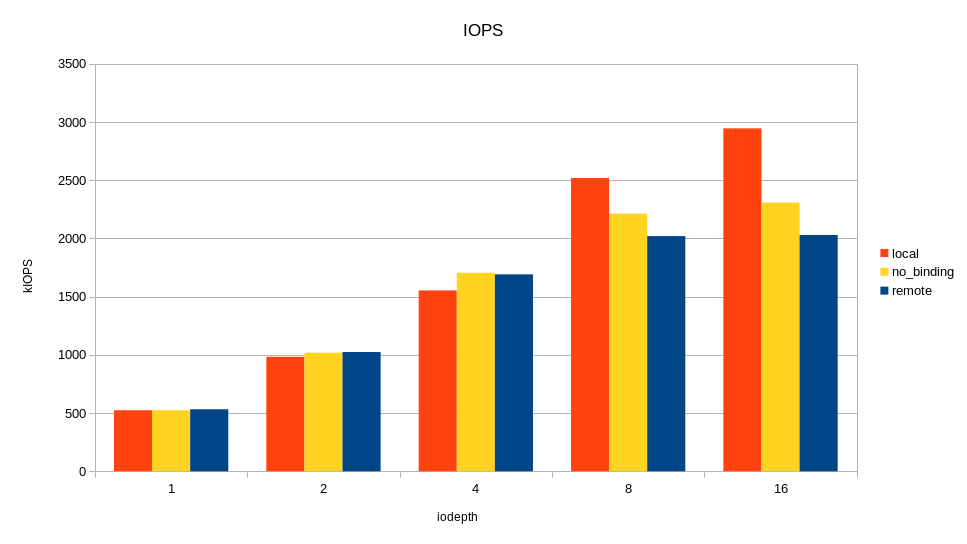
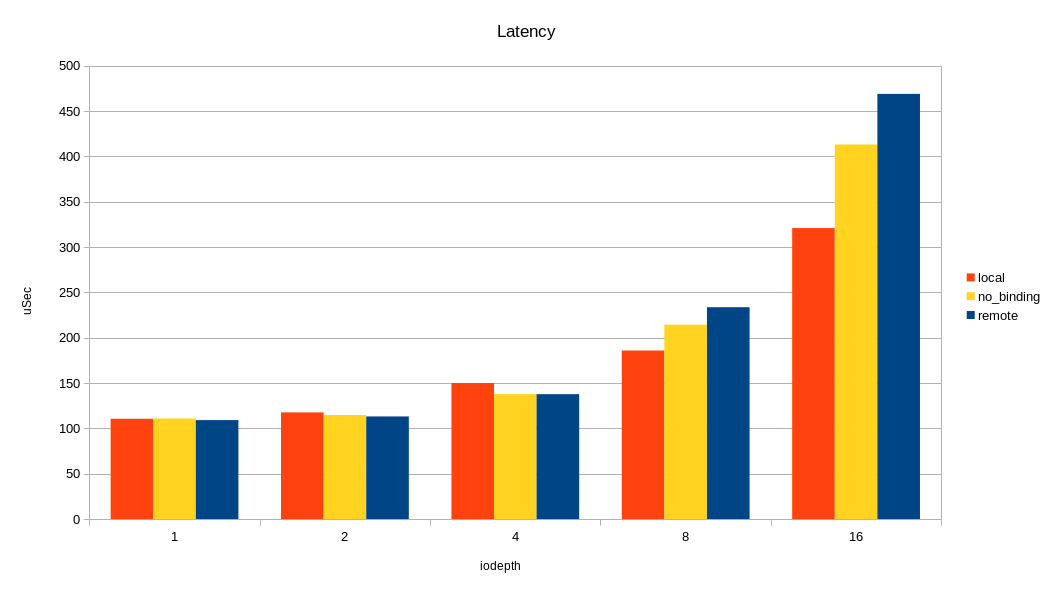
For load balancing, 24 internal NVMe server disks are evenly connected to four processor sockets. Accordingly, for each disk there is a “native” socket (NUMA locality) and “remote”. If the application accesses disks from a “remote” socket, then the overhead from the influence of the interprocessor bus is possible. We decided to see how access from a remote socket affects the final performance of the drives. For the test, run fio again and use numactl to bind fio processes to one socket. First to the "native" socket, then to the "remote". The purpose of the test is to understand whether it is worth the effort to configure NUMA, and what effect can be expected? On the graph, I compared only one remote socket out of three due to the lack of difference between them.
Fio configuration:
- 60 processes (numjobs). The number is taken from the hardware configuration. In our test sample, processors with 8 cores are installed and SMT8 is enabled. From an operating system point of view, 64 processes can be performed on each socket. That is, I brazenly drove the load to the hardware capabilities.
- block size - 4kb
- load type - random read 100%
- load object - 6 disks connected to socket 0.
Changing the queue, I watched the bandwidth and response time, starting the load in the local socket, remote, and without binding to the socket at all.
As can be seen in the graphs, the difference between the local and remote socket is and is very noticeable at high load. Overhead occurs at queue 16 (iodepth = 16)> 2M IOPS with a 4K block (> 8 GB / s, simply put). One could conclude that NUMA is worth focusing only on tasks where a large I / O bandwidth is needed. But not everything is so simple, in a real application, besides I / O, there will be traffic on the interprocessor bus when accessing memory in a remote NUMA locality. As a result, a slowdown can occur with less I / O traffic.
Performance under maximum load
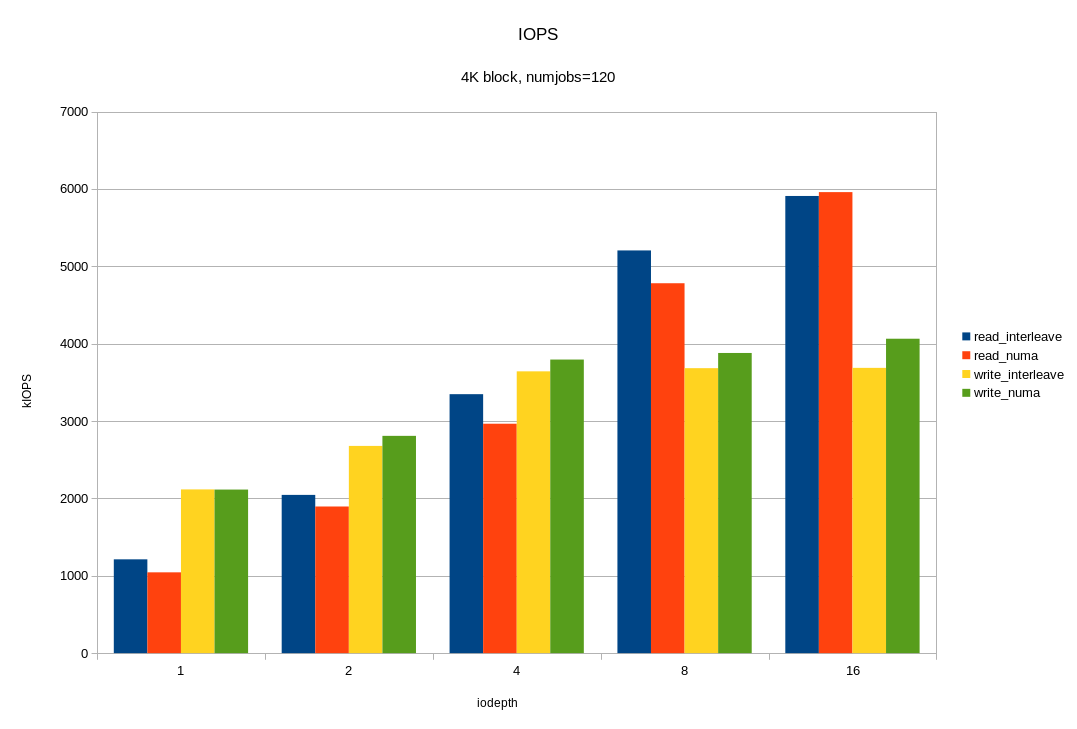
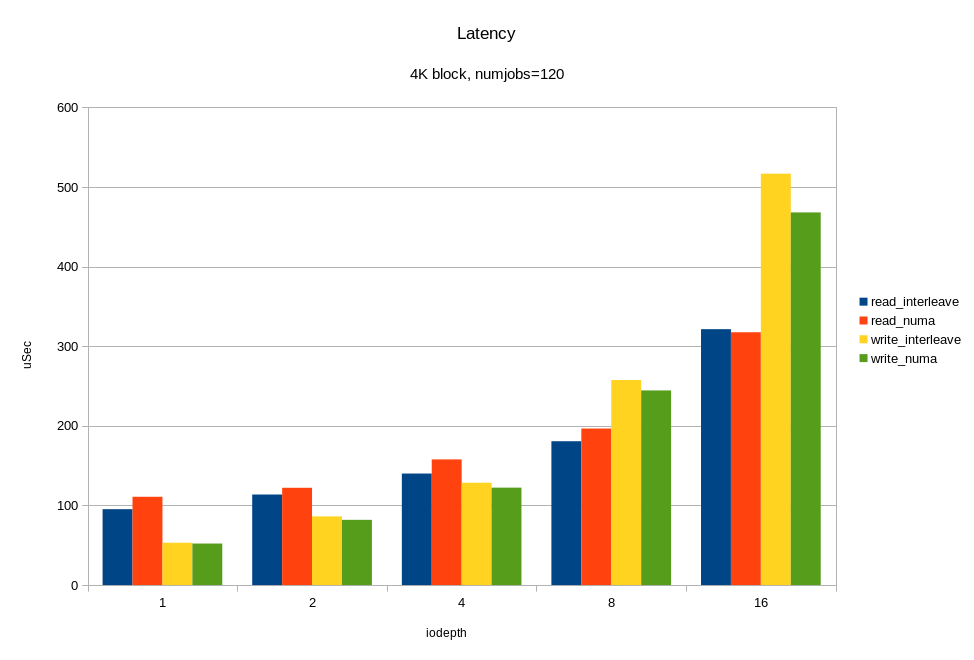
And now, the most interesting. We load all 12 available disks at the same time. Moreover, taking into account previous experiments, we will do this in two ways:
- the kernel chooses on which socket to run fio without taking into account the physical connection;
- fio only works on the socket to which the drives are connected.
We look at what happened:
For random read operations with a 4KB block, we got ~ 6M IOPS with a response time of <330 μs. For the 64KB block, we got 26.2 GB / s. Probably we rest on the x16 bus between the processor and the PCIe switch. Let me remind you that this is half the hardware configuration! Again, we see that under heavy load, linking I / O to the "home" locality gives a good effect.
LVM overhead
Giving disks to the entire application is usually inconvenient. An application may either have too few single disks or too many. Often you want to isolate application components from each other through different file systems. On the other hand, I want to evenly balance the load between the I / O channels. LVM comes to the rescue. Disks are organized into disk groups and distribute space between applications through logical volumes. In the case of conventional spindles, or even disk arrays, the LVM overhead is relatively small compared to disk latency. In the case of NVMe, the response time from disks and the overhead of the software stack are digits of the same order. interesting to see them separately.
I created an LVM group with the same drives as in the previous test, and loaded the LVM volume with the same number of reading threads. As a result, I received only 1M IOPS and 100% processor utilization. With perf, I did a processor profiling, and this is what happened:
On Linux LVM uses Device Mapper, and obviously the system spends a lot of time counting and updating disk statistics in the generic_start_io_acct () function. I did not find how to disable statistics collection in Device Mapper, (in dm_make_request ()). There is probably potential for optimization. In general, at the moment, the use of Device Mapper can adversely affect performance under heavy IOPS load.
Polling
Polling is a new Linux input / output driver driver mechanism for very fast devices. This is a new feature, and I will mention it only to say why it is not tested in this review. The novelty of the feature is that the process is not removed from execution while waiting for a response from the disk subsystem. Context switching is usually performed while waiting for I / O and is expensive in itself. The overhead of context switching is estimated in units of microseconds (the Linux kernel needs to remove one process from execution, calculate the most worthy candidate for execution, etc., etc.) Interruptions during polling can be saved (only context switching is removed) or completely eliminated . This method is justified for a number of conditions:
- Greater productivity is required for a single-threaded task;
- the main priority is the minimum response time;
- Direct IO is used (no file system caching);
- for an application, the processor is not a bottleneck.
The reverse side of polling is an increase in processor load.
In the current Linux kernel (now 4.10 for me), polling is turned on by default for all NVMe devices, but it works only for cases when the application specifically asks it to be used for individual "especially important" I / O requests. The application should set the flag RWF_HIPRI in the system calls preadv2 () / pwritev2 ().
/* flags for preadv2/pwritev2: */
#define RWF_HIPRI            0x00000001 /* high priority request, poll if possible */
Since single-threaded applications are not related to the main topic of the article, polling is postponed for the next time.
Conclusion
Although we have a test sample with half the configuration of the disk subsystem, the results are impressive: almost 6M IOPS with 4KB and> 26 GB / s for 64KB. For the built-in disk subsystem of the server, this looks more than convincing. The system looks balanced in terms of the number of cores, the number of NVMe disks per core, and the width of the PCIe bus. Even with terabytes of memory, the entire volume can be read from disks in minutes.
Linux NVMe stack is lightweight, the processor is overloaded only with heavy load fio> 400K IOPS, (4KB, read, SMT8).
An NVMe drive is fast on its own, and getting it saturated with the application is quite difficult. There is no longer a problem with slow disks, but there may be a problem with the limitations of the PCIe bus and the I / O software stack, and sometimes kernel resources. During the test, we practically did not rest against the disks. Intensive I / O is very stressful for all server subsystems (memory and processor). Thus, for I / O intensive applications, you need to configure all server subsystems: processors (SMT), memory (interleaving, for example), applications (number of writing / reading processes, queue, disk binding).
If the planned load does not require large calculations, but is intensive in I / O with a small block, it is still better to take POWER8 processors with the largest number of cores from the available line, that is 12.
The inclusion of additional software layers (such as Device Mapper) on the NVMe I / O stack can significantly reduce peak performance.
On a large block (> = 64KB), linking the IO load to the NUMA localities (processors) to which the disks are connected, reduces the response time from the disks and speeds up I / O. The reason is that at such a load, the width of the bus from the processor to the disks is important.
On a small block (~ 4KB), everything is less clear. When binding the load to the locality, there is a risk of uneven loading of processors. That is, you can simply reload the socket to which the disks are connected and the load is bound.
In any case, when organizing I / O, especially asynchronous, it is better to spread the load across different kernels using NUMA utilities on Linux.
Using SMT8 greatly improves performance with a large number of writing / reading processes.
Final thoughts on the topic.
Historically, the I / O subsystem is slow. With the advent of the flash, it became fast, and with the advent of NVMe it was very fast. Traditional discs have mechanics. It makes the spindle the slowest element in the computing complex. What follows from this?
- First, the speed of disks is measured in milliseconds, and they are many times slower than all other elements of the server. As a result, the chance to run into the speed of the bus and the disk controller is relatively low. It is much more likely that the problem will occur with spindles. It happens that one disk is loaded more than the others, the response time from it is slightly higher, and this slows down the entire system. With NVMe, disk throughput is huge, the bottleneck is shifting.
- Secondly, to minimize delays from disks, the disk controller and the operating system use optimization algorithms, including caching, delayed write, read ahead. This consumes computing resources and complicates setup. When drives are fast right away, there is no need for a lot of optimization. Rather, her goals are changing. Instead of reducing expectations inside the disk, it becomes more important to reduce the delay to the disk and bring the block of data from memory to the disk as quickly as possible. The Linux NVMe stack does not need to be configured and immediately works quickly.
- And thirdly, the fun part about the work of performance consultants. In the past, when the system slowed down, it was easy and pleasant to search for the cause. Swear at the storage system and most likely you will not be mistaken. Database consultants love this business and know how. In a system with traditional disks, you can always find some kind of storage performance problem and puzzle the vendor, even if the database slows down due to something else. With fast disks, bottlenecks will increasingly shift to other resources, including the application. Life will be more interesting.