Icinga2 is an easy option
For some reason, surprisingly little is written about icinga2, and the fact that they write somehow does not create a general concept. In one place they write how to write a script, in another how to install this whole thing, and what to do about it later is not clear.
I myself have been using icinga somewhere since the beginning of 2013, then there was only the first version and it didn’t go very far from Nagios. With the release of the second version, a lot has changed and the choice is obvious to me.
Next, I want to tell you how to quickly install all this and, more interestingly, what to do next.
A little description
Icinga2 is needed to monitor the status of servers, services, printers, routers and everything else where there is Linux or Windows or even where not.
If the first version worked on the kernel from Nagios, then in the second version everything was done in a new way so that it was fast and beautiful. To do this, the icinga team had to rewrite the kernel and now, without much effort, you can do either a distributed system or the same thing, but add a cluster to this.
But this is done for large networks (over 10k in one segment). When the second version was just released, I read that on their tests one server could handle up to 10k hits per second, I do not keep as many servers, so I can’t confirm.
The beginning and a little theory
In 2013, we at our company decided to make a monitoring system and install it from our customers, taking money from them for services in case of any problems with their systems, the question arose as to how to get to their systems.
Icinga has two ways to check the status of systems - either actively access the servers by knocking on some port, or open a port in itself and wait for something to arrive there. Accordingly, this is called active and passive methods. In most cases, the active method is used, although I do not understand why. Also on the Internet there is mainly a description of an active survey.
Active mode
There are several options here, you can use icinga2 director and a client for windows or Linux. After installing them, you need to write configs or templates for icinga2. In this case, icinga2 contacts the server and performs a check through the client or somehow an arbitrary script. Previously, NRPE was used for this , as it happens now I do not know.
The active method has two big minuses, which actually decided everything:
1. It is necessary to open the ports on the server side, and if it is a different network, then configure port forwarding, and each server has its own.
2. The setup for each system is more complicated than in the passive version, since you have to prescribe teams for each case or use ready-made templates, which of course must be done before.
Passive mode
In this case, open port 5667 for NSCA on the icinga2 side of the server or turn on Icinga2 APi (port 5665) and just wait until we get the status of a system, icinga looks when the status was last updated and if some status is not updated a certain time, icinga marks it as unknown. And of course, somewhere without a fly in the ointment - if you need to check the router or printer or somewhere to poll SNMP, then with passive polls this can not be done. But here you can write a crutch, one of the servers in the same network can query via SNMP and send status to icinga, but for this you need to write a script.
NSCA is a somewhat outdated solution, but for Windows systems, there is no good alternative (so that you don’t have to do a lot of hands). In Linux, I already wrote a number of scripts and they turn to Icinga2 Api. More recently, I also wrote a library for node.js (link below).
Installation ()
As already understood above, I want to install Icinga2 and configure it in passive mode.
For Icinga2 I made a container (docker).
What's in the container:
1. Icinga Web 2 - a web interface where you can view status
2. Graphite - to display beautiful graphs
3. Icinga2 Classic UI - also gui, but from the first version, so that you can use old programs like Nagstamon (for windows ) or adagios (for android)
4. = Integration with AD, but it turned out that we did not need it, so I have not tested it for a long time, it may turn out that it does not work.
5. NSCA Server - needed to accept metrics from Windows or from those who use nsca
6.Icinga2 API - api from icinga. You can do everything - set status, add / remove hosts and services, etc.
For those who have never used the docker, I show how to install all this on ubuntu (04.16). First we set docker well and for convenience you can also docker-compose.
sudo apt install docker.io docker-compose -yThen we start the container with Icinga2 without Active Directory:
sudo docker run -i -p 80:80 -p 5667:5667 -p 5665:5665 -p 8080:8080 -h monitoring.example.com \
-v /storage/icingaweb2:/icingaweb2 -v /storage/icinga2:/icinga2conf -v /storage/mysql:/mysql \
-v /storage/graphite:/var/lib/graphite/whisper \
-e NOTIFICATION_INTERVAL=0 -e GRAPHITE_HOST=192.168.42.64:8080 \
-e APIUSER=root -e APIPASS=PASS -e ICINGA_PASS="icinga" \
-e MAILSERVER="mail.example.com" -e EMAILADDR="[email protected]" -e NSCAPASS="pass" -e NSCAPORT="5667" \
--name icinga2 -t adito/icinga2
In the description on hub.docker.com there is an option to start from AD, you can see here .
A little description for variables and the rest.
Ports:
80 - this is understandable, you can see everything here
5667 - NSCA port, maybe not everyone needs it
5665 - Icinga2 API
8080 - The graphite page should be open, since icinga2 accesses it to draw graphs
Variables:
“-h” - host name, then displayed on the page
“-v / storage ...” - configs are stored and db
“GRAPHITE_HOST” - this is the ip server where the container works, through this address icinga2 refers to graphite
“APIUSER” - it is clear and true. It is advisable to exchange for something like “0ilkasjdf09123malskdf”
“APIPASS” - this is also clear
“ICINGA_PASS” - password for the user “icingaadmin”
“MAILSERVER” - the host where you have the mail server, I have exchange on the same network, so it just works like relay
“EMAILADDR” - the address that icinga2 uses.
“NSCAPASS” and “NSCAPORT” I think it’s clear.
After that, you have a working monitoring server that monitors itself. You can come in to see what is there and how.
Available at GRAPHITE_HOST: 80
There is also an old version on GRAPHITE_HOST / icinga2-classicui. This version can be used to connect for example anag and watch the status through the phone. Or is there still nagstamonthis is for a computer, it seems that it can already be accessed through the Icinga2 API, there is an option, but I did not look much.
I say right away that it is better to use them than to watch emails, because there will be a lot of them, or all this must be very finely tuned.
If someone is not willing to work with the container, then you can take the installation script (icinga2.sh needs) from the git repository and run it, it should also work, only you need to fix the passwords, for something more reliable.
Now you need to add two templates to the container, one for the host and one for services. They need to be put in the / storage / icinga2 folder that we set when the container started.
The host - passive-host.conf - can be called whatever you want, but should end in .conf
template Host "passive-host" {
    max_check_attempts = 2
    check_interval          = 300s
    retry_interval          = 200s
    enable_active_checks = true
    enable_passive_checks = true
    check_command = "passive"
    vars.notification["mail"] = {
    groups = [ "icingaadmins" ]
    }
}
Service:
template Service "passive-service" {
    max_check_attempts = 2
    check_interval = 300s
    retry_interval = 200s
    enable_active_checks = true
    check_command = "passive"
    vars.notification["mail"] = {
    groups = [ "icingaadmins" ]
    }
}
A small description of the templates
Wait until the status comes two times, if both show an error, then the status changes to an error.
enable_active_checks = true is needed, in case of non-receipt of status from the server, change it to "unknown".
If twice the wrong result, then sends an email. By the way, from experience I can say that letters are poured without interruption and a lot, especially at the beginning and it is also not always clear on them which service has already worked again and which is not. Therefore, I advise you to use nagstamon or always look at the page.
I remember earlier some letters were sent immediately to OTRS, which created the ticket, it was also convenient and the client immediately saw everything.
These two files must be placed in the “/ storage / icinga2” folder and restart the container, or icinga service in it.
sudo docker exec -it icinga2 service icinga2 restartThat's it, templates are added, now you can add systems and everything you need.
What's next?
In principle, there was nothing new before that, now I will show why the passive option is better.
Showing
For windows
For Windows there is a ready clint - nsclient ++ . It can work in both versions (passive and active) while passive it sends data via NSCA, in the Icinga2 container this service is active and can be used, it must be accessed through port 5667. For windows, this is a good option, since everything is already ready, you can check the status of services, watch eventlogs, and things like disk, processor or memory. Also, if you wish, you can execute arbitrary scripts (you must first write them. For example, I wrote for lsi raid) whose output can be sent via nsca.
I already wrote above that we wanted to install icinga on clients, but writing configs for nsclient ++ is quite tedious and they need to be written for each server, and besides, icinga also needs to write configs.
I simplified all this and wrote a small program (then I could only AutoIt), which can generate these two files for the host and icinga. The program is HERE (you can download in releases), called “Agen” (Alerts Generator).
After unpacking, you need to tweak config.xml
2 monitoring.server.local NSCAPASS passive-host passive-service HOSTGROUP SERVICEGROUP interval - time of verification in minutes
address - dns or ip icinga of the server
password - NSCA password (which was written above when creating the container)
htemplate - name of the template for the host (it was already higher)
stemplate - name of the template for
hgroup services - group of hosts, for example you want to share them. For example, Hosting, DataCenter2, etc., or for different clients, as was the case in my case. By the way, you can then bind the user to one
sgroup - the same as above, only for services.
Now you can run Agen and select the folder where source.txt and config.xml are located. It looks like this:
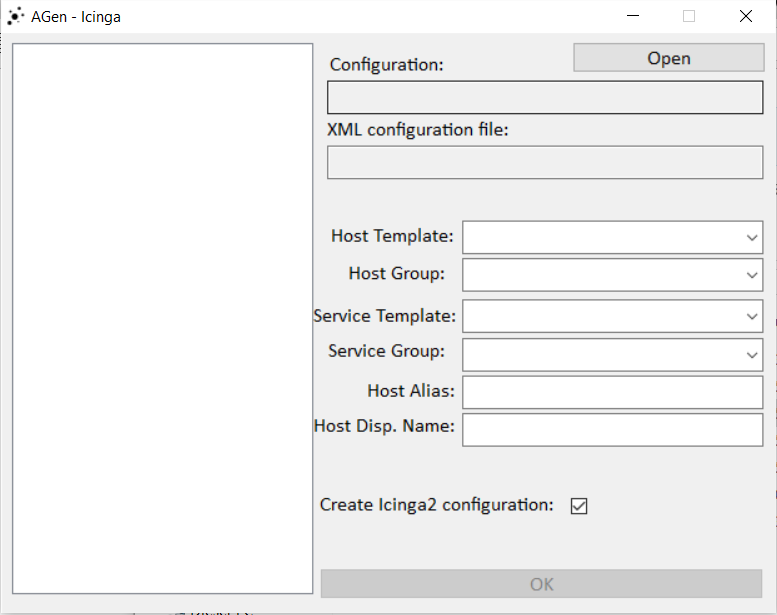
Part of the information is taken from congig.xml, you just need to add “Host Alias” and “Host Display Name” (will be displayed on the page).
The information on the left is taken from source.txt. How to use:
On the left, choose what works for you on this server. For example, select “winExchange2013” and “eveExchange2013”, write Host Alias (without spaces) and Host Display Name (possible with spaces), if you need icinga configuration for this, check the box. After these manipulations, two files will appear:
hostalias.conf - you need to copy it to the container (/ storage / icinga2) and restart icinga
nsclient.ini - copy to the folder where nsclient ++
is installed What is in source.txt. Actually, the whole Agen revolves around this file, everything is divided into two parts:
“win” - windows services
“eve” - events from eventlog
That is, if you select “winExchange2013”, then all services that are related to Exchange 2013 will be added to the configs and will be monitored. If you also choose “EveID Exchange 2013”, then events from the eventlog will be added to this.
That is, after you have done this and pressed ok, you will have two files “nsclient.ini” and “SERVER.conf”. After that, put nsclient.ini in the folder where nsclient ++ is installed, and add SERVER.conf to the container (as in the case of passive-host.conf and passive-service.conf). And after that, you need to restart everything - restart the “nsca” service, just restart the icinga2 service.
The only time services in source.txt are called in German, so they will need to be renamed.
Example:
MSExchangeADTopology: Windows_Dienst_Ex_AD_Topology
MSExchangeADTopology is the same part everywhere, regardless of the system language, but the second part is different everywhere.
Actually about vidnovs is all.
Linux
Here, everything is somewhat more complicated, since there is no client similar to nsclient ++. There are three ways, you can set send_nsca, then write a script and send status through send_nsca, scripts will be executed every two minutes on the crown.
The second way is to send the same data via icinga2 api. For example, I use the second option, for this I use node.js and I made a module for it, it lies on npmjs.com.
The third way is to use ready-made scripts and still set up active polls. But here I will not tell you, because I try to avoid this all the same.
Despite the fact that in my work I use almost exclusively Linux, I practically do not have to write scripts for Linux, since everything works through the docker for us.
For docker, I also made a container that can see (via docker.sock) how many containers are on the host. It can also create a host for each container in icinga2 and then monitor it. That is, dynamic monitoring is obtained. If the container is removed from the host docker, then it is also removed from monitoring.
Conclusion
In principle, everything has been said above, I can only add that if someone decides what to use, he can try it. The docker container greatly simplifies the installation process and is very well suited to try.
Icinga2 itself is pretty easy to set up and after a while everything becomes clear. For myself, I did several few things (which I described above) to simplify the use. Also for those who can use nodejs, they can write scripts for themselves, the link below has a library for this.
I especially do not like to delve into the technical parts, everything is trivially googled and located.
Links:
1. Icinga2 Docker - a container with the image icinga2 2.6
1a. Gith repositoryif someone needs only icinga2 installation scripts.
2. Agen - configuration generator for nsclient ++
3. Nsclient ++ - client for windows
4. dockerhost-monitoring - a container to monitor the status of all containers on a separate docker host.
5. Docker Container NSCA monitoring - old version of container monitoring (via nsca)
6. Icinga2 API nodejs - module / library for nodejs
7. aditosnmp - example snmp poll. Here is just the moment when you have to poll the status via snmp, and then send the status. You have to watch "app.js"
And a little off topic, a container for backup containers and not only nodebackup . It’s a pity that I poured it on a github, and not who does not know.