Machine War: PVS-Studio vs TensorFlow

“I'll be back” ©. I think everyone knows this phrase. And although today we will not talk about the return of the terminator, the topic of the article is somewhat similar. Today we’ll talk about checking the TensorFlow machine learning library and try to find out if we can sleep peacefully, or the Skynet hour is close ...
Tensorflow
TensorFlow — это библиотека машинного обучения, разрабатываемая корпорацией Google, и доступная как open-source проект с 9 ноября 2015 года. В данный момент она используется в научно-исследовательской работе и в десятках коммерческих продуктов Google, в том числе в Google Search, Gmail, Photos, YouTube, Translate, Assistant и пр. Исходный код проекта доступен в репозитории на GitHub, а также на сайте открытых проектов Google.

Почему выбор пал на этот проект?
- Google. Если проект разрабатывается Google, Microsoft или другими именитыми разработчиками, то его проверка и обнаружение ошибок – это, своего рода, вызов. К тому же, думаю, многим людям интересно, как ошибаются (или не ошибаются) разработчики из именитых корпораций.
- Machine learning. Recently, this topic is gaining more and more popularity. And not in vain, some of the results are really impressive! I don’t give examples, if you wish, you can easily find them yourself.
- Statistics on GitHub. Also an important criterion, because the more popular the project, the better. So, TensorFlow breaks all conceivable and unimaginable records! He is in the top of C ++ projects, has more than 50,000 stars and over 20,000 forks. Unbelievable!
Of course, one cannot pass by such a project. I don’t even know why my colleagues did not check it before. Well, fix it.
And what did they check?
If you know what PVS-Studio is, then you also know the answer to this question. But do not rush to read further, if you don’t know everything about our analyzer? For example, we have had a C # analyzer for more than a year, and about half a year is a version for Linux .

For those who are completely off topic. The source code analysis was carried out using the PVS-Studio static analyzer , which searches for errors in programs written in C, C ++ and C #. PVS-Studio runs on Windows and Linux, and currently it implements over 400 diagnostic rules, the description of which can be found on the corresponding page .
In addition to the development of the analyzer, we check open-source projects and write articles based on the results of the verification. At the moment, we checked more than 280 projects in which we found more than 10,800 errors . And these are not some ordinary projects, but rather well-known ones: Chromium , Clang , GCC , Roslyn, FreeBSD , Unreal Engine , Mono , etc.
PVS-Studio is available for download , so I advise you to try on your project and see what you can find interesting.
By the way, the PVS-Studio tag is on StackOverflow ( link ). I recommend asking questions there, so that in the future other developers can quickly find the information they need, without waiting for our answers by mail. We, in turn, are always happy to help our users.
Article format
This time I want to move away from the traditional sequence of checking: 'I downloaded the project → Checked → I wrote about the errors found' and tell in more detail about some analyzer settings, and how they can be useful. In particular, I will show how you can effectively deal with false positives, which can be useful for disabling diagnostics and excluding certain files from scanning or output. Well, of course, let's look at what PVS-Studio managed to find in the TensorFlow source code.
Analysis preparation
Now that PVS-Studio is also available under Linux , there is a choice where to check the project: under Linux or Windows. Most recently, I checked one project under openSUSE, it was quite simple and convenient, but I decided to check TensorFlow under Windows. So more familiar. In addition, it can be built using CMake, which implies further work in the Visual Studio development environment for which we have a plug-in (by the way, in its latest version, line highlighting with erroneous code appeared).
Officially, building TensorFlow for Windows is not supported ( according to the site ). However, there is also a link on how to build a project using CMake. And, I must say, it is easily assembled according to this instruction .
As a result, we get a set of .vcxproj files combined in .sln , which means that you can conveniently work with the project from under Visual Studio. And it pleases. I worked from under the Visual Studio 2017 IDE, support for which was added in the PVS-Studio 6.14 release .
Note. Before analysis, it would be nice to put together a project, make sure that everything is going well and that there are no errors. This is necessary in order to be sure that the analysis will pass qualitatively and the necessary syntactic and semantic information will be available to the analyzer. So, there is a note on the TensorFlow website: By default, building TensorFlow from sources consumes a lot of RAM.Well, it's okay, because I have 16Gb RAM on my machine. And what do you think? During the build, I got Fatal Error C1060 (compiler is out of heap space) error ! Not enough memory! It was very unexpected. And, no, I did not have 5 virtual machines running at the same time as the assembly. In fairness, I note that when building through bazel, you can limit the amount of RAM used (as described in the TensorFlow build instructions).
And now I’m eager to press the treasured button “Analyze solution with PVS-Studio” and see what interesting things can be found, but at first it would be nice to exclude from the analysis those files that are not interesting to us, for example, third-party libraries. This is done in the PVS-Studio settings quite simply: on the 'Don't Check Files' tab we set the masks of those files and paths that we are not interested in analyzing. A certain set of paths is already clogged in the settings (for example, / boost /). I supplemented it with two masks: / third_party / and / external /. This will allow not only to exclude warnings from the results window, but even not to analyze files in these directories, which positively affects the analysis time.
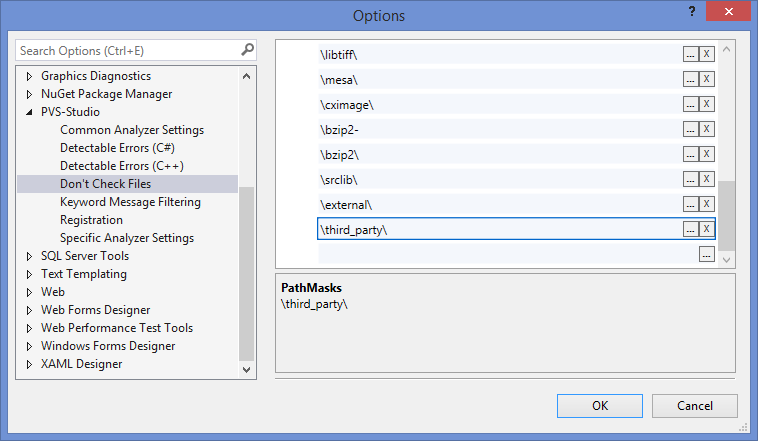
Figure 1 - We set the analysis exceptions in the PVS-Studio settings
. Now you can run the analysis and see what interesting things can be found.
Note. 'Don't Check Files' can be configured 'before' and 'after' analysis. I talked about the first case above, while the second one will filter the already received log, which is also useful and will save you from viewing unnecessary warnings. More about this below.
False positives: fun arithmetic
Why false positives are important (and unpleasant)
False positives are a headache for everyone: for us, developers of a static analyzer, and for users, as they clog up a useful conclusion. A large number of false positives can push people away from using the tool. In addition, often people evaluate analyzers by the criterion of how many false positives they give out. It's not so simple, and this topic is suitable for a separate article and discussion. My colleague, by the way, recently just wrote an article on this topic , I recommend that you familiarize yourself.
How to deal with false positives?
Our task is to try to sift out as many false positives as possible at the analysis stage so that the user does not know about them at all. For this, exceptions are introduced into the diagnostic rules, i.e. special cases in which it is not necessary to issue warnings. The number of these exceptions can vary greatly from diagnostics to diagnostics: somewhere they may not exist at all, and somewhere dozens of such exceptions can be implemented.
Nevertheless, all cases cannot be covered (sometimes they are very specific), so our second task is to give the user the opportunity to independently exclude false positives from the analysis results. For this, the PVS-Studio analyzer implements a number of mechanisms, such as suppressing false positives through comments, configuration files, and suppression bases. Again, it’s written about ita separate article , so here I will not dig much deep.
False positives and TensorFlow
Why did I even start a conversation about false positives? Firstly, because the fight against false positives is important, and secondly, because this is what I saw when I checked TensorFlow and filtered the output according to diagnostic rule V654 .
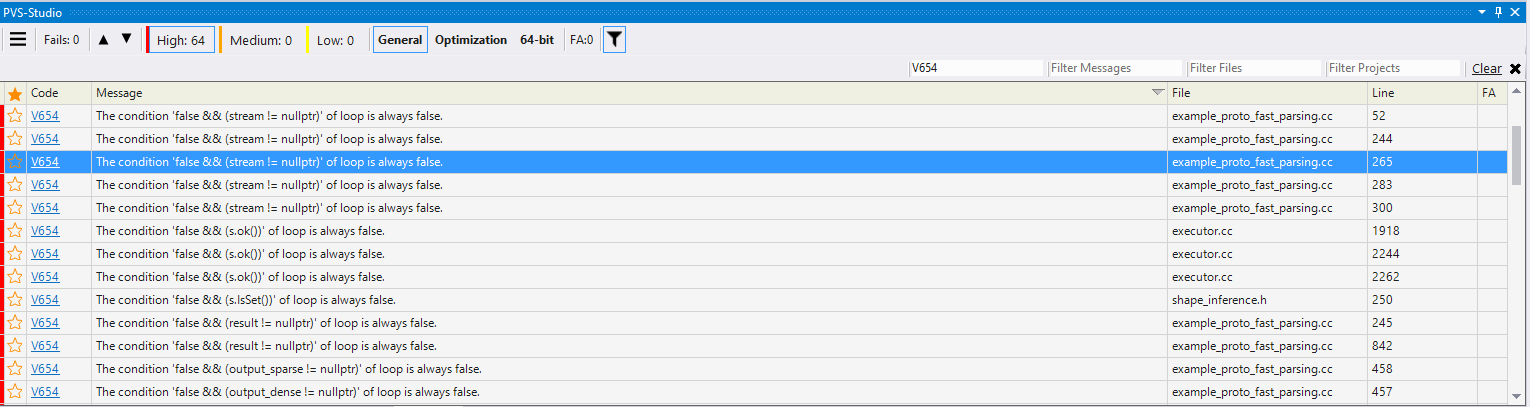
Figure 2 - All detected trips of V654 have a similar pattern of
64 trips, and all, like one, have the same pattern - a code of the form:
false && exprIn the code itself, these places look like this:
DCHECK(v);
DCHECK(stream != nullptr);
DCHECK(result != nullptr);
And here is how the DCHECK macro is declared :
#ifndef NDEBUG
....
#define DCHECK(condition) CHECK(condition)
....
#else
....
#define DCHECK(condition) \
  while (false && (condition)) LOG(FATAL)
....
#endif
What follows from this code? DCHECK is a debug macro. In the debug version of the code, it is expanded into a condition check ( CHECK (condition) ), in the release version - into a loop that will never be executed - while (false && ....) . Due to the fact that I was collecting the release version of the code, the macro was opened accordingly (in the while loop ). As a result, it turns out that the analyzer, it would seem, swears on the case - because the result of the expression is always always false . But what is the use of these warnings if they are issued on a code that was intended to be so? As a result, the percentage of false positives for this diagnostic will be the same as in the diagram below.
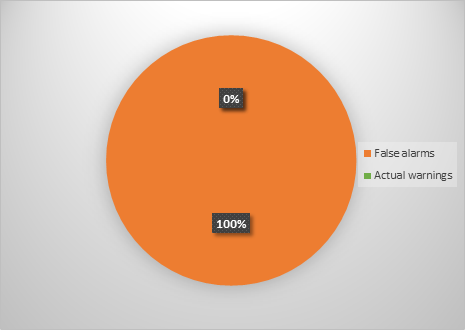
Figure 3 - Correlation of good and false positives for V654 diagnostics
Maybe you thought it was a joke? No, not a joke, 100% false positives. Here about such specific cases, I said above. He also said that there are ways to deal with them. With a flick of the wrist and the 'Add selected messages to suppression base' button, we can correct this ratio in the opposite direction.

Figure 4 - Fighting false positives
So you can suppress all current warnings by removing them from the output window. But this is not entirely correct, because if you use the DCHECK macro again during code writing , warnings will be issued again. There is a solution. It is necessary to suppress the trigger in the macro, leaving a comment of a special kind. The suppression code will look like this:
//-V:DCHECK:654
#define DCHECK(condition) \
  while (false && (condition)) LOG(FATAL)
The comment should be placed in the same header file where the macro is declared.
That's it, now you can no longer worry about the DCHECK macro , because warning V654 will no longer be issued on it. As a result, we again successfully fought with false positives. Anyway, after these actions, the false positive diagram for V654 will look like this.
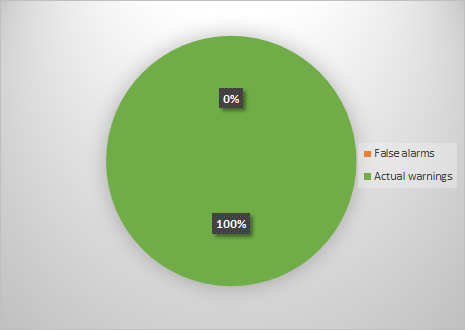
Figure 5 - Successfully eliminated false positives
Now the picture looks quite different, because the percentage of false positives is 0. Such an interesting arithmetic. Why all this talk about false positives? I just wanted to explain that false positives are inevitable. The purpose of the analyzer is to get rid of as many of them as possible at the stage of analysis, but due to the specifics of the project, you may have to deal with them. I hope I managed to convey that it is possible (and necessary) to deal with false positives, and this is done quite simply.
Some more settings
Surely you are already impatient to look at the errors found, but I urge you to be patient and suggest to consider some more settings that will help make life easier when working with the analysis results.
Alerts in automatically generated files
During the analysis, we checked not only the code that the programmers wrote independently, but also the automatically generated code. We are not interested in viewing warnings on such a code, so we need to somehow exclude them from the analysis. Here, the previously mentioned 'Don't check files' settings will come to the rescue. Specifically for this project, I set exceptions for the following file names:
pywrap_*
*.pb.cc
This hid more than 100 general-purpose alerts (GA) that have a medium confidence level (Medium).
Disabling specific diagnostics
Another analyzer setting that turned out to be useful is disabling groups of diagnostic rules. Why might this be relevant? For example, about 70 V730 warnings were issued on this project .(not all members of the class are initialized in the constructor). Do not go past these warnings, as they can signal difficult to detect errors. However, it is not always clear to a person unfamiliar with the code whether the uninitialized member will actually lead to problems, or is there some tricky way to further initialize it. And for the article, errors of this type are not the most interesting. Therefore, they should be viewed by developers, but we will not focus on this. From here the goal is formed - disabling a whole group of diagnostic rules. This is done easily and simply: in the settings of the PVS-Studio plugin, it is enough to deselect the 'Check box' for the corresponding diagnostics.
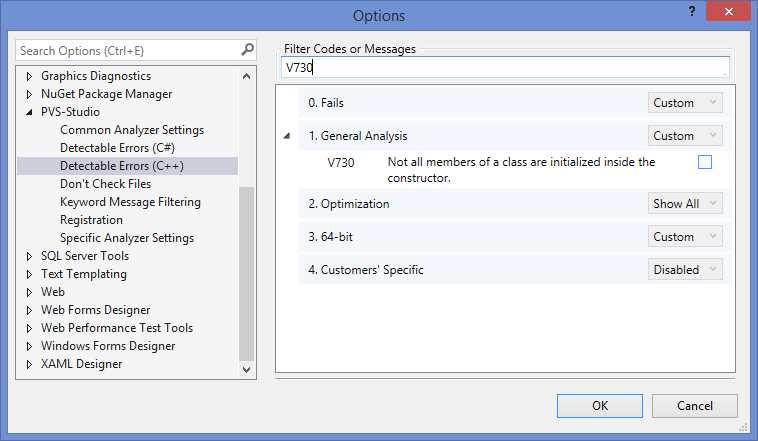
Figure 6 - Disabling irrelevant diagnostics
By disabling those diagnostic rules that are not relevant for your project, you thereby simplify your further work with the analyzer output.
Parsing Alerts
Well, let's move on to perhaps the most interesting part - the analysis of those code fragments that PVS-Studio considered suspicious.
Usually I like to start with the classic error that is made in both C ++ projects and C # - an error of the form a == a , which the diagnostic rules V501 and V3001 detect . But there are no such errors! Anyway, the set of detected errors is quite ... specific. But we will not pull, get down to business.
void ToGraphDef(const Graph* g, GraphDef* gdef, bool pretty) {
  ....
  gtl::InlinedVector inputs;
  ....
  for (const Edge* e : inputs) {
    const string srcname = NewName(e->src(), pretty);
    if (e == nullptr) {
      ndef->add_input("unknown");
    } else if (!e->src()->IsOp()) {
    } else if (e->IsControlEdge()) {
      ndef->add_input(strings::StrCat("^", srcname));
    } else if (e->src_output() == 0) {
      ndef->add_input(srcname);
    } else {
      ndef->add_input(strings::StrCat(srcname, ":", e->src_output()));
    }
  }
  ....
}
→ GitHub Link
PVS-Studio Warning : V595 The 'e' pointer was utilized before it was verified against nullptr. Check lines: 1044, 1045. function.cc 1044
The loop traverses the elements of a vector and, depending on the value of the element, certain actions are performed. Checking e == nullptr implies that the pointer can be null. That's just the line above, during the call to the NewName function, the pointer is dereferenced: e-> src () . The result of such an operation is an undefined behavior that can lead, inter alia, to a program crash.
But the TensorFlow code is not so simple. Filling this vector ( inputs) occurs above and looks as follows:
for (const Edge* e : n->in_edges()) {
  if (e->IsControlEdge()) {
    inputs.push_back(e);
  } else {
    if (inputs[e->dst_input()] == nullptr) {
      inputs[e->dst_input()] = e;
    } else {
      LOG(WARNING) << "Malformed graph node. multiple input edges: "
                   << n->DebugString();
    }
  }
}
By looking carefully at this code, you can see that null pointers will never be written to the inputs vector , because before adding elements, the pointer is always dereferenced, and before the pointer is dereferenced, it is not checked for nullptr equality . Since the inputs vector will not contain null pointers, it turns out that the expression e == nullptr , which we spoke about earlier, will always be false .
One way or another, this is a trick code, and PVS-Studio successfully found it. Move on.
Status MasterSession::StartStep(const BuildGraphOptions& opts,
                                int64* count,
                                ReffedClientGraph** rcg,
                                bool is_partial) {
  ....
  ReffedClientGraph* to_unref = nullptr;
  ....
  if (to_unref) to_unref->Unref();
  ....
}
→ Link to GitHub
PVS-Studio warning : V547 Expression 'to_unref' is always false. master_session.cc 1114
The local variable to_unref , initialized to nullptr , is declared in the body of the method . Prior to the if statement, this pointer is not used; its value does not change. Therefore, since the pointer remains null, the body of the if statement will never be executed. Perhaps this code is left after refactoring. Maybe this pointer should have been used somewhere between initialization and verification, but another one was used instead (mixed up), however I did not find similar names. It looks suspicious.
Move on.
struct LSTMBlockCellBprop ....
{
  ....
  void operator()(...., bool use_peephole, ....) {
  ....
  if (use_peephole) {
    cs_prev_grad.device(d) =
        cs_prev_grad +
        di * wci.reshape(p_shape).broadcast(p_broadcast_shape) +
        df * wcf.reshape(p_shape).broadcast(p_broadcast_shape);
  }
  if (use_peephole) {
    wci_grad.device(d) =
      (di * cs_prev).sum(Eigen::array({0}));
    wcf_grad.device(d) =
      (df * cs_prev).sum(Eigen::array({0}));
    wco_grad.device(d) =
      (do_ * cs).sum(Eigen::array({0}));
  }
  ....
  }
};
→ GitHub Link
PVS-Studio Warning : V581 The conditional expressions of the 'if' operators located alongside each other are identical. Check lines: 277, 284. lstm_ops.h 284
There are two conditional statements with the same conditional expression, and the expression (in this case, the use_peephole parameter ) does not change between these statements . Sometimes this may indicate a rather serious error when in one of the cases the expression used was not intended, but in this case, based on the context, we can conclude that the conditional statements were simply duplicated. I think this is not a mistake, but all operations could be placed in one conditional statement.
You cannot write an article and not look at copy-paste errors.
struct CompressFlags {
  ....
  Format format;
  ....
  int quality = 95;
  ....
  bool progressive = false;
  ....
  bool optimize_jpeg_size = false;
  ....
  bool chroma_downsampling = true;
  ....
  int density_unit = 1;
  int x_density = 300;
  int y_density = 300;
  ....
  StringPiece xmp_metadata;
  ....
  int stride = 0;
};
class EncodeJpegOp : public OpKernel {
  ....
  explicit EncodeJpegOp(OpKernelConstruction* context) :
    OpKernel(context) {
    ....
    OP_REQUIRES_OK(context,
      context->GetAttr("quality", &flags_.quality));
    OP_REQUIRES(context,
      0 <= flags_.quality && flags_.quality <= 100,
      errors::InvalidArgument("quality must be in [0,100], got ",
      flags_.quality));
    OP_REQUIRES_OK(context,
      context->GetAttr("progressive",
                       &flags_.progressive));
    OP_REQUIRES_OK(context,
      context->GetAttr("optimize_size",
                       &flags_.optimize_jpeg_size));
    OP_REQUIRES_OK(context,
      context->GetAttr("chroma_downsampling",         // <=
                       &flags_.chroma_downsampling));
    OP_REQUIRES_OK(context,
      context->GetAttr("chroma_downsampling",         // <=
                       &flags_.chroma_downsampling));
    ....
  }
  ....
  jpeg::CompressFlags flags_;
}
→ GitHub Link
PVS-Studio Warning : V760 Two identical blocks of text were found. The second block begins from line 58. encode_jpeg_op.cc 56
As you can see from the code, in the constructor of the EncodeJpegOp class , through the macros OP_REQUIRES_OK and OP_REQUIRES, they check the values of flags read from the flags_ field . However, in the last lines of the code snippet for the constructor, the value of the same flag is checked. Very similar to copy-paste: duplicated, but forgot to fix it.
The most interesting (and difficult) thing that often happens in such cases is to understand whether the copy-paste code is redundant, or if something else was implied. If the code is redundant, as a rule, there is nothing particularly terrible, but a completely different conversation, if another piece of code was meant, since in this case we get a logical error.
Having looked at the constructor body, I did not find a check for the stride field . It is possible that in one of the cases this check was implied. On the other hand, in the constructor, the order of the fields is the same as the order of declaring the fields in the CompressFlags structure . So it’s difficult to judge how to fix the code here, you can only make assumptions. In any case, you should pay attention to this place.
I found the analyzer and several suspicious places associated with the bit shift. Let's look at them. And I want to remind you that misuse of shift operations can lead to undefined behavior.
class InferenceContext {
  ....
  inline int64 Value(DimensionOrConstant d) const {
    return d.dim.IsSet() ? d.dim->value_ : d.val;
  }
  ....
}
REGISTER_OP("UnpackPath")
    .Input("path: int32")
    .Input("path_values: float")
    .Output("unpacked_path: float")
    .SetShapeFn([](InferenceContext* c) {
      ....
      int64 num_nodes = InferenceContext::kUnknownDim;
      if (c->ValueKnown(tree_depth)) {
        num_nodes = (1 << c->Value(tree_depth)) - 1;    // <=
      }
      ....
    })
....;
→ GitHub Link
PVS-Studio Warning : V629 Consider inspecting the '1 << c-> Value (tree_depth)' expression. Bit shifting of the 32-bit value with a subsequent expansion to the 64-bit type. unpack_path_op.cc 55 The
suspicion of this code is that 32-bit and 64-bit values are mixed here in shift and assignment operations. Literal 1 is a 32-bit value for which a left-side shift is performed. The result of the shift is still of the 32-bit type, but it is written to a 64-bit variable. This is suspicious, because if the value that the Value method returns is greater than 32, undefined behavior will occur here.
Quote from the standard :The value of E1 << E2 is E1 left-shifted E2 bit positions; vacated bits are zero-filled. If E1 has an unsigned type, the value of the result is E1 * 2 ^ E2, reduced modulo one more than the maximum value representable in the result type. Otherwise, if E1 has a signed type and non-negative value, and E1 * 2 ^ E2 is representable in the result type, then that is the resulting value; otherwise, the behavior is undefined .
This code can be fixed by deliberately writing 1 as a 64-bit literal, or by performing type expansion through a cast. More details about the shifts are written in the article " Do not know the ford, do not get into the water. Part Three ."
Extension through casting, by the way, was used elsewhere. Here is the code:
AlphaNum::AlphaNum(Hex hex) {
  ....
  uint64 value = hex.value;
  uint64 width = hex.spec;
  // We accomplish minimum width by OR'ing in 0x10000 to the user's
  // value,
  // where 0x10000 is the smallest hex number that is as wide as the
  // user
  // asked for.
  uint64 mask = ((static_cast(1) << (width - 1) * 4)) | value;
  ....
}
→ GitHub Link
PVS-Studio Warning : V592 The expression was enclosed by parentheses twice: ((expression)). One pair of parentheses is unnecessary or misprint is present. strcat.cc 43
This is the correct code that the analyzer found suspicious when it found duplicate parentheses. The analyzer argues as follows: double brackets do not affect the result of evaluating the expression, therefore, perhaps one pair of brackets is not located where it is necessary.
It cannot be ruled out that we wanted to put the brackets here in order to clearly emphasize the sequence of calculations, and so that we did not have to recall the priorities of the operations '<<' and '*'. But, since they are in the wrong place, there is no sense in them. I believe that the order of expressions is correct here (first, the shift value is set, and then the shift itself is performed), so you just need to put the right brackets so that they are not misleading.
uint64 mask = (static_cast(1) << ((width - 1) * 4)) | value; Move on.
void Compute(OpKernelContext* context) override {
  ....
  int64 v = floor(in_x);
  ....
  v = ceil(in_x1);
  x_interp.end = ceil(in_x1);
  v = x_interp.end - 1;
  ....
}
→ GitHub Link
PVS-Studio Warning : V519 The 'v' variable is assigned values twice successively. Perhaps this is a mistake. Check lines: 172, 174. resize_area_op.cc 174
Twice they write to the variable v , while the value of this variable is not used between assignments. Moreover, the same value is written to x_interp.end , which was previously written to the variable v . Even if we omit the fact of an extra call to the ceil function , since this is not critical (though ...), the code still looks strange: either it is just weirdly written, or it contains a tricky error.
Further:
void Compute(OpKernelContext* context) override {
  ....
  int64 sparse_input_start;                                     // <=
  ....
  if (sparse_input) {
    num_total_features += GetNumSparseFeatures(
      sparse_input_indices, *it, &sparse_input_start);          // <=
  }
  if (num_total_features == 0) {
    LOG(WARNING) << "num total features is zero.";
    break;
  }
  if (rand_feature < input_spec_.dense_features_size()) {
    ....
  } else {
    ....
    const int32 sparse_index = sparse_input_start +             // <=
      rand_feature - input_spec_.dense_features_size();
    ....
  }
  ....
}
→ GitHub Link
PVS-Studio Warning : V614 Potentially uninitialized variable 'sparse_input_start' used. sample_inputs_op.cc 351 It is
suspicious in this code that a potentially uninitialized sparse_input_start variable may be used when initializing the sparse_index constant . At the time of declaration, this variable is not initialized with any value, i.e. contains some kind of trash. Below, provided that the sparse_input expression is true , the address of the sparse_input_start variable is passed to the GetNumSparseFeatures function, where, probably, this variable is initialized. But otherwise, if the body of this conditional statement is not executed, sparse_input_start will remain uninitialized.
Of course, we can assume that if sparse_input_start remains uninitialized, it will not come to its use, but it is too bold and unobvious, so it would be nice to set some standard value for the variable.
It's all?
Yes and no. To be honest, I myself hoped to find more defects and wanted to write an article in the spirit of testing Qt , Mono , Unreal Engine 4 and the like, but it did not work out. Errors did not lie here and there, so you should pay tribute to the developers of the project. However, I hoped that the project would be larger in size, but only about 700 files, including auto-generated ones, were checked in the selected configuration.
In addition, some remains outside the scope of this article, for example:
- Only warnings from the GA group were considered;
- Warnings of Level 3 confidence (Low) were not considered;
- Several dozen V730 warnings were issued , but their criticality is difficult to judge, so let us leave them outside the scope of the article - to the developers;
- And so forth
Nevertheless, as we saw, PVS-Studio found a number of interesting code fragments that were discussed in this article.
Summarizing
TensorFlow turned out to be quite an interesting and high-quality project from the point of view of code, but, as we saw, not without flaws. And PVS-Studio once again demonstrated that it is able to find errors even in the code of eminent developers.
In conclusion, I would like to praise everyone who is working on TensorFlow for quality code, and wish them good luck in the future.
Oh yes, I almost forgot.

To everyone who read to the end - thank you for your attention, codeless code, and do not forget to use PVS-Studio !

If you want to share this article with an English-speaking audience, then please use the link to the translation: Sergey Vasiliev. War of the Machines: PVS-Studio vs. Tensorflow
Have you read the article and have a question?
Often our articles are asked the same questions. We collected the answers here: Answers to questions from readers of articles about PVS-Studio, version 2015 . Please see the list.