Highload ++: How to help the ERP system cope with 500,000 requests per second
We at X5 process a lot of data in the ERP system. There is an opinion that no one processes more than us in SAP ERP and SAP BW in Russia. But there is one more thing - the number of operations and the load on this system is increasing rapidly. 3 years we "fought" for the performance of our ERP-heavyweight, filled a lot of cones, and what methods they were treated, we tell under the cut.

X5 now manages more than 13,000 stores. Most of the business processes of each of them passes through a single ERP-system. Each store can have from 3,000 to 30,000 products, this creates problems with the load on the system, because it goes through the processes of regular recalculation of prices in accordance with promotions and the requirements of the law and the calculation of replenishment of inventory. All this is critical, and if it is not calculated in time what goods in what quantity should be delivered to the store tomorrow, or what price should be on the goods, buyers will not find what they were looking for, or will not be able to purchase goods at the price of the current promotional item. stock In general, in addition to accounting for financial transactions, the ERP-system is responsible for much in the daily life of each store.
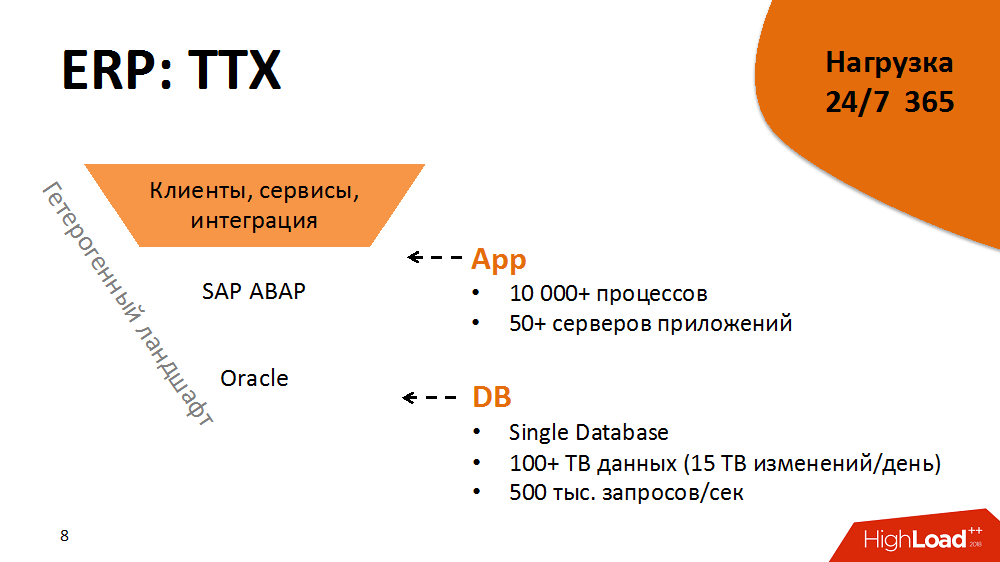
Some TTX ERP-system. Its architecture is classic, three-tier with service-oriented elements: on top we have over 5,000 fat clients and terabytes of information flows from stores and distribution centers, in the application layer there is a SAP ABAP with more than 10,000 processes and, finally, a Oracle Database c over 100 TB of data. Each ABAP process is conditionally a virtual machine that performs business logic in ABAP, with its DBSL and SQL dialect, caching, memory management, ORM, etc. On the day, we get more than 15 TB of changes in the database log. The load level is 500,000 requests per second.
This architecture is a heterogeneous environment. Each of the components is cross-platform, we can move it to different platforms, choose the best ones, etc.
Fuel to the fire adds that the ERP-system is under load 24 hours a day, 365 days a year. Availability - 99.9% of the time during the year. The load is divided into day and night profiles and house keeping in free time.
But that's not all. The system has a hard and tight release cycle. It transfers more than 2,000 batch changes per year. This may be one new button, and major changes in the logic of business applications.
As a result, it is a large and highly loaded, but at the same time stable, predictable and ready-for-growth system capable of hosting tens of thousands of stores. But it was not always so.
To dive into the practical material you need to go back to 2014. Then there were the most difficult tasks to optimize the system. There were about 5,000
stores . The system at that time was in such a state that most of the critical processes were unscalable and inadequately responded to the increase in load (that is, the appearance of new stores and merchandise). In addition, two years before that, an expensive Hi-End was purchased, and for some time the upgrade was not in our plans. At the same time, the processes in the ERP were already on the verge of breaking the SLA. Vendor concluded that the load on the system is not scalable. No one knew whether she would sustain at least a + 10% increase in load. And it was planned to open stores twice as many within three years.
Just feed the ERP-system with a new iron was impossible, and it would not help. Therefore, in the first place, we decided to include a software optimization method in the release cycle and follow the rule: linear load growth is proportional to the growth of load drivers - the key to predictability and scalability.
What was the optimization technique? This is a cyclical process, divided into several stages:
Then the cycle was repeated.
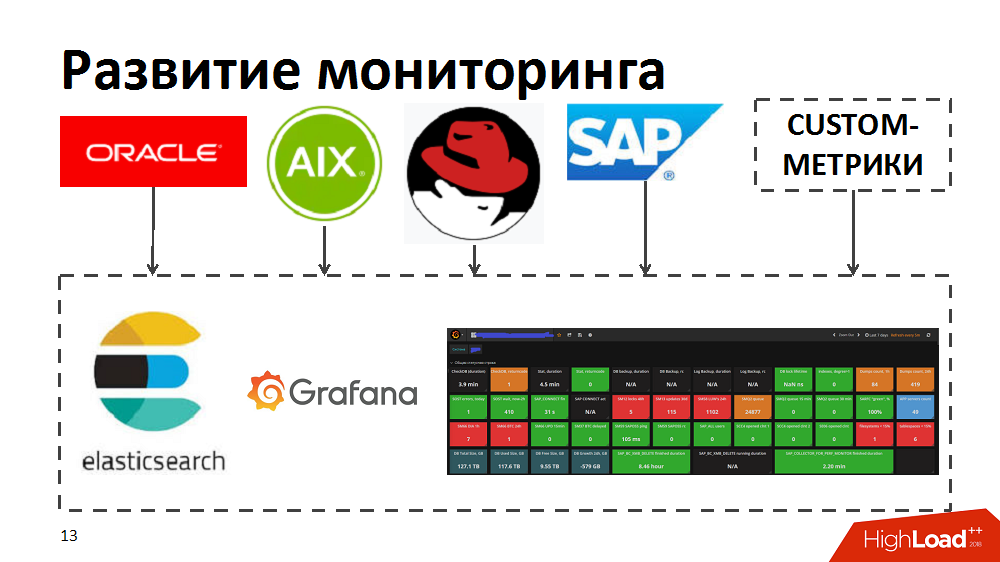
In the process, we realized that current monitoring tools do not allow us to quickly identify top consumers, identify bottlenecks and processes starving for resources. Therefore, to speed up, we tried the elastic search and Grafana tools. To do this, they independently developed collectors, which, using standard monitoring tools in Oracle / SAP / AIX / Linux, transferred metrics to elastic search and allowed to monitor the health of the system in real time. In addition, they have enriched monitoring with their own custom metrics, for example, response time and throughput of specific SAP components or layout of workload profiles for business processes.
First of all, for a smaller impact of bottlenecks on speed, they provided a smoother load on the system.
Most business processes in our ERP system, such as regular pricing or stock replenishment planning, represent the sequential, step-by-step processing of a large amount of data (for all products and all stores). In order to implement processing within such difficult tasks, we developed our own batch-parallel processing manager (hereinafter referred to as the load scheduler). In this case, in the form of a package, a separate processing stage is presented for each individual store.
Initially, the logic of the scheduler was such that first the packages of the first stage of processing were run on all stores, then the packages of the second stage, etc. That is, the system simultaneously executed processes that created a load of the same type and caused the degradation of certain resources (input-output to the database or CPU on the application servers, etc.).
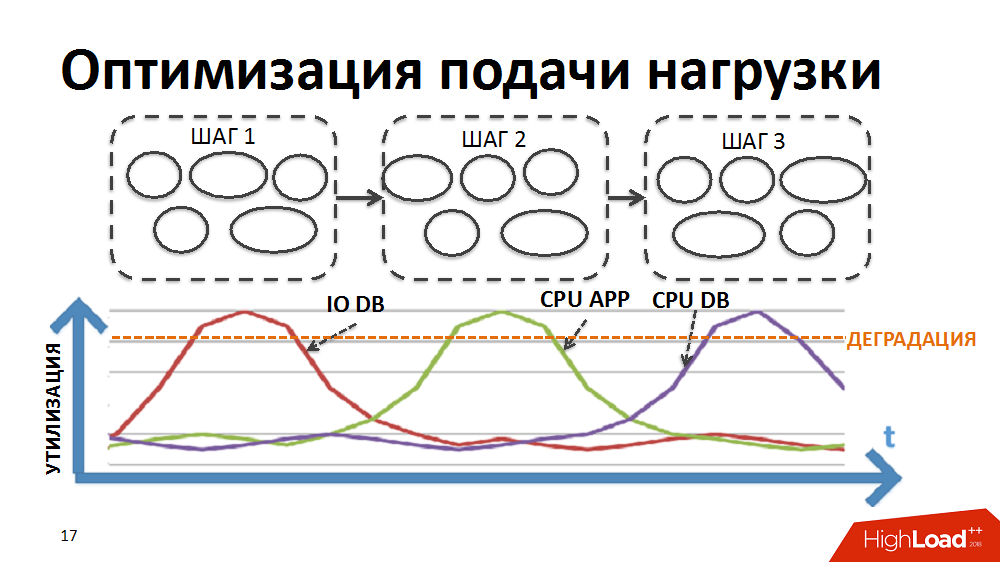
We rewrote the logic of the scheduler so that the chain of packages is formed separately for each store and the priority of launching new packages is not built in stages, but in shops.
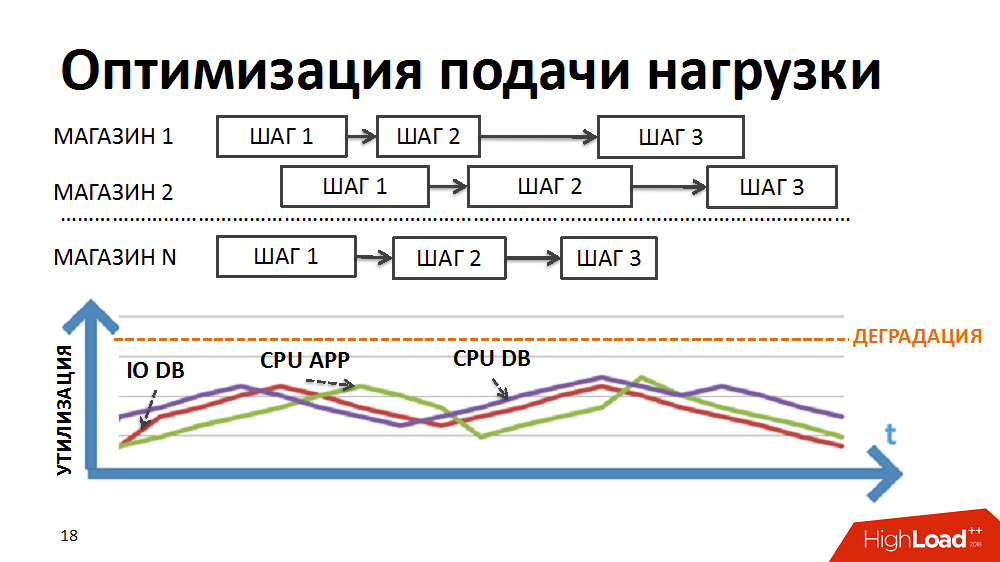
Due to the different durations of package execution in different stores and the regulated large number of simultaneously executed processes within the tasks of the load planner, we achieved simultaneous execution of heterogeneous processes, smoother loading of the load and elimination of some bottlenecks.
Then we began to optimize individual structures. Each individual package was considered, profiled and collected non-optimal designs and used approaches to optimize them. In the future, these approaches were included in the developer’s regulations in order to prevent undesirable load growth during the development of the system. Some of them:
About the latter in more detail. In this case, the data model was translated into a less normal form. A classic example is the selection of accounting documents for a specific date for a particular store. It is requested by many employees. The master-table (header table) stores the dates of the documents, in the position table - the store and product. The most frequent requests are a selection of all documents for a specific store for a specific date. With such a request, the filter by date on the header table gives 500 thousand entries, the filter on the store - the same amount. At the same time, after gluing in a separate store for the desired date, we have 3 thousand terms. No matter from which table we start filtering and pasting data, we always get a lot of unwanted I / O operations.
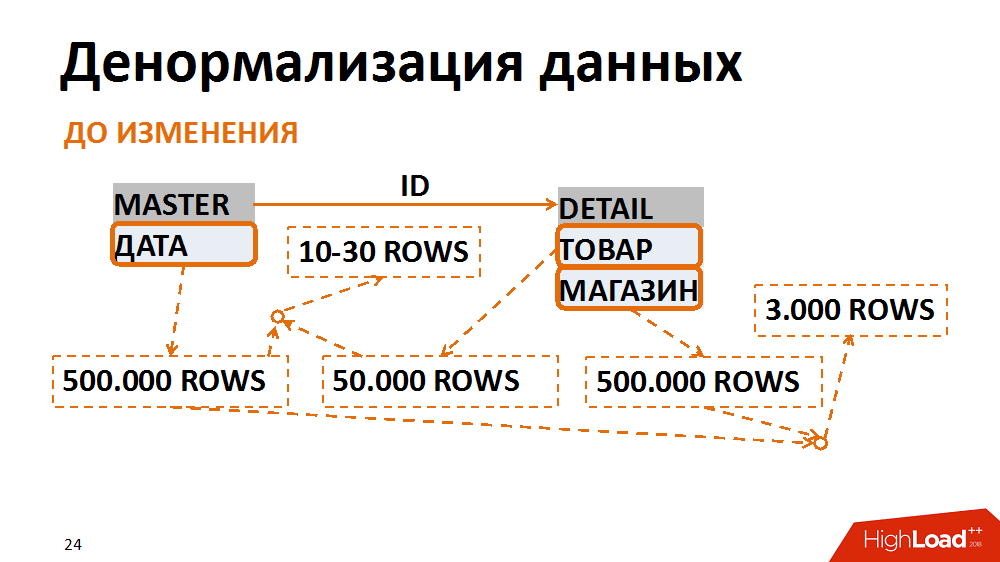
This can be avoided by presenting data in a less normal form. In one case, the date field was duplicated in the position table, ensured that it was filled in when creating documents, collected indexes for quick search, and was already filtered by the position table. Thus, having sacrificed insignificant overhead costs for storing a new field and indexes, we have several times reduced the number of I / O operations generated by problematic queries.

For a year and a half we have done a great job of optimizing the system, it has become more predictable. Nevertheless, plans to double the number of stores remained relevant, so the challenges still faced us.
On the way up, we encountered different bottlenecks. For example, at the end of 2015, they realized that they had rested against the performance of a single core-service platform. This is a SAP ABAP logical lock service. Because of him, the system clearly could not withstand the growth of the load. Loss of big money loomed on the horizon.
To clarify, the task of the service is to bring logical transactionality to the application server level. In ABAP, one transaction can take place in the form of several steps on different workflows. In order for the transaction to be complete, there is a lock service and associated mechanisms. The operations of locking and unlocking it happen quickly, but they are atomic, they can not be separated. In this case, there was a problem of synchronous I / O.
The service accelerated a bit after the SAP developers released a special patch, we transferred the service to another hardware and worked on the system settings, but this was still not enough. The passport service ceiling was about 7 thousand operations per second, and we have long needed 10 thousand.
After the synthetic load test, we found out that the degradation occurs nonlinearly and we are still at the service performance boundary, above which an unacceptable degradation of the entire ERP system is manifested. Repeated appeals to the developers gave only a disappointing verdict - the service works correctly, we just demand too much in the current architecture of the solution. Even if we immediately took it upon ourselves to redo the entire solution architecture, it would take us several months to maintain the efficiency of the current system.
One of the first options in an attempt to extend the life of a lock service is to speed up I / O operations and write them to the file system. Than? Experimenting with an alternative to AIX. Transferred the service to Linux on the most powerful Power-machine, and won a lot of response time. The service with the file system enabled was the same as on Aix with disabled. Then this code was transferred to one of the x86_64 blades and got an even more fantastically shallower performance curve than before. It looked funny.
One would assume that the developers on AIX and Linux in the past test did something differently, but here the processor architecture also had an impact.
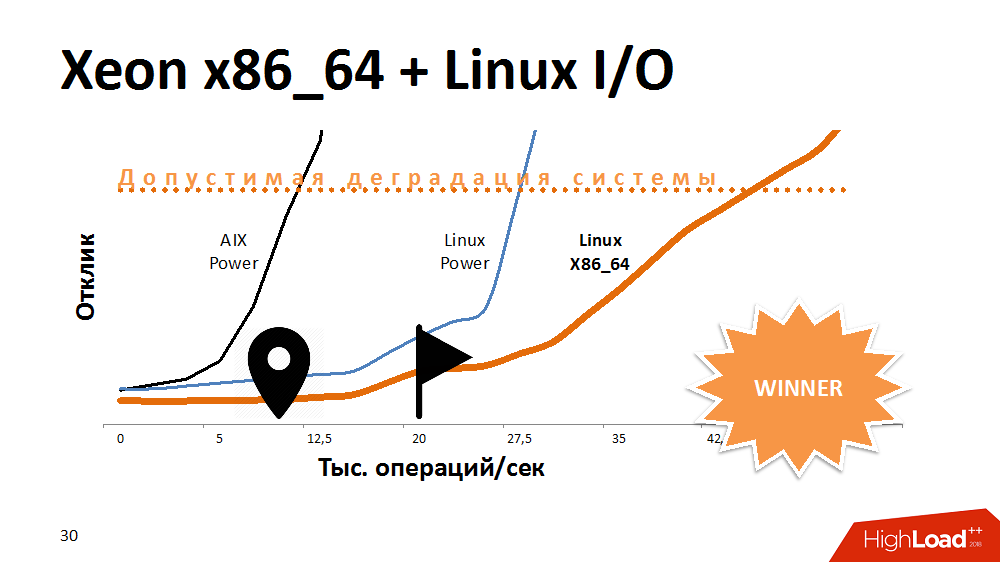
What was the conclusion? Some kind of platform is ideally suited for multi-threaded databases, providing both performance and fault tolerance, but a processor on a different architecture may well cope better with specific tasks. If at the start of building a solution to abandon cross-platform, you can lose space for maneuvers in the future.
Nevertheless, we dealt with this problem and the service began to work 3-4 times faster, which is enough for very long growth.
Literally in half a year, exotic problems began to be felt with the CPU on the database. It seems to be clear that with increasing load increases the consumption of processor resources. But most of it began to occupy SysTime, and obviously there was a problem in the kernel. They began to understand, do synthetic load tests and realized that our throughput is 300 thousand operations per second, i.e. billion requests per hour, and then - degradation.
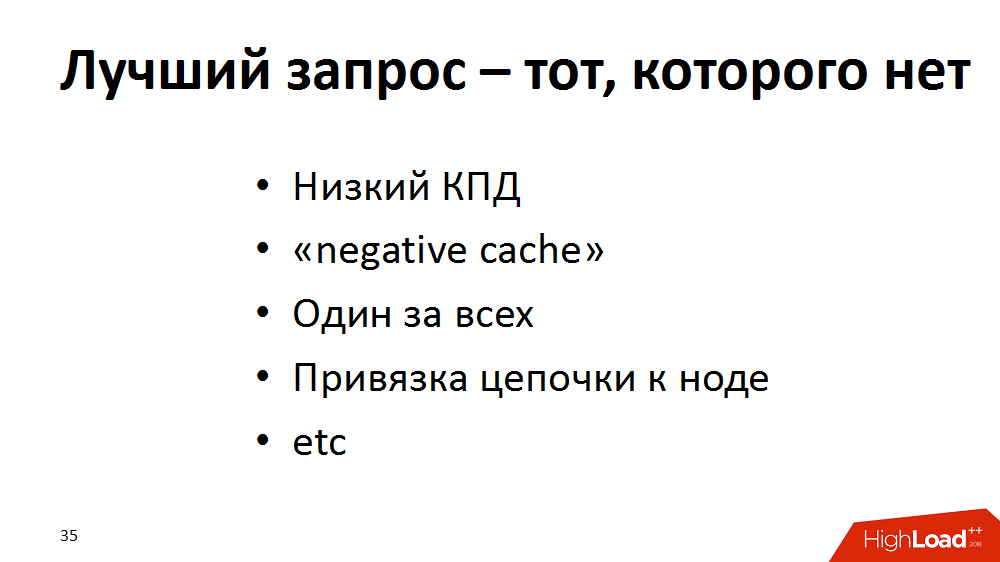
As a result, we came to the conclusion that the ideal query is the one that does not exist. They expanded their optimization methodology with new approaches and conducted an audit of the ERP system: they began to look for requests, for example, with low efficiency (100 thousand selektov - as a result of 100 lines or even 0) - to redo. If “empty” requests cannot be removed, then let them go to “negative cache”, if appropriate. If many requests for the same data about goods are processed in parallel, then let them torment the application server, and not the base, we cache it. Also, a large number of frequent single requests for a key are “enlarged” within one process, replacing them with rarer samples in terms of a key. Or, for example, to distribute the load in the processing chain, different steps could be performed on different application servers. This is good, but at different stages they may ask the same thing from the base.
With the help of such techniques, we won a little bit of everything everywhere, but in the end we seriously unloaded the base. The system is alive. In the meantime, we are engaged in Aix.
In the course of other experiments, we found out that there is a performance ceiling - the already mentioned 300,000 DataBase calls per second. The roots of the problem were the performance of the network interface, which had a ceiling - about 300 thousand packets per second in one direction. As the ceiling got closer, the time for system calls grew. As it turned out, it was also the legacy of the AIX OS kernel stack.
In general, we never had problems with latency, the network core was productive, all the cords were assembled into a large, unkillable channel on a single interface. We made a workaround: we divided the entire network between the application servers and the database into groups using different interfaces. As a result, each group of application servers communicated with the database in a separate interface. The maximum performance of each interface was slightly reduced, but in total we dispersed the network to 1 million packets per second in one direction.
And the principle “The best request is the one that does not exist” was added to the Talmud for developers, so that this would be taken into account when writing code.
Well, the last stage of the improvement of our system, passed in 2017. It remained to live quite a bit before the upgrade and it was necessary to keep the SLA just nothing. The code was optimized, but we saw that the higher the load on the CPU database, the slower the processes work, although the utilization margin was 10-20%. Initially it was calculated that 100% is two times more than 50%. And when there is a stock of 10-20%, this is 10-20%. In fact, with a load above 67-80%, the duration of tasks grew non-linearly, i.e. Amdal's law worked. The system had a limit of parallelization and when it was exceeded, with the involvement of a growing number of processors, the performance of each individual processor decreased.
At that time, we used 125 physical processors, or 500 logical processors taking into account multithreading at the AIX level. What would you suggest? Upgrade? Even before the end of its coordination, it was necessary to hold out for several months and not to drop the SLA.
At some point, we realized that traditional processor utilization metrics are not indicative of us — they do not show the actual beginning of degradation. For a realistic assessment of the health of the system, we began to use the integral metric - the result of the synthetic test as the performance metrics of the database processor. Once a minute they did a synthetic test, measured its duration and output this metric to our monitors. And reacted if the metric rose above the stated critical mark. We kept our load planners up a bit to keep it in the “maximum torque” area of the database.
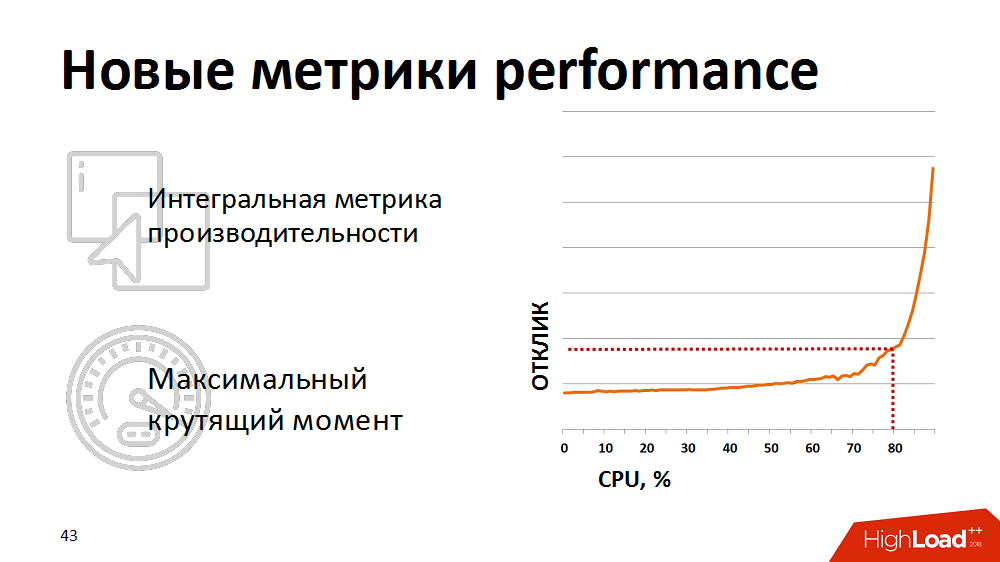
However, manual control was ineffective, and we were tired of waking up at night. Then we rewrote the load planner so that it has feedback on the current performance metrics. If the metrics went beyond the yellow threshold (see picture), the planning of low-priority packages was frozen and only business-critical processes received priority. In this way, we were automatically able to manage the intensity of the load and resources were used efficiently. And the most interesting thing is that keeping the system within 80% of the load, in the very zone of maximum torque, we ended up with a reduction in the total run time of business processes, because each stream began to work much faster.
We thank the organizers of Highload for the opportunity to share this experience not only on Habré, but also on the stage of the largest event on high-load systems.
Dmitry Tsvetkov, Alexander Lishchuk, SAP experts at # ITX5
By the way, # ITX5 is looking for SAP consultants.
ERP X5
X5 now manages more than 13,000 stores. Most of the business processes of each of them passes through a single ERP-system. Each store can have from 3,000 to 30,000 products, this creates problems with the load on the system, because it goes through the processes of regular recalculation of prices in accordance with promotions and the requirements of the law and the calculation of replenishment of inventory. All this is critical, and if it is not calculated in time what goods in what quantity should be delivered to the store tomorrow, or what price should be on the goods, buyers will not find what they were looking for, or will not be able to purchase goods at the price of the current promotional item. stock In general, in addition to accounting for financial transactions, the ERP-system is responsible for much in the daily life of each store.
Some TTX ERP-system. Its architecture is classic, three-tier with service-oriented elements: on top we have over 5,000 fat clients and terabytes of information flows from stores and distribution centers, in the application layer there is a SAP ABAP with more than 10,000 processes and, finally, a Oracle Database c over 100 TB of data. Each ABAP process is conditionally a virtual machine that performs business logic in ABAP, with its DBSL and SQL dialect, caching, memory management, ORM, etc. On the day, we get more than 15 TB of changes in the database log. The load level is 500,000 requests per second.
This architecture is a heterogeneous environment. Each of the components is cross-platform, we can move it to different platforms, choose the best ones, etc.
Fuel to the fire adds that the ERP-system is under load 24 hours a day, 365 days a year. Availability - 99.9% of the time during the year. The load is divided into day and night profiles and house keeping in free time.
But that's not all. The system has a hard and tight release cycle. It transfers more than 2,000 batch changes per year. This may be one new button, and major changes in the logic of business applications.
As a result, it is a large and highly loaded, but at the same time stable, predictable and ready-for-growth system capable of hosting tens of thousands of stores. But it was not always so.
2014. Bifurcation Point
To dive into the practical material you need to go back to 2014. Then there were the most difficult tasks to optimize the system. There were about 5,000
stores . The system at that time was in such a state that most of the critical processes were unscalable and inadequately responded to the increase in load (that is, the appearance of new stores and merchandise). In addition, two years before that, an expensive Hi-End was purchased, and for some time the upgrade was not in our plans. At the same time, the processes in the ERP were already on the verge of breaking the SLA. Vendor concluded that the load on the system is not scalable. No one knew whether she would sustain at least a + 10% increase in load. And it was planned to open stores twice as many within three years.
Just feed the ERP-system with a new iron was impossible, and it would not help. Therefore, in the first place, we decided to include a software optimization method in the release cycle and follow the rule: linear load growth is proportional to the growth of load drivers - the key to predictability and scalability.
What was the optimization technique? This is a cyclical process, divided into several stages:
- monitoring (identify bottlenecks in the system and identify top resource consumers)
- analysis (profiling of process-consumers, identification of structures with the greatest and non-linear effect on the load in them)
- development (reducing the impact of structures on the load, achieving linear load)
- testing in the quality assessment environment or implementation in a production environment
Then the cycle was repeated.
In the process, we realized that current monitoring tools do not allow us to quickly identify top consumers, identify bottlenecks and processes starving for resources. Therefore, to speed up, we tried the elastic search and Grafana tools. To do this, they independently developed collectors, which, using standard monitoring tools in Oracle / SAP / AIX / Linux, transferred metrics to elastic search and allowed to monitor the health of the system in real time. In addition, they have enriched monitoring with their own custom metrics, for example, response time and throughput of specific SAP components or layout of workload profiles for business processes.
Optimization of code and processes
First of all, for a smaller impact of bottlenecks on speed, they provided a smoother load on the system.
Most business processes in our ERP system, such as regular pricing or stock replenishment planning, represent the sequential, step-by-step processing of a large amount of data (for all products and all stores). In order to implement processing within such difficult tasks, we developed our own batch-parallel processing manager (hereinafter referred to as the load scheduler). In this case, in the form of a package, a separate processing stage is presented for each individual store.
Initially, the logic of the scheduler was such that first the packages of the first stage of processing were run on all stores, then the packages of the second stage, etc. That is, the system simultaneously executed processes that created a load of the same type and caused the degradation of certain resources (input-output to the database or CPU on the application servers, etc.).
We rewrote the logic of the scheduler so that the chain of packages is formed separately for each store and the priority of launching new packages is not built in stages, but in shops.
Due to the different durations of package execution in different stores and the regulated large number of simultaneously executed processes within the tasks of the load planner, we achieved simultaneous execution of heterogeneous processes, smoother loading of the load and elimination of some bottlenecks.
Then we began to optimize individual structures. Each individual package was considered, profiled and collected non-optimal designs and used approaches to optimize them. In the future, these approaches were included in the developer’s regulations in order to prevent undesirable load growth during the development of the system. Some of them:
- excessive load on the CPU of application servers (Often generated by non-linear algorithms in the program code, for example, good old linear search in cycles or non-linear algorithms for searching for intersections of unordered elements, etc ... It was treated by replacing with linear algorithms: linear search in cycles was replaced by binary; To search for intersections of sets, we use linear algorithms, pre-ordering elements, etc.)
- identical database accesses with the same conditions within the same process often lead to excessive utilization of the database CPU (it is treated by caching the results of the first sample in the program memory or at the application server level and using cached data in subsequent samples)
- Frequent join-requests (it’s better, of course, to do them at the database level, but sometimes we allowed ourselves to split them into simple samples, the result of which is cached, and transfer the pasting logic to the butt. Those cases when it is better to warm the application server rather than the database. )
- heavy join requests resulting in a large number of I / O operations
About the latter in more detail. In this case, the data model was translated into a less normal form. A classic example is the selection of accounting documents for a specific date for a particular store. It is requested by many employees. The master-table (header table) stores the dates of the documents, in the position table - the store and product. The most frequent requests are a selection of all documents for a specific store for a specific date. With such a request, the filter by date on the header table gives 500 thousand entries, the filter on the store - the same amount. At the same time, after gluing in a separate store for the desired date, we have 3 thousand terms. No matter from which table we start filtering and pasting data, we always get a lot of unwanted I / O operations.
This can be avoided by presenting data in a less normal form. In one case, the date field was duplicated in the position table, ensured that it was filled in when creating documents, collected indexes for quick search, and was already filtered by the position table. Thus, having sacrificed insignificant overhead costs for storing a new field and indexes, we have several times reduced the number of I / O operations generated by problematic queries.
2015. The problem of one service
For a year and a half we have done a great job of optimizing the system, it has become more predictable. Nevertheless, plans to double the number of stores remained relevant, so the challenges still faced us.
On the way up, we encountered different bottlenecks. For example, at the end of 2015, they realized that they had rested against the performance of a single core-service platform. This is a SAP ABAP logical lock service. Because of him, the system clearly could not withstand the growth of the load. Loss of big money loomed on the horizon.
To clarify, the task of the service is to bring logical transactionality to the application server level. In ABAP, one transaction can take place in the form of several steps on different workflows. In order for the transaction to be complete, there is a lock service and associated mechanisms. The operations of locking and unlocking it happen quickly, but they are atomic, they can not be separated. In this case, there was a problem of synchronous I / O.
The service accelerated a bit after the SAP developers released a special patch, we transferred the service to another hardware and worked on the system settings, but this was still not enough. The passport service ceiling was about 7 thousand operations per second, and we have long needed 10 thousand.
After the synthetic load test, we found out that the degradation occurs nonlinearly and we are still at the service performance boundary, above which an unacceptable degradation of the entire ERP system is manifested. Repeated appeals to the developers gave only a disappointing verdict - the service works correctly, we just demand too much in the current architecture of the solution. Even if we immediately took it upon ourselves to redo the entire solution architecture, it would take us several months to maintain the efficiency of the current system.
One of the first options in an attempt to extend the life of a lock service is to speed up I / O operations and write them to the file system. Than? Experimenting with an alternative to AIX. Transferred the service to Linux on the most powerful Power-machine, and won a lot of response time. The service with the file system enabled was the same as on Aix with disabled. Then this code was transferred to one of the x86_64 blades and got an even more fantastically shallower performance curve than before. It looked funny.
One would assume that the developers on AIX and Linux in the past test did something differently, but here the processor architecture also had an impact.
What was the conclusion? Some kind of platform is ideally suited for multi-threaded databases, providing both performance and fault tolerance, but a processor on a different architecture may well cope better with specific tasks. If at the start of building a solution to abandon cross-platform, you can lose space for maneuvers in the future.
Nevertheless, we dealt with this problem and the service began to work 3-4 times faster, which is enough for very long growth.
2016. DB CPU Bottleneck
Literally in half a year, exotic problems began to be felt with the CPU on the database. It seems to be clear that with increasing load increases the consumption of processor resources. But most of it began to occupy SysTime, and obviously there was a problem in the kernel. They began to understand, do synthetic load tests and realized that our throughput is 300 thousand operations per second, i.e. billion requests per hour, and then - degradation.
As a result, we came to the conclusion that the ideal query is the one that does not exist. They expanded their optimization methodology with new approaches and conducted an audit of the ERP system: they began to look for requests, for example, with low efficiency (100 thousand selektov - as a result of 100 lines or even 0) - to redo. If “empty” requests cannot be removed, then let them go to “negative cache”, if appropriate. If many requests for the same data about goods are processed in parallel, then let them torment the application server, and not the base, we cache it. Also, a large number of frequent single requests for a key are “enlarged” within one process, replacing them with rarer samples in terms of a key. Or, for example, to distribute the load in the processing chain, different steps could be performed on different application servers. This is good, but at different stages they may ask the same thing from the base.
With the help of such techniques, we won a little bit of everything everywhere, but in the end we seriously unloaded the base. The system is alive. In the meantime, we are engaged in Aix.
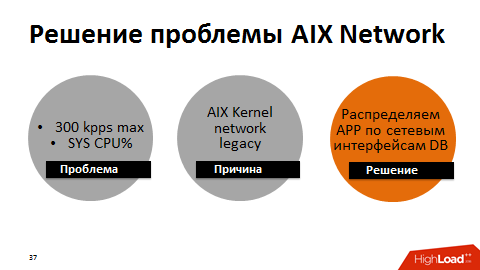
In the course of other experiments, we found out that there is a performance ceiling - the already mentioned 300,000 DataBase calls per second. The roots of the problem were the performance of the network interface, which had a ceiling - about 300 thousand packets per second in one direction. As the ceiling got closer, the time for system calls grew. As it turned out, it was also the legacy of the AIX OS kernel stack.
In general, we never had problems with latency, the network core was productive, all the cords were assembled into a large, unkillable channel on a single interface. We made a workaround: we divided the entire network between the application servers and the database into groups using different interfaces. As a result, each group of application servers communicated with the database in a separate interface. The maximum performance of each interface was slightly reduced, but in total we dispersed the network to 1 million packets per second in one direction.
And the principle “The best request is the one that does not exist” was added to the Talmud for developers, so that this would be taken into account when writing code.
2017. Live to upgrade
Well, the last stage of the improvement of our system, passed in 2017. It remained to live quite a bit before the upgrade and it was necessary to keep the SLA just nothing. The code was optimized, but we saw that the higher the load on the CPU database, the slower the processes work, although the utilization margin was 10-20%. Initially it was calculated that 100% is two times more than 50%. And when there is a stock of 10-20%, this is 10-20%. In fact, with a load above 67-80%, the duration of tasks grew non-linearly, i.e. Amdal's law worked. The system had a limit of parallelization and when it was exceeded, with the involvement of a growing number of processors, the performance of each individual processor decreased.
At that time, we used 125 physical processors, or 500 logical processors taking into account multithreading at the AIX level. What would you suggest? Upgrade? Even before the end of its coordination, it was necessary to hold out for several months and not to drop the SLA.
At some point, we realized that traditional processor utilization metrics are not indicative of us — they do not show the actual beginning of degradation. For a realistic assessment of the health of the system, we began to use the integral metric - the result of the synthetic test as the performance metrics of the database processor. Once a minute they did a synthetic test, measured its duration and output this metric to our monitors. And reacted if the metric rose above the stated critical mark. We kept our load planners up a bit to keep it in the “maximum torque” area of the database.
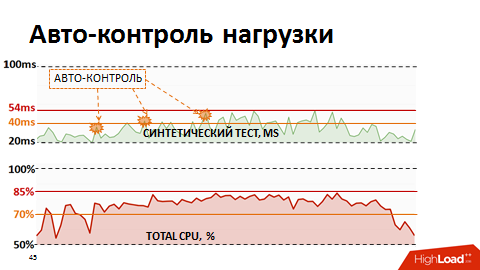
However, manual control was ineffective, and we were tired of waking up at night. Then we rewrote the load planner so that it has feedback on the current performance metrics. If the metrics went beyond the yellow threshold (see picture), the planning of low-priority packages was frozen and only business-critical processes received priority. In this way, we were automatically able to manage the intensity of the load and resources were used efficiently. And the most interesting thing is that keeping the system within 80% of the load, in the very zone of maximum torque, we ended up with a reduction in the total run time of business processes, because each stream began to work much faster.
A couple of tips for those who work with high-loaded ERP
- It is very important to monitor the system performance at the start of the project, especially with its own metrics.
- Provide a linear increase in load in proportion to the increase in the number of load drivers (in our case, they were goods and stores).
- Eliminate non-linear constructions in the code, use caching to eliminate identical queries to the database.
- If you need to transfer the load from the CPU of the database to the CPU of the application servers, then you can resort to splitting the join requests into simple samples.
- With all the optimizations, remember that a quick query is good, and a quick and frequent query is sometimes bad.
- Try to always probe and use the possibilities of a heterogeneous solution environment.
- Along with traditional performance metrics, use an integral metric that uniquely identifies the presence of degradation; Use this metric to determine the “maximum torque” zone of your system.
- Provide load planning tools with mechanisms to monitor current readings of performance metrics and load rate management to efficiently use system resources
We thank the organizers of Highload for the opportunity to share this experience not only on Habré, but also on the stage of the largest event on high-load systems.
Dmitry Tsvetkov, Alexander Lishchuk, SAP experts at # ITX5
By the way, # ITX5 is looking for SAP consultants.