March 1, 2017 at 13:53
SharePoint 2013/2016 Monitoring: Key Performance Counters
- Tutorial
Hello! My name is Lyubov Volkova, I am a system architect of the business solutions development department. My main specialization is implementation, solution development, technical support for corporate SharePoint portals. Many years of experience allows us to identify the main patterns that affect the performance of the servers included in the typical farm.
The goal of this post is to help administrators of enterprise SharePoint portals develop effective server maintenance plans. The text below summarizes the performance counters that we recommend for inclusion in the daily maintenance plans of the SharePoint 2013/2016 farm servers, as well as practical examples. You can use the data about the counters to manually configure and analyze the indicators of the express monitoring panel, as well as to automate the receipt of notifications if the counters exceed the threshold values for a period of time, the duration of which depends on the requirements and standards adopted by the organization.

There are several universal performance counters that you should monitor for any server system that is part of a SharePoint farm.
The fraction of time that the processor spends on processing all the flow of commands, except idle. This value is equal to the difference between 100% and the percentage of time that the processor spends to complete an idle thread. (An idle instruction stream takes up processor working time in the absence of other instruction flows.) This counter is the primary indicator of processor utilization. It shows the average processor occupancy over the measurement interval.
It is necessary to monitor the performance and maintain the workload of all processors at a level no higher than 75%. At higher congestion levels, the system will not be able to cope with sudden bursts of activity. This will also avoid the “domino effect” when a failure of one component causes a malfunction of the other components. For example, if you have three web servers, you need to make sure that the average CPU load on all servers is less than 60%, so that if one of them fails, the other two processors can handle the additional load.
The average speed, in events per second, at which the processor receives and services hardware interrupts. This value does not include deferred procedure calls, which are counted separately. This value is an indirect indicator of the activity of devices that form hardware interrupts, such as the system timer, mice, disk drivers, data lines, network adapters, and other peripheral devices. These devices usually interrupt the processor when it shuts down or when it becomes necessary to process the request. In this case, the normal execution of the flow of commands is suspended. A system timer usually interrupts the processor every 10 milliseconds, creating a 'background' of hardware interrupts. Therefore, this value displays the difference between the values of the last two samples,
Counter readings are processor dependent; a suitable starting value is 1,000 interrupts per second. A significant increase in the value of this counter without a corresponding increase in system activity indicates a problem and may be associated with the operation of a network adapter, disk, or other equipment causing interruptions.
The current processor queue length, measured by the number of threads waiting. All processors use one common queue, in which threads wait for processor cycles. This counter does not include threads that are currently running. For processor time, there is one queue even on computers with multiple processors. Therefore, if a computer has several processors, it is necessary to divide this value by the number of processors serving the load.
This counter reflects the current value and is not an average value over a certain time interval.
A continuous processor queue of less than five threads per processor is generally acceptable, and also depends on the workload. Values above the threshold usually indicate processor congestion.
Shows the current size of the process working set cache (in bytes). A working set is a set of memory pages that have been recently used by process threads. If the amount of free memory on the computer exceeds the threshold value, unused pages are stored in the working set of the process event. When free memory falls below a threshold, pages are deleted from working sets. If they are needed, they will be transferred to the working set when the RAM error is resolved before being unloaded from the RAM.
This counter can indicate both system-wide problems and problems associated with a particular process. A significant increase or decrease in the size of the working sets leads to swapping.
The recommended setting for the swap file is “RAM + 10”.
If deletion from work sets occurs, you must add a counter “Process (*) \ Work set” to find out which processes are affected by the problem.
It is recommended to additionally compare the readings of this counter with the value of the counter “Memory \ Resident bytes of the system cache” to determine whether system-wide deletion of pages from working sets occurs.
The readings of this counter must be analyzed together with the data of the system counter "Processor \% CPU utilization" for the _Total object. If the load on all processors exceeds thresholds, then the data on the loading of the ASP.Net process will help determine whether this process is the source of the problem.
SharePoint processes that are recommended to be included in monitoring:
Shows the current number of bytes allocated to a process that cannot be shared with other processes.
This counter can be used to detect memory leaks for processes.
For SharePoint processes, compare the value of this counter with the cache size for the same processes to determine if there is a memory leak. An increase in the number of exclusive bytes for a process, accompanied by a similar increase in its cache size, indicates the correct behavior (no memory leak).
Shows the amount of virtual address space (in bytes) that the process is currently using.
It is used to determine if processes are using a large amount of virtual memory.
The number of threads in this process that are currently active. Values above 2000 require increased attention from the system administrator, and 10000 is a threshold value at which there may already be a noticeable decrease in IIS performance, and as a result, the work of the corporate portal.
The speed of sending and receiving data through a network adapter. If this speed exceeds 40-50 percent of the network bandwidth, additional clarification of the reasons may be required.
The average length of the disk request queue. Displays the number of disk requests waiting to be processed during a certain time interval. A queue of no more than 2 for a single disk is considered normal. If there are more than two requests in the queue, then perhaps the disk is overloaded and does not have time to process incoming requests. You can specify the exact operations that the disk cannot handle, using the “Average number of read requests” and “Average length of the write to disk” counters.
The average number of read requests that have been queued for the corresponding drive during the measurement interval.
The average number of write requests that have been queued for the corresponding disk during the measurement interval.
The speed at which data is transferred from this disk during read operations.
The speed at which data is transferred to this disk during write operations.
Based on the values of the counters, we can conclude that the load on the disk system is minimal and is not a bottleneck in the system.
This counter shows the amount of physical memory available for allocation. If there is not enough memory, the page file will be used more intensively, and the number of page errors per second will increase. If the value of this counter is less than 2 GB on the web server, you need to mutilate the memory.
Percentage of committed memory (Committed Bytes) to dedicated memory limit (Commit Limit). This value reflects the actual used amount of available virtual memory. Please note that the limit of the allocated memory can be changed if the page file (page file) is increased. This value is a specific current value, and is not an average value over a certain time interval.
Threshold value: 70% for warning, more than 90% - critical. At higher values, it is enough to increase the amount of memory.
The counter shows the average number of page errors per second. Measured by the number of failed page reads per second. Page errors occur when there is a process of requesting a page in memory, and then the system cannot find it in the requested location. If the requested page is not found in memory, this error is called soft page fault . If the requested page needs to be restored from disk, this error is called hard page fault .
Entering pages / sec is the number of pages read from the disk when resolving links to pages that are not in memory at the time the link was processed. A page error occurs when a thread refers to a virtual memory page that is not in the working set of RAM. This counter also takes into account the swap (page exchange) performed by the system cache to access the data requested by the applications. This is an important source of information for identifying excessive memory load and resulting in excessive page exchange. The recommended warning threshold is 1000.
The counter value shows how many read operations per unit of time, regardless of page, were done while processing page interrupts. This counter shows that the working set of the process is too large for physical memory, and there is a page-by-page exchange with the disk. Displays only the number of read operations, excluding the number of pages retrieved for each operation. Large readings indicate a memory bottleneck. Excessive pumping can slow down the response and its instability.
Counters Page input / second and Read pages / second should be considered together. The first of them contains the number of pages read from the disk, and the second contains the number of read operations performed while swapping. These counters take into account Hard Page Faults — memory access operations in which the desired data page is not in physical memory. Thus, if Exchange pages / sec, Read pages / sec, Enter pages / sec are constantly at a high level, then we can assume that the operating system is actively working with the page file, which, in turn, indicates a lack of memory. Entering pages / sec. The value of this counter must be higher than or equal to the value Reading pages / sec.
This counter shows the frequency of errors when searching for a page in the file system cache. This may be a software error if the page is found in memory, or a hardware error if the page is on disk.
Active use of the cache for read and write operations can greatly affect server performance. It is necessary to monitor the increase in the number of cache errors, which is indicated by a decrease in the value of Asynchronous fast reads / s or Forward reads / s .
The speed of reading and writing pages to disk to resolve serious page crashes. This value is the sum of the values Input pages / sec and Output pages / sec. Counter readings are the main indicator of the types of failures that lead to delays throughout the system. It shows the number of pages received to compensate for page faults in the file system cache. These pages are typically required by applications. The value of this counter must not exceed 10.
The size (in bytes) of the nonpaged pool. A non-paged pool is a virtual memory area of the system that is used for objects that cannot be written to disk and must remain in physical memory for the entire duration of their existence. This counter only reflects the current value, not the average value.
Requests for allocation of space in a special system memory area, where the components of the operating system request the place they need to function. Pages of a non-paged page pool cannot be uploaded to a page file (page file) on disk and remain in RAM for the entire period of their use. This counter reflects the current value, and is not an average value over a certain time interval.
The counter should not exceed the minimum of two values, - 2x RAM and 128 GB.
If \ Memory \ Exchange pages / sec, \ Memory \ Read pages / sec, Memory \ Enter pages / sec are always at a high level, and \ Memory \ Cache errors / sec is low, then we can assume that the operating system is active works with the swap file, which, in turn, indicates a lack of memory. However, if \ Memory \ Cache Errors / s is also high, then most likely the situation is caused by the active work with large files displayed in memory. This usually does not take much time.
Indicators of the average amount of physical memory are normal. There are no indications for an increase in its volume. The average percentage of used physical memory is normal (65%), but approaches a threshold of 70%.
Relatively high error rates are observed when accessing memory pages in combination with a small number of read operations performed during swapping. Counter readings Entry of pages / sec is normal and significantly below the threshold value. The page exchange / sec (15+) counter values exceed the threshold value of 10. It can be assumed that the system periodically actively uses the page file. One of the most common reasons for this behavior of the system is downloading large volumes of files to the portal.
Percentage of paging file (page file) currently in use.
The maximum use of the page file (page file) in percent.
The server page file, also known as the page file, contains the “virtual” memory addresses on the disk. Page errors occur when the process needs to be stopped and wait until the necessary "virtual" resources are copied from disk to memory. There will be more if the amount of physical memory is not enough.
Note that for SharePoint, it is recommended that you set the page file size to 150% of RAM. The absolute minimum should be the value of RAM + 1 MB.
Track the amount of physical memory available for allocation. If there is not enough memory, the page file will be used more intensively, and the number of page errors per second will increase.
The number of times the application restarts during the lifetime of the web server. The value of this counter increases after each occurrence of the Application_OnEnd event (termination of the web application). Restarting the application can occur as a result of changes to the Web.config file, changes to assemblies in the \ Bin directory of the application, or a large number of changes to web form pages. An unexpected increase in this value may be due to the fact that the shutdown of the web application occurred as a result of unforeseen circumstances. In this case, it is necessary to analyze the causes of the problems as soon as possible. The value of this counter should go to zero.
The total number of requests rejected due to a request queue overflow. Requests are often rejected due to insufficient server resources to process them. This value corresponds to the number of HTTP error codes 503 returned, meaning the server is busy. Examples of the reasons for the lack of resources: a large number of requests to the web server, a large number of slow requests (not optimized) to the DBMS, do not correctly work out the solution components written by third-party developers. Thus, in order to identify the cause of the lack of resources on the server and eliminate it, you need to carry out a more detailed analysis of the web server using additional tools.
The MS SharePoint web application provides standard blocks for HTML pages that are displayed in the user's browser via HTTP and require preliminary data processing and processing (web parts, user controls, etc.). To prepare the final data processing result that is presented to the user on the corporate portal web page, one or several queries to the database, file system, etc. may be required. This counter shows the number of queries awaiting processing. The maximum default value for this counter is 5000. This parameter can be changed in the Machine.config file. The value of this counter should not exceed 70-75% of the threshold value, i.e. 3500-3750.
The amount of restarting workflow on the server. The workflow can be restarted when an unexpected error occurs or during deliberate actions. The reasons for restarting the workflow can also be: high memory consumption by the application and processor load, restart is defined in the application pool settings. In the case of frequent reboots of the workflow, the response of the web resource, when the user contacts, will take a long time.
The value of this counter should go to zero.
Waiting time for the last request in the processing queue in milliseconds. With the increase in the number of wait events, users will notice a decrease in performance when displaying web pages. With the increase in the number of wait events, users will notice a decrease in performance when displaying pages.
The number of queries executed per second. Represents the current application bandwidth. Under constant load, this number should remain in a certain range, prohibiting other server operations (such as garbage collection, cache flush flow, external server tools, etc.).
Data indicators of almost all ASP.Net counters tend to zero in combination with small values of the number of requests per second. You should pay attention to the high number of restarts of the web application (Application Restarts counter). We can assume that users periodically experience problems with the availability of the web resource, so the administrator of the corporate portal needs to find out and eliminate the causes of frequent crashes in the web application.
Garbage collection for generation 0 (# Gen 0 Collections) - the number of times that generation 0 (i.e., the objects added last) was retrieved by the garbage collector since the application started.
Garbage collection for generation 1 (# Gen 1 Collections) - the number of times the generation of garbage collection objects has been collected by the garbage collector since the application started.
Garbage Collection for Generation 2 (# Gen 2 Collections) - The number of times Generation 2 objects have been collected by the garbage collector since the application started. This counter is incremented by 1 after garbage collection for generation 2 is complete (also called full garbage collection).
When monitoring, it is necessary to pay attention to the relation of “garbage collection for generation 0: garbage collection for generation 1: garbage collection for generation 2”, make sure that the number of garbage collection for generation 2 does not significantly exceed the number of collection for generation 0. The optimal ratio is 2.
Displays the percentage of time spent collecting garbage after the last garbage collection cycle. This counter usually indicates the work done by the garbage collector to extract and compress memory on behalf of the application. This counter is only updated at the end of each garbage collection. This counter does not show the average, but the last observed value. In normal mode, the counter value should not exceed 5%.
The number of exceptions generated per second. This counter counts both processed and unhandled exceptions. It is assumed that exceptions occur only in rare cases and do not occur in the normal course of program execution; This counter was introduced in order to signal potential performance problems in cases where the frequency of generating exceptions is too high (> 100). This counter does not provide time averaging; it shows the ratio of the difference between the values observed in the last two measurements to the interval between measurements.
The value of this counter should go to zero.
The readings of the counters from this group are considered in relation to a specific instance of the object, the corporate portal web application, for example, “SharePoint - 80”.
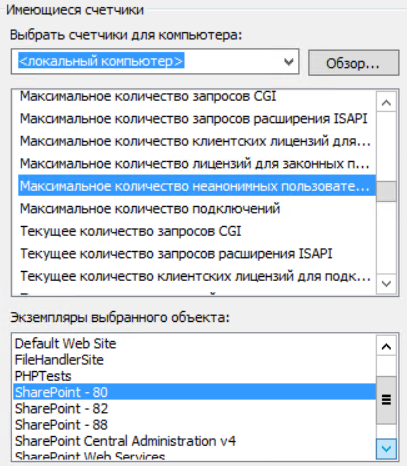
The number of connections to the web service currently established. The higher the value, the greater the load on the SharePoint server.
ISAPI(Internet Server Application Programming Interface) is a set of interfaces provided by the MS IIS (Internet Information Services) web server for writing applications that interact with this server and expand its capabilities. ISAPI applications are dynamic link libraries (DLLs) that directly interact with the IIS API. ISAPI applications are loaded and executed in the IIS address space, so the server does not need to create a new process with every HTTP request. Since Windows loads the dynamically linked library once upon the first call to the function in the DLL, the ISAPI application remains loaded and is not deleted until the web server is stopped / turned off (if ISAPI caching is enabled) or the application is not unloaded explicitly (if caching turned off).
A counter gives an indication of the frequency of ISAPI extension requests received by the web service.
The counter shows the average execution time of SQL queries. The return value should be as low as possible. The readings of this counter are significantly affected by the data on the load on the basic subsystems and their physical characteristics (memory, processor, network, disk devices). The readings of this counter are also affected by:
The counter returns the number of currently executing SQL queries. The value of the counter substantially depends on the specifics of the functionality implemented on the portal. The analysis of values must be carried out taking into account the specifics of content processing: working with basic lists and libraries, using groupings and filters in the presentation of data, lookup fields, accessing lists with external data, processing requests to external data sources, or processing lists with a large number items and more.
The counter returns the average runtime (in ms) of web page requests that were processed during data collection. Statistics include request data for dynamic web pages, the construction of which is provided by ASP.Net.
The counter value shows the number of current requests that are being processed. They can differ significantly in different periods and depend on the current number of calls to the SharePoint portal. The most important is the analysis of readings during peak hours in combination with indicators about the average execution of web page requests (Executing Time / Page Request) and data on the number of currently executing SQL queries.
The percentage of rejected pages when performing a request to them. The return value should be as low as possible, as indicates that the pages were not requested from the cache and required the completion of a full request cycle of the web page on the server.
The counter value displays the number of incoming requests in the last second. Similarly, Current Page Requests in relation to a strictly defined time interval - 1s.
The counter returns the number of threads that are currently running in the SharePoint code. The indicators depend on many factors: the processor and its characteristics, indicators on the basic subsystems (memory, processor, network, disk devices), the current load on the portal. The initiation of additional flows can be initiated programmatically in code as part of solutions for the SharePoint platform.
Based on the average values of the readings from the SharePoint Foundation counters, it can be assumed that during the operation of the corporate portal there is no high load associated with users accessing the web server.
Microsoft SQL Server uses the Microsoft Windows Server operating system I / O system calls to perform disk read and write operations. SQL Server determines when and how to perform disk I / O, but Windows does the basic I / O.
The following describes the minimum set of meters that are recommended to be monitored in daily maintenance plans.
Time in seconds spent on average per read operation from disk. Shows the average time a disk read has completed. Basic indicators of this counter should not exceed 15 ms. If the execution time of the read operations on average exceeds this value for a sufficiently long time, then this may indicate the presence of problems in the input-output device.
Average disk write time is the time in seconds spent on average per write operation to disk. Basic indicators of this counter should not exceed 15 ms.
The “Average time to read from disk” and “Average time to write to disk” counters measure latency directly in the software add-in where the storage device disks become available to the operating system. They allow you to accurately measure how much time the drives and hardware have spent servicing I / O requests, regardless of the hardware or software involved.
For OLTP systems, the average value should be less than 15 ms with valid peaks of up to 25 ms. The less time it takes to read or write data, the faster the system will function.
Microsoft SQL Server Instance Monitoring allows you to determine if CPU utilization levels are within standard ranges. A constant high level of CPU utilization may indicate the need to upgrade the CPU or the need to add multiple processors. Optimizing your application can reduce CPU utilization. The processor system is heavily loaded with operations:
The following is a description of meters that are recommended to be monitored in daily maintenance plans.
SQL compiles completed in a second. Indicates the number of times the code compilation path was entered. Includes compilation operations caused by recompilation at the statement level in SQL Server. The SQL Server "SQL Statistics in Microsoft SQL Server" object provides counters to monitor the compilation and types of queries sent to an instance of SQL Server. Monitoring the number of compilation and recompilation of queries and the number of packages received by an instance of SQL Server gives you an idea of how quickly SQL Server executes user queries and how efficiently the query optimizer processes them. Compilation takes a considerable part of the time in processing the request. To save on compilation costs, the Database Engine stores the compiled query plan in the query cache. The goal of caching is to reduce the number of compilations by storing already compiled requests for future reuse, eliminating the need to re-compile similar requests that may come later. However, each unique request must be compiled at least once. Request compilation can be caused by the following factors:
The counter indicates the number of threads received from operating system schedulers (not from SQL schedulers) to perform operations for other threads in standby state. For the Batch Requests / sec counter, a threshold value is used, approximately 5,000 times the number of processors in the server. This value can also be high in systems with hyper-threading enabled and low CPU utilization.
The average number of recompilations per second. The lower the value of this characteristic, the better.
Workfiles are part of the data file pages dedicated to the internal needs of SQL Server. SQL Server actively uses Workfiles to perform hash operations and store intermediate hash results. A large number of Workfiles created may indirectly indicate the absence of indexes that SQL Server can use to perform table join operations, as a result of which it is forced to perform table joins through hashing. The norm for the ratio of Workfiles Created / sec to Batch Requests / sec is no more than 20%. Workfiles are created in a temporary database for processing requests that are too large to fit in RAM.
Shows the number of threads waiting to be executed on the processor. SQL Server is controlled by schedulers in the DBMS mechanism, where the server queues and processes its own queries. Because SQL Server operates on its own, it uses only one CPU thread for each logical processor. This means that there must be a minimum number of threads in the processor queue for a system designed for SQL Server.
Calculation of values, based on which one of the prerequisites for processor overload can be identified:
By default, SQL Server changes its memory requirements dynamically based on available system resources.
If SQL Server needs more memory, it queries the operating system to determine if free physical memory is available and uses it. If SQL Server does not need the memory allocated for it, it frees it up for the operating system. It is necessary to abandon the dynamic use of memory, since upon reaching the Memory: Available Bytes threshold of 100 ... 50 MB, Windows will enable aggressive trimming of working process sets, including system drivers, which will lead to a sharp decrease in the performance of all OS components. To avoid this problem on the DBMS server, you need to set values for the Min Server Memory and Max Server Memory server configuration parameters.
The description below provides calculations on one of the real-life examples of SQL Server that combines two SQL instances, one of which is dedicated to SharePoint databases.
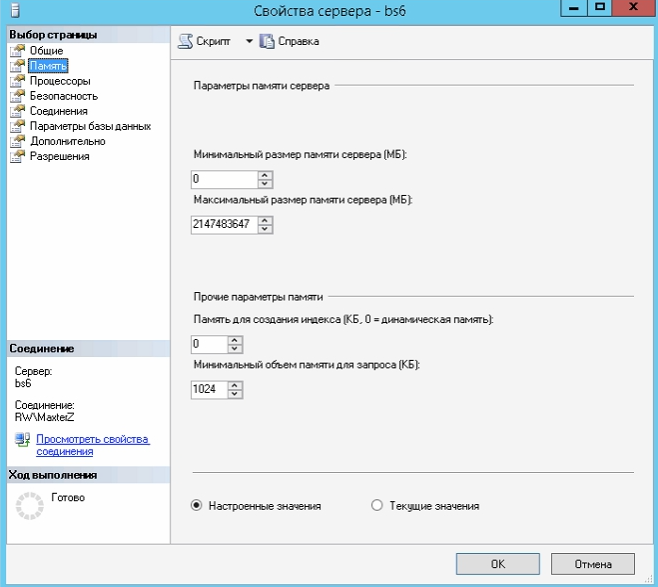
The existing b6s SQL instance is allocated 2147483647 Mb, that is, SQL Server has all the server memory available - 96 GB.
To calculate Max Server Memory, the following formula is used (for non-clustered SQL Server):
SQL maximum RAM size = TotalPhyMem - ( NumOfSQLThreads * ThreadStackSize ) - (1GB * ROUNDDOWN ( NumOfCores / 4)) - RAMOSReserve d - RAMForOtherApps , where:

You can get information about the processors and the amount of physical memory on the server using the following script:
For b6s, the calculations will be as follows:
SQL maximum RAM size = 98276 Mb - (480 * 2 Mb) - (1GB * ROUNDDOWN (32/4)) - 11793 Mb - 8000 Mb = 98276 Mb - 960 Mb - 8192 Mb - 11793 Mb - 8000 Mb = 69331 Mb.
Thus, the size of the buffer pool (with the corresponding value of "Max Server Memory") can grow up to 69331 MB, thereby, without affecting the operation of the operating system.
The following is a description of the counters for monitoring memory used by SQL Server, the monitoring of which is recommended to be included in daily monitoring.
The counter data provides information about the ideal amount of memory required by the server.
The counter data provides information about the amount of memory allocated to the server by the memory manager. If Total Server Memory is smaller than Target Server Memory is a sign of low memory.
The percentage of pages found in the buffer cache without being read from disk. This value is defined as the total number of hits in the cache divided by the number of qualifying cache requests for the last several thousand page access operations. After a long period, this ratio changes very slightly. Since reading from the cache is much faster than from disk, you should strive for the highest value of this indicator.
Indicates the average page lifetime in the buffer pool. The threshold value is at least 300 seconds.
Indicates the total number of processes waiting to be provided with working memory.
Values are within the normal range, but it should be noted that Total Server Memory is smaller than Target Server Memory. This is usually a sign of running out of memory, but in this case the situation looks different, because SQL Server requests memory as needed. If the memory requirements are not significant, then Total Server Memory will remain much lower than Target Server Memory. SQL Server memory requirements for MS SharePoint Foundation 2013 are 8-16 GB for use in a production environment in a single server farm ( more here ). Thus, at the moment, an increase in memory on the DBMS server is not required.
If you get to the end of the text, it means that you are really digging deep into the SharePoint Server administration topic. You may have questions that are outside the scope of this text. Feel free to post them in the comments.
The goal of this post is to help administrators of enterprise SharePoint portals develop effective server maintenance plans. The text below summarizes the performance counters that we recommend for inclusion in the daily maintenance plans of the SharePoint 2013/2016 farm servers, as well as practical examples. You can use the data about the counters to manually configure and analyze the indicators of the express monitoring panel, as well as to automate the receipt of notifications if the counters exceed the threshold values for a period of time, the duration of which depends on the requirements and standards adopted by the organization.
System counters
There are several universal performance counters that you should monitor for any server system that is part of a SharePoint farm.
CPU
% CPU utilization (_Total) \% Processor Time
The fraction of time that the processor spends on processing all the flow of commands, except idle. This value is equal to the difference between 100% and the percentage of time that the processor spends to complete an idle thread. (An idle instruction stream takes up processor working time in the absence of other instruction flows.) This counter is the primary indicator of processor utilization. It shows the average processor occupancy over the measurement interval.
It is necessary to monitor the performance and maintain the workload of all processors at a level no higher than 75%. At higher congestion levels, the system will not be able to cope with sudden bursts of activity. This will also avoid the “domino effect” when a failure of one component causes a malfunction of the other components. For example, if you have three web servers, you need to make sure that the average CPU load on all servers is less than 60%, so that if one of them fails, the other two processors can handle the additional load.
Interrupt / s (Interrupts / sec)
The average speed, in events per second, at which the processor receives and services hardware interrupts. This value does not include deferred procedure calls, which are counted separately. This value is an indirect indicator of the activity of devices that form hardware interrupts, such as the system timer, mice, disk drivers, data lines, network adapters, and other peripheral devices. These devices usually interrupt the processor when it shuts down or when it becomes necessary to process the request. In this case, the normal execution of the flow of commands is suspended. A system timer usually interrupts the processor every 10 milliseconds, creating a 'background' of hardware interrupts. Therefore, this value displays the difference between the values of the last two samples,
Counter readings are processor dependent; a suitable starting value is 1,000 interrupts per second. A significant increase in the value of this counter without a corresponding increase in system activity indicates a problem and may be associated with the operation of a network adapter, disk, or other equipment causing interruptions.
System
Processor Queue Length
The current processor queue length, measured by the number of threads waiting. All processors use one common queue, in which threads wait for processor cycles. This counter does not include threads that are currently running. For processor time, there is one queue even on computers with multiple processors. Therefore, if a computer has several processors, it is necessary to divide this value by the number of processors serving the load.
This counter reflects the current value and is not an average value over a certain time interval.
A continuous processor queue of less than five threads per processor is generally acceptable, and also depends on the workload. Values above the threshold usually indicate processor congestion.
Process
Working Set for _Total instance
Shows the current size of the process working set cache (in bytes). A working set is a set of memory pages that have been recently used by process threads. If the amount of free memory on the computer exceeds the threshold value, unused pages are stored in the working set of the process event. When free memory falls below a threshold, pages are deleted from working sets. If they are needed, they will be transferred to the working set when the RAM error is resolved before being unloaded from the RAM.
This counter can indicate both system-wide problems and problems associated with a particular process. A significant increase or decrease in the size of the working sets leads to swapping.
The recommended setting for the swap file is “RAM + 10”.
If deletion from work sets occurs, you must add a counter “Process (*) \ Work set” to find out which processes are affected by the problem.
It is recommended to additionally compare the readings of this counter with the value of the counter “Memory \ Resident bytes of the system cache” to determine whether system-wide deletion of pages from working sets occurs.
% CPU utilization (% Processor Time) for SharePoint processes
The readings of this counter must be analyzed together with the data of the system counter "Processor \% CPU utilization" for the _Total object. If the load on all processors exceeds thresholds, then the data on the loading of the ASP.Net process will help determine whether this process is the source of the problem.
SharePoint processes that are recommended to be included in monitoring:
- w3wp;
- mssearch;
- noderunner;
- miiserver.
Private Bytes for SharePoint Processes
Shows the current number of bytes allocated to a process that cannot be shared with other processes.
This counter can be used to detect memory leaks for processes.
For SharePoint processes, compare the value of this counter with the cache size for the same processes to determine if there is a memory leak. An increase in the number of exclusive bytes for a process, accompanied by a similar increase in its cache size, indicates the correct behavior (no memory leak).
Virtual Bytes for SharePoint Processes
Shows the amount of virtual address space (in bytes) that the process is currently using.
It is used to determine if processes are using a large amount of virtual memory.
Handle Count for w3wp process
The number of threads in this process that are currently active. Values above 2000 require increased attention from the system administrator, and 10000 is a threshold value at which there may already be a noticeable decrease in IIS performance, and as a result, the work of the corporate portal.
Network adapter
Bytes Total / Sec (Bytes Total / Sec)
The speed of sending and receiving data through a network adapter. If this speed exceeds 40-50 percent of the network bandwidth, additional clarification of the reasons may be required.
Logical Disk
Avg. Disk Queue Length
The average length of the disk request queue. Displays the number of disk requests waiting to be processed during a certain time interval. A queue of no more than 2 for a single disk is considered normal. If there are more than two requests in the queue, then perhaps the disk is overloaded and does not have time to process incoming requests. You can specify the exact operations that the disk cannot handle, using the “Average number of read requests” and “Average length of the write to disk” counters.
Avg. Disk Read Queue Length
The average number of read requests that have been queued for the corresponding drive during the measurement interval.
Avg. Disk Write Queue Length
The average number of write requests that have been queued for the corresponding disk during the measurement interval.
Disk Reads (bytes / s) (Disk Reads / sec)
The speed at which data is transferred from this disk during read operations.
Disk Write Speed (Bytes / s) (Disk Writes / sec)
The speed at which data is transferred to this disk during write operations.
Example of counter readings on the disk subsystem
| Average disk queue length | Average disk read queue length | Average disk write queue length | Read speed from disk (bytes / s) | Disk write speed (bytes / s) |
|---|---|---|---|---|
| 0.015 | 0.004 | 0.011 | 0.723 | 9,578 |
Based on the values of the counters, we can conclude that the load on the disk system is minimal and is not a bottleneck in the system.
Memory
Available Mbytes
This counter shows the amount of physical memory available for allocation. If there is not enough memory, the page file will be used more intensively, and the number of page errors per second will increase. If the value of this counter is less than 2 GB on the web server, you need to mutilate the memory.
% dedicated memory usage (% Committed Bytes In Use)
Percentage of committed memory (Committed Bytes) to dedicated memory limit (Commit Limit). This value reflects the actual used amount of available virtual memory. Please note that the limit of the allocated memory can be changed if the page file (page file) is increased. This value is a specific current value, and is not an average value over a certain time interval.
Threshold value: 70% for warning, more than 90% - critical. At higher values, it is enough to increase the amount of memory.
Page Faults / sec (Page Faults / sec)
The counter shows the average number of page errors per second. Measured by the number of failed page reads per second. Page errors occur when there is a process of requesting a page in memory, and then the system cannot find it in the requested location. If the requested page is not found in memory, this error is called soft page fault . If the requested page needs to be restored from disk, this error is called hard page fault .
Page Input / sec
Entering pages / sec is the number of pages read from the disk when resolving links to pages that are not in memory at the time the link was processed. A page error occurs when a thread refers to a virtual memory page that is not in the working set of RAM. This counter also takes into account the swap (page exchange) performed by the system cache to access the data requested by the applications. This is an important source of information for identifying excessive memory load and resulting in excessive page exchange. The recommended warning threshold is 1000.
Reading pages / sec (Page Reads / sec)
The counter value shows how many read operations per unit of time, regardless of page, were done while processing page interrupts. This counter shows that the working set of the process is too large for physical memory, and there is a page-by-page exchange with the disk. Displays only the number of read operations, excluding the number of pages retrieved for each operation. Large readings indicate a memory bottleneck. Excessive pumping can slow down the response and its instability.
Counters Page input / second and Read pages / second should be considered together. The first of them contains the number of pages read from the disk, and the second contains the number of read operations performed while swapping. These counters take into account Hard Page Faults — memory access operations in which the desired data page is not in physical memory. Thus, if Exchange pages / sec, Read pages / sec, Enter pages / sec are constantly at a high level, then we can assume that the operating system is actively working with the page file, which, in turn, indicates a lack of memory. Entering pages / sec. The value of this counter must be higher than or equal to the value Reading pages / sec.
Cache Errors / s (Cache Faults)
This counter shows the frequency of errors when searching for a page in the file system cache. This may be a software error if the page is found in memory, or a hardware error if the page is on disk.
Active use of the cache for read and write operations can greatly affect server performance. It is necessary to monitor the increase in the number of cache errors, which is indicated by a decrease in the value of Asynchronous fast reads / s or Forward reads / s .
Page Exchange / sec (Pages / sec)
The speed of reading and writing pages to disk to resolve serious page crashes. This value is the sum of the values Input pages / sec and Output pages / sec. Counter readings are the main indicator of the types of failures that lead to delays throughout the system. It shows the number of pages received to compensate for page faults in the file system cache. These pages are typically required by applications. The value of this counter must not exceed 10.
Byte in Nonpaged Pool (Pool Nonpaged Bytes)
The size (in bytes) of the nonpaged pool. A non-paged pool is a virtual memory area of the system that is used for objects that cannot be written to disk and must remain in physical memory for the entire duration of their existence. This counter only reflects the current value, not the average value.
Requests for allocation of space in a special system memory area, where the components of the operating system request the place they need to function. Pages of a non-paged page pool cannot be uploaded to a page file (page file) on disk and remain in RAM for the entire period of their use. This counter reflects the current value, and is not an average value over a certain time interval.
The counter should not exceed the minimum of two values, - 2x RAM and 128 GB.
General recommendations for analyzing memory counter performance
If \ Memory \ Exchange pages / sec, \ Memory \ Read pages / sec, Memory \ Enter pages / sec are always at a high level, and \ Memory \ Cache errors / sec is low, then we can assume that the operating system is active works with the swap file, which, in turn, indicates a lack of memory. However, if \ Memory \ Cache Errors / s is also high, then most likely the situation is caused by the active work with large files displayed in memory. This usually does not take much time.
Example memory counter readings
| Available Mb | %
usage of allocated memory | Page Errors / s | Page input / s | Reading pages / s | Обмен страниц /с | Байт в невы- гружа- емом пуле |
|---|---|---|---|---|---|---|
| 6312,758 | 65 | 605,378 | 15,936 | 1,105 | 15,995 | 115352406 |
Indicators of the average amount of physical memory are normal. There are no indications for an increase in its volume. The average percentage of used physical memory is normal (65%), but approaches a threshold of 70%.
Relatively high error rates are observed when accessing memory pages in combination with a small number of read operations performed during swapping. Counter readings Entry of pages / sec is normal and significantly below the threshold value. The page exchange / sec (15+) counter values exceed the threshold value of 10. It can be assumed that the system periodically actively uses the page file. One of the most common reasons for this behavior of the system is downloading large volumes of files to the portal.
Swap file
% use (% Used)
Percentage of paging file (page file) currently in use.
% utilization (peak) (% Used Peak)
The maximum use of the page file (page file) in percent.
The server page file, also known as the page file, contains the “virtual” memory addresses on the disk. Page errors occur when the process needs to be stopped and wait until the necessary "virtual" resources are copied from disk to memory. There will be more if the amount of physical memory is not enough.
Note that for SharePoint, it is recommended that you set the page file size to 150% of RAM. The absolute minimum should be the value of RAM + 1 MB.
Track the amount of physical memory available for allocation. If there is not enough memory, the page file will be used more intensively, and the number of page errors per second will increase.
SharePoint Server Performance Counters
ASP.Net and ASP.Net Application
ASP.Net. Application Restarts
The number of times the application restarts during the lifetime of the web server. The value of this counter increases after each occurrence of the Application_OnEnd event (termination of the web application). Restarting the application can occur as a result of changes to the Web.config file, changes to assemblies in the \ Bin directory of the application, or a large number of changes to web form pages. An unexpected increase in this value may be due to the fact that the shutdown of the web application occurred as a result of unforeseen circumstances. In this case, it is necessary to analyze the causes of the problems as soon as possible. The value of this counter should go to zero.
ASP.Net. Requests Rejected
The total number of requests rejected due to a request queue overflow. Requests are often rejected due to insufficient server resources to process them. This value corresponds to the number of HTTP error codes 503 returned, meaning the server is busy. Examples of the reasons for the lack of resources: a large number of requests to the web server, a large number of slow requests (not optimized) to the DBMS, do not correctly work out the solution components written by third-party developers. Thus, in order to identify the cause of the lack of resources on the server and eliminate it, you need to carry out a more detailed analysis of the web server using additional tools.
ASP.Net. Requests Queued
The MS SharePoint web application provides standard blocks for HTML pages that are displayed in the user's browser via HTTP and require preliminary data processing and processing (web parts, user controls, etc.). To prepare the final data processing result that is presented to the user on the corporate portal web page, one or several queries to the database, file system, etc. may be required. This counter shows the number of queries awaiting processing. The maximum default value for this counter is 5000. This parameter can be changed in the Machine.config file. The value of this counter should not exceed 70-75% of the threshold value, i.e. 3500-3750.
ASP.Net. Worker Process Restarts
The amount of restarting workflow on the server. The workflow can be restarted when an unexpected error occurs or during deliberate actions. The reasons for restarting the workflow can also be: high memory consumption by the application and processor load, restart is defined in the application pool settings. In the case of frequent reboots of the workflow, the response of the web resource, when the user contacts, will take a long time.
The value of this counter should go to zero.
ASP.Net. Request Wait Time
Waiting time for the last request in the processing queue in milliseconds. With the increase in the number of wait events, users will notice a decrease in performance when displaying web pages. With the increase in the number of wait events, users will notice a decrease in performance when displaying pages.
ASP.Net application. Requests / Sec
The number of queries executed per second. Represents the current application bandwidth. Under constant load, this number should remain in a certain range, prohibiting other server operations (such as garbage collection, cache flush flow, external server tools, etc.).
ASP.Net Counter Example and ASP.Net Application
| Application restarts | Requests Rejected | Requests Queued | Worker Process Restarts | Request Wait Time | Requests / Sec |
|---|---|---|---|---|---|
| 2,175 | 0 | 0 | 0 | 0 | 0.153 |
Data indicators of almost all ASP.Net counters tend to zero in combination with small values of the number of requests per second. You should pay attention to the high number of restarts of the web application (Application Restarts counter). We can assume that users periodically experience problems with the availability of the web resource, so the administrator of the corporate portal needs to find out and eliminate the causes of frequent crashes in the web application.
Memory CLR .Net (Memory CLR .Net)
Garbage collection
Garbage collection for generation 0 (# Gen 0 Collections) - the number of times that generation 0 (i.e., the objects added last) was retrieved by the garbage collector since the application started.
Garbage collection for generation 1 (# Gen 1 Collections) - the number of times the generation of garbage collection objects has been collected by the garbage collector since the application started.
Garbage Collection for Generation 2 (# Gen 2 Collections) - The number of times Generation 2 objects have been collected by the garbage collector since the application started. This counter is incremented by 1 after garbage collection for generation 2 is complete (also called full garbage collection).
When monitoring, it is necessary to pay attention to the relation of “garbage collection for generation 0: garbage collection for generation 1: garbage collection for generation 2”, make sure that the number of garbage collection for generation 2 does not significantly exceed the number of collection for generation 0. The optimal ratio is 2.
% Time in GC (% Time in GC)
Displays the percentage of time spent collecting garbage after the last garbage collection cycle. This counter usually indicates the work done by the garbage collector to extract and compress memory on behalf of the application. This counter is only updated at the end of each garbage collection. This counter does not show the average, but the last observed value. In normal mode, the counter value should not exceed 5%.
CLR.Net Exceptions (Microsoft .NET CLR Exceptions)
The number of exceptions. Sec (Exceps thrown / sec)
The number of exceptions generated per second. This counter counts both processed and unhandled exceptions. It is assumed that exceptions occur only in rare cases and do not occur in the normal course of program execution; This counter was introduced in order to signal potential performance problems in cases where the frequency of generating exceptions is too high (> 100). This counter does not provide time averaging; it shows the ratio of the difference between the values observed in the last two measurements to the interval between measurements.
The value of this counter should go to zero.
Web Service
The readings of the counters from this group are considered in relation to a specific instance of the object, the corporate portal web application, for example, “SharePoint - 80”.
Number of current connections
The number of connections to the web service currently established. The higher the value, the greater the load on the SharePoint server.
ISAPI Extension Requests / sec
ISAPI(Internet Server Application Programming Interface) is a set of interfaces provided by the MS IIS (Internet Information Services) web server for writing applications that interact with this server and expand its capabilities. ISAPI applications are dynamic link libraries (DLLs) that directly interact with the IIS API. ISAPI applications are loaded and executed in the IIS address space, so the server does not need to create a new process with every HTTP request. Since Windows loads the dynamically linked library once upon the first call to the function in the DLL, the ISAPI application remains loaded and is not deleted until the web server is stopped / turned off (if ISAPI caching is enabled) or the application is not unloaded explicitly (if caching turned off).
A counter gives an indication of the frequency of ISAPI extension requests received by the web service.
SharePoint Foundation Counters
SQL Query Executing time
The counter shows the average execution time of SQL queries. The return value should be as low as possible. The readings of this counter are significantly affected by the data on the load on the basic subsystems and their physical characteristics (memory, processor, network, disk devices). The readings of this counter are also affected by:
- Non-optimized execution plans for T-sql queries that may be involved in the solution code;
- A call to stored procedures that can be used to generate various activities for a portal user;
- The degree to which index performance is optimized.
Executing SQL Queries
The counter returns the number of currently executing SQL queries. The value of the counter substantially depends on the specifics of the functionality implemented on the portal. The analysis of values must be carried out taking into account the specifics of content processing: working with basic lists and libraries, using groupings and filters in the presentation of data, lookup fields, accessing lists with external data, processing requests to external data sources, or processing lists with a large number items and more.
Executing Time / Page Request
The counter returns the average runtime (in ms) of web page requests that were processed during data collection. Statistics include request data for dynamic web pages, the construction of which is provided by ASP.Net.
Current Page Requests
The counter value shows the number of current requests that are being processed. They can differ significantly in different periods and depend on the current number of calls to the SharePoint portal. The most important is the analysis of readings during peak hours in combination with indicators about the average execution of web page requests (Executing Time / Page Request) and data on the number of currently executing SQL queries.
Reject Page Requests Rate
The percentage of rejected pages when performing a request to them. The return value should be as low as possible, as indicates that the pages were not requested from the cache and required the completion of a full request cycle of the web page on the server.
Incoming Page Requests Rate
The counter value displays the number of incoming requests in the last second. Similarly, Current Page Requests in relation to a strictly defined time interval - 1s.
Active threads
The counter returns the number of threads that are currently running in the SharePoint code. The indicators depend on many factors: the processor and its characteristics, indicators on the basic subsystems (memory, processor, network, disk devices), the current load on the portal. The initiation of additional flows can be initiated programmatically in code as part of solutions for the SharePoint platform.
SharePoint Foundation counter sample
| SQL Query Executing time | Executing SQL Queries | Executing Time / Page Requests | Current Page Request | Reject Page Requests Rate | Incoming Page Requests Rate | IActive Threads |
|---|---|---|---|---|---|---|
| 0,048 | 0.051 | 0.197 | 1,581 | 0 | 0.396 | 1,595 |
Based on the average values of the readings from the SharePoint Foundation counters, it can be assumed that during the operation of the corporate portal there is no high load associated with users accessing the web server.
SQL Server Monitoring
Disk Subsystem Control
Microsoft SQL Server uses the Microsoft Windows Server operating system I / O system calls to perform disk read and write operations. SQL Server determines when and how to perform disk I / O, but Windows does the basic I / O.
The following describes the minimum set of meters that are recommended to be monitored in daily maintenance plans.
Physical Disk \ Average Disk Read Time (Physical Disk \ Avg. Disk sec / read)
Time in seconds spent on average per read operation from disk. Shows the average time a disk read has completed. Basic indicators of this counter should not exceed 15 ms. If the execution time of the read operations on average exceeds this value for a sufficiently long time, then this may indicate the presence of problems in the input-output device.
Physical Disk \ Average Disk Write Time (Physical Disk \ Avg. Disk sec / write)
Average disk write time is the time in seconds spent on average per write operation to disk. Basic indicators of this counter should not exceed 15 ms.
The “Average time to read from disk” and “Average time to write to disk” counters measure latency directly in the software add-in where the storage device disks become available to the operating system. They allow you to accurately measure how much time the drives and hardware have spent servicing I / O requests, regardless of the hardware or software involved.
For OLTP systems, the average value should be less than 15 ms with valid peaks of up to 25 ms. The less time it takes to read or write data, the faster the system will function.
CPU usage control
Microsoft SQL Server Instance Monitoring allows you to determine if CPU utilization levels are within standard ranges. A constant high level of CPU utilization may indicate the need to upgrade the CPU or the need to add multiple processors. Optimizing your application can reduce CPU utilization. The processor system is heavily loaded with operations:
- compilation and recompilation of execution plans;
- sorting;
- hashing.
The following is a description of meters that are recommended to be monitored in daily maintenance plans.
<SQL Server Instance> SQL Statistics \ SQL Compilations / sec
SQL compiles completed in a second. Indicates the number of times the code compilation path was entered. Includes compilation operations caused by recompilation at the statement level in SQL Server. The SQL Server "SQL Statistics in Microsoft SQL Server" object provides counters to monitor the compilation and types of queries sent to an instance of SQL Server. Monitoring the number of compilation and recompilation of queries and the number of packages received by an instance of SQL Server gives you an idea of how quickly SQL Server executes user queries and how efficiently the query optimizer processes them. Compilation takes a considerable part of the time in processing the request. To save on compilation costs, the Database Engine stores the compiled query plan in the query cache. The goal of caching is to reduce the number of compilations by storing already compiled requests for future reuse, eliminating the need to re-compile similar requests that may come later. However, each unique request must be compiled at least once. Request compilation can be caused by the following factors:
- Changing the schema, including basic changes (adding columns or indexes to the table) or the statistical schema (inserting or deleting a significant number of rows in the table);
- Changing the environment (SET statement). Changes to session parameters (for example, an ANSI_PADDING or ANSI_NULLS clause may cause a recompilation of a request).
<SQL Server Instance> SQL Statistics \ Batch Requests / sec
The counter indicates the number of threads received from operating system schedulers (not from SQL schedulers) to perform operations for other threads in standby state. For the Batch Requests / sec counter, a threshold value is used, approximately 5,000 times the number of processors in the server. This value can also be high in systems with hyper-threading enabled and low CPU utilization.
<SQL Server Instance> SQL Statistics \ SQL ReCompilations / sec
The average number of recompilations per second. The lower the value of this characteristic, the better.
<SQL Server Instance> Access Methods \ Workfiles Created / sec. Workfiles
Workfiles are part of the data file pages dedicated to the internal needs of SQL Server. SQL Server actively uses Workfiles to perform hash operations and store intermediate hash results. A large number of Workfiles created may indirectly indicate the absence of indexes that SQL Server can use to perform table join operations, as a result of which it is forced to perform table joins through hashing. The norm for the ratio of Workfiles Created / sec to Batch Requests / sec is no more than 20%. Workfiles are created in a temporary database for processing requests that are too large to fit in RAM.
Processor \ Processor Queue Length
Shows the number of threads waiting to be executed on the processor. SQL Server is controlled by schedulers in the DBMS mechanism, where the server queues and processes its own queries. Because SQL Server operates on its own, it uses only one CPU thread for each logical processor. This means that there must be a minimum number of threads in the processor queue for a system designed for SQL Server.
Example of CPU monitoring counter readings
| Batch Requests / sec | SQL Compilations / sec | SQL ReCompilations / sec | Workfiles Created / sec | Processor queue length |
|---|---|---|---|---|
| 19,998 | 0.675 | 0.006 | 1,267 | 0.151 |
Calculation of values, based on which one of the prerequisites for processor overload can be identified:
- Соотношение между SQL Compilations/sec и Batch Requests/sec
0,6/19 = 0.03
Показывает, что в 3% случаев выполнения процедур выполняются компиляции новых запросов. Это говорит о том, что в БД присутствует минимальное число динамических запросов. Рекомендуемое значение SQL Compilations/sec должно составлять менее 10% от значения Batch Requests/sec. Показатель в пределах нормы. - Соотношение между SQL ReCompilations/sec и SQL Compilations/sec
0,006/0,6 = 0.01
Показывает, что в 1% случаев выполняется повторная компиляция ранее скомпилированных запросов. Рекомендуемое значение SQL Recompilations/sec должно составлять менее 10% от значения SQL Compilations/sec. Показатель в пределах нормы. - Соотношение между Workfiles Created/sec и Batch Requests/sec
1/19 = 0.05
Показатель в пределах нормы.
| Batch Requests/sec | Отношение SQL Compilations/sec к Batch Requests/sec | Отношение SQL ReCompilations/sec к SQL Compilations/sec | Отношение Workfiles Created/sec к Batch Requests/sec |
|---|---|---|---|
| Средний показатель в рассматриваемой системе в рабочее время | 0,034 | 0,01 | 0,06 |
| Рекомендуемое значение показателя | Не более 0.1 | Не более 0.1 | Не более 0.2 |
| Выполняемость рекомендаций в рассматриваемой системе | да | да | да |
Мониторинг использования памяти
Максимальный размер выделяемой памяти
By default, SQL Server changes its memory requirements dynamically based on available system resources.
If SQL Server needs more memory, it queries the operating system to determine if free physical memory is available and uses it. If SQL Server does not need the memory allocated for it, it frees it up for the operating system. It is necessary to abandon the dynamic use of memory, since upon reaching the Memory: Available Bytes threshold of 100 ... 50 MB, Windows will enable aggressive trimming of working process sets, including system drivers, which will lead to a sharp decrease in the performance of all OS components. To avoid this problem on the DBMS server, you need to set values for the Min Server Memory and Max Server Memory server configuration parameters.
The description below provides calculations on one of the real-life examples of SQL Server that combines two SQL instances, one of which is dedicated to SharePoint databases.
The existing b6s SQL instance is allocated 2147483647 Mb, that is, SQL Server has all the server memory available - 96 GB.
To calculate Max Server Memory, the following formula is used (for non-clustered SQL Server):
SQL maximum RAM size = TotalPhyMem - ( NumOfSQLThreads * ThreadStackSize ) - (1GB * ROUNDDOWN ( NumOfCores / 4)) - RAMOSReserve d - RAMForOtherApps , where:
- TotalPhyMem - The total physical size of RAM on the server.
- NumOfCores - number of processor cores.
- NumOfSQLThreads - the number of threads used on the server to process database queries. For the number of cores up to 4, the value of NumOfSQLThreads is always constant and equal to 256. For the number of cores over 4, the calculation is performed according to the formula: NumOfSQLThreads = 256 + (NumOfCores-4) * 8.
- ThreadStackSize = 2MB for x64 servers. For IA64 servers ThreadStackSize = 4MB.
- RAMOSReserved - RAM for the operating system. 20% for servers with TotalPhyMem no more than 15 GB and 12.5% for a larger volume.
- RAMForOtherApps - RAM for other SQL server instances and applications.
You can get information about the processors and the amount of physical memory on the server using the following script:
SELECT cpu_count AS [Logical CPU Count]
, hyperthread_ratio AS [Hyperthread Ratio]
, cpu_count / hyperthread_ratio AS [Physical CPU Count]
, osi.physical_memory_kb / 1024 AS [Physical Memory (MB)]
, sqlserver_start_time
FROM sys.dm_os_sys_info as osi;
For b6s, the calculations will be as follows:
- TotalPhyMem = 98276 Mb.
- NumOfCores = 32.
- NumOfSQLThreads = 256 + (32- 4) * 8 = 480.
- ThreadStackSize = 2 Мб.
- RAMOSReserved = 12,5% * 98276 Мб = 11793 Мб.
- RAMForOtherApps – Заказчик должен самостоятельно определить это значение. В текущих расчетах предполагаем значение в 8 000 Мб на второй экземпляр SQL.
SQL maximum RAM size = 98276 Mb - (480 * 2 Mb) - (1GB * ROUNDDOWN (32/4)) - 11793 Mb - 8000 Mb = 98276 Mb - 960 Mb - 8192 Mb - 11793 Mb - 8000 Mb = 69331 Mb.
Thus, the size of the buffer pool (with the corresponding value of "Max Server Memory") can grow up to 69331 MB, thereby, without affecting the operation of the operating system.
The following is a description of the counters for monitoring memory used by SQL Server, the monitoring of which is recommended to be included in daily monitoring.
<SQL Server Instance> Memory Node \ Target Server Memory
The counter data provides information about the ideal amount of memory required by the server.
<SQL Server Instance> Memory Node \ Total Server Memory
The counter data provides information about the amount of memory allocated to the server by the memory manager. If Total Server Memory is smaller than Target Server Memory is a sign of low memory.
<SQL Server Instance> Buffer Manager \ Buffer cache hit ratio
The percentage of pages found in the buffer cache without being read from disk. This value is defined as the total number of hits in the cache divided by the number of qualifying cache requests for the last several thousand page access operations. After a long period, this ratio changes very slightly. Since reading from the cache is much faster than from disk, you should strive for the highest value of this indicator.
<SQL Server Instance> Buffer Manager \ Page Life Expectancy
Indicates the average page lifetime in the buffer pool. The threshold value is at least 300 seconds.
<SQL Server Instance> Memory Manager \ Memory Grants Pending
Indicates the total number of processes waiting to be provided with working memory.
Example of memory usage monitoring counters
| Target Server Memory (KiV) | Total Server Memory (KiV) | Buffer cache hit ratio | Page Life Expectancy | Lazy writes / sec | Memory grants |
|---|---|---|---|---|---|
| 5312958 | 3683571 | 99.92% | 9 905 712 | 10,739 | 0.018 |
Values are within the normal range, but it should be noted that Total Server Memory is smaller than Target Server Memory. This is usually a sign of running out of memory, but in this case the situation looks different, because SQL Server requests memory as needed. If the memory requirements are not significant, then Total Server Memory will remain much lower than Target Server Memory. SQL Server memory requirements for MS SharePoint Foundation 2013 are 8-16 GB for use in a production environment in a single server farm ( more here ). Thus, at the moment, an increase in memory on the DBMS server is not required.
If you get to the end of the text, it means that you are really digging deep into the SharePoint Server administration topic. You may have questions that are outside the scope of this text. Feel free to post them in the comments.