February 21, 2017 at 09:43
Tarantool: stress testing

The article " Tarantool: Good, Bad, Evil " described a simple voting service with a valid example in PHP. We saw how easy it is to connect and use this NoSQL database in our programs. However, one important question was ignored - why is this? What performance gain does using NoSQL provide compared to regular databases?
Let's go!
To answer this question, I will test one of my servers. It runs a virtual machine with 1 GB of memory and a processor core with the following parameters:
processor: Intel(R) Xeon(R) CPU E5-26xx (Sandy Bridge)
cpu MHz: 1999.999
cache size: 4096 KB
bogomips: 3999.99
The disk subsystem on the SSD is not bad:
hdparm -t /dev/sda1
/dev/sda1:
 Timing buffered disk reads: 484 MB in  3.00 seconds = 161.13 MB/sec
Our hoster claims that a 100 Mbps band is available for the virtual server. And, although our tests showed a high network speed, we will take this limitation for granted. Nginx version 1.6.2 , php / php-fpm version 5.6.30, Tarantool version 1.7.3 .
For testing, we will use the wrk utility . After several tests with various wrk parameters and a little nginx tuning , the latter got this configuration:
worker_processes 1;
events {
        worker_connections 1024;
        multi_accept on;
        use epoll;
}
http {
# Timeouts
        keepalive_timeout     60;
# TCP options
        tcp_nodelay on;
        tcp_nopush  on;
# Compression
        gzip              on;
        gzip_comp_level   5;
…
}
The wrk utility eventually ran with 50 concurrent requests. If you put fewer requests, then you can not achieve maximum server performance. If you put more requests - 100 and higher, then, despite a slight increase in request per second performance, the delay began to grow rapidly. Ultimately, an increase in the number of concurrent requests resulted in losses. However, there is a wonderful illustration on this score:
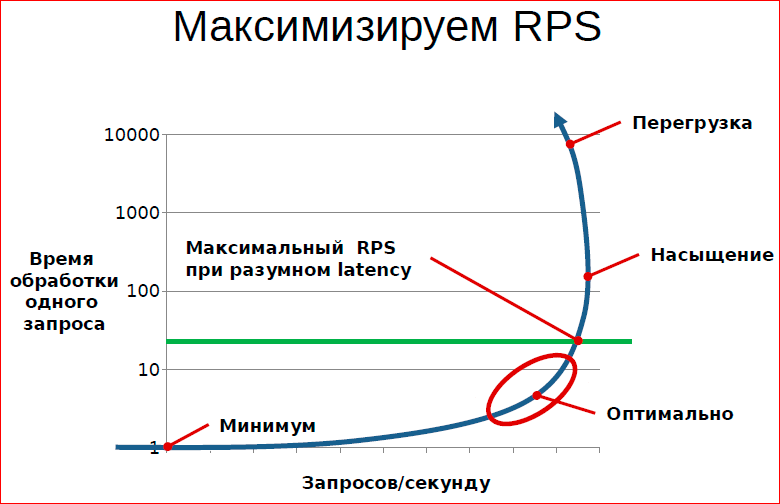
From an article by Konstantin Osipov Principles and techniques for processing queues
Tarantula Test Results
Network ping between the measured server and the traffic generator was 32 ms. Just in case, the test machine was rebooted after trial tests for the sake of objectivity of the result. The following data were obtained:
wrk -c50 -d60s -t4 http://ugly.begetan.me/good
Running 1m test @ http://ugly.begetan.me/good
  4 threads and 50 connections
  Thread Stats   Avg      Stdev     Max   +/- Stdev
    Latency    54.48ms   10.15ms 441.17ms   95.62%
    Req/Sec   220.76     19.43   270.00     74.65%
  52760 requests in 1.00m, 320.86MB read
Requests/sec:    878.72
Transfer/sec:      5.34MB
We managed to get a little less than 900 requests per second with a response time of 54 milliseconds. Is it a lot or a little? First, remember what happens when accessing the page in the script of our service.
- The script sees the appeal of a new client and tries to read cookies that are not there
- A unique uuid is generated in Tarantula
- In the Tarantula, the upsert write command is executed, which records the uuid, time, IP and User-Agent of the client
- The script calls the Tarantula team, which selects the Top 9 best of 16 thousand entries using the rating index

And all this together takes about 1 millisecond at the lowest possible VPS - there's nowhere cheaper! During the tests, there were more than a million entries in the session table, and this does not affect server performance in any way. It seems to me that this is not bad, does it?
Additional information can be obtained from the output of the top utility . As already mentioned, the server was rebooted before starting the tests. A screenshot was taken during the launch of the second benchmark from the moment of reboot.
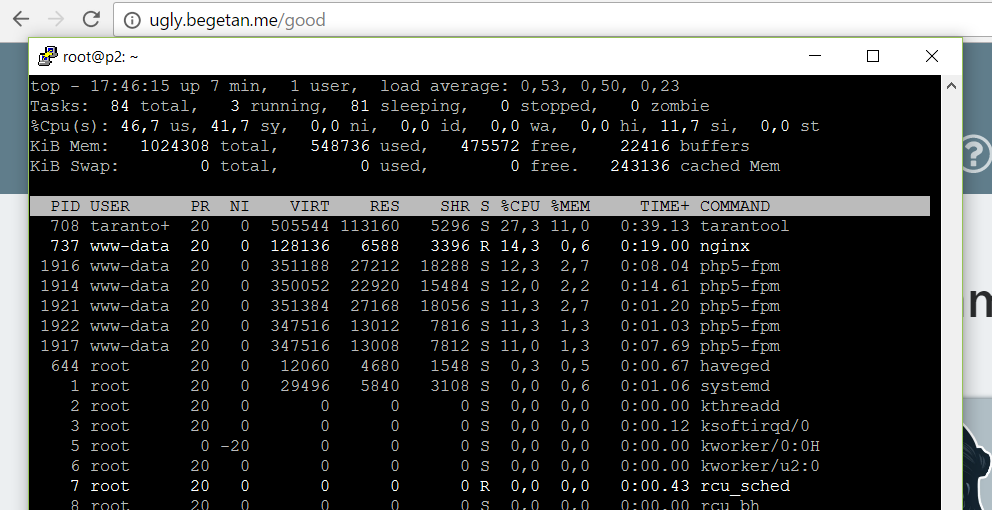
The picture shows the distribution of processor time for tasks. About a quarter of the resources are consumed directly by Tarantula . The main consumer of resources turned out to be php-fpm handlers , which was expected. In third place was nginx . When I increased the number of parallel wrk requests , the processor time consumed by nginx increased. Because of this, there were not enough resources for php-fpm and errors 499 and 502 occurred in the logs .
At this point, it would be correct to rewrite the application, replacing the Tarantula with some ordinary SQL database - MySQL or PostgreSQLand compare the results. However, the author is not a fan of useless work, so he came up with another option. We will test the php-fpm bundle without Tarantula and see how performance will change.
Test Results Without Tarantula
First, let's see why we took exactly 50 simultaneous connections for testing using wrk (-c50 parameter)? When we start one test flow, it starts loading the page, sequentially over and over again. Due to the presence of a network signal propagation delay and non-zero request processing time, the load from one stream is very weak. Therefore, we are starting to increase the number of parallel queries and see what happens with the test results and server load. As the number of concurrent requests grows, the% CPU of the nginx process increases almost evenly. When the load increases too much, the server stops running out of processor resources and some of the test requests get an error. They either end in a timeout from wrk,
The most important thing in all this is that the test parameters were selected specifically for our hosting configuration and test server. To test another bundle, for example, on a local network, you need to select other parameters.
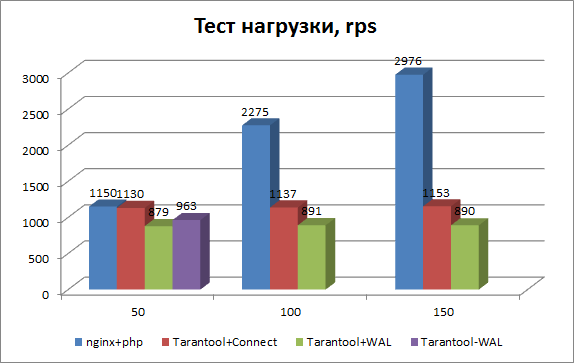
Now let's look at the chart, and then I will show a couple of interesting points.
So, instead of addressing Tarantula in our program, we stuck a stub, like this, in a peasant way:
action_good ()
function action_good() {
    $title = 'Top of the best stickers for Telegram';
//    $top = get_top(10,Tarantool::ITERATOR_LE);
    $top[0] = array(0, 7, 'Procy', 0, 'https://s.tcdn.co/6fb/382/6fb38239-ce7c-3234-bc8a-e6267086b46a/18.png', 1,-1);
    $top[1] = array(0, 7, 'Procy', 0, 'https://s.tcdn.co/6fb/382/6fb38239-ce7c-3234-bc8a-e6267086b46a/17.png', 1,-1);
    $top[2] = array(0, 7, 'Procy', 0, 'https://s.tcdn.co/6fb/382/6fb38239-ce7c-3234-bc8a-e6267086b46a/16.png', 1,-1);
    $top[3] = array(0, 7, 'Procy', 0, 'https://s.tcdn.co/6fb/382/6fb38239-ce7c-3234-bc8a-e6267086b46a/15.png', 1,-1);
    $top[4] = array(0, 7, 'Procy', 0, 'https://s.tcdn.co/6fb/382/6fb38239-ce7c-3234-bc8a-e6267086b46a/14.png', 1,-1);
    $top[5] = array(0, 7, 'Procy', 0, 'https://s.tcdn.co/6fb/382/6fb38239-ce7c-3234-bc8a-e6267086b46a/13.png', 1,-1);
    $top[6] = array(0, 7, 'Procy', 0, 'https://s.tcdn.co/6fb/382/6fb38239-ce7c-3234-bc8a-e6267086b46a/12.png', 1,-1);
    $top[7] = array(0, 7, 'Procy', 0, 'https://s.tcdn.co/6fb/382/6fb38239-ce7c-3234-bc8a-e6267086b46a/11.png', 1,-1);
    $top[8] = array(0, 7, 'Procy', 0, 'https://s.tcdn.co/6fb/382/6fb38239-ce7c-3234-bc8a-e6267086b46a/10.png', 1,-1);
    $top[9] = array(0, 7, 'Procy', 0, 'https://s.tcdn.co/6fb/382/6fb38239-ce7c-3234-bc8a-e6267086b46a/9.png', 1,-1);
    $active_good ='class="active"';
    $active_bad ='';
    include_once('top.html');
}
Also, turn off and remove all references to Tarantula in general and run the script. As can be seen from the graph (nginx + php series), when the Tarantula was disabled on 50 threads, we received 1150 instead of 879 requests, i.e. the increase in speed was only 30%. Cool? Not! In fact, this test does not mean anything. Because we initially selected the load on the site so that it was 100% loaded. But now we have disabled one resource-intensive process (about 30% of the total time), and our site is no longer loaded to the fullest. Check?
It can be seen that the blue graph grows well with a further increase in server load. And with 150 test threads without Tarantula, we received almost 3 thousand requests per second, instead of 1 thousand with Tarantula. Now everything is right.
By the way, why did Tarantula utilize only 30% of the CPU in the test, but when it was turned off, the server performance increased three times? The answer is simple: after turning off the Tarantula, the load on php-fpm workers also decreased. The increase in load was due to an increase in CPU consumption by the nginx process. We drove this load by increasing the number of threads until we began to receive testing errors.
Now let's look at one interesting point. What is Tarantool + Connect graph? As usual, interesting points are found by chance. The situation arose when I first turned off all the calls to the Tarantula procedures and ran the test, but saw that the Tarantula process continues to have a decent piece of CPU. It turned out that I forgot to comment on the connection setup procedure, this part:
# Init database
$tarantool = new Tarantool('localhost', 3301, 'good', 'bad');
try {
        $tarantool->ping();
} catch (Exception $e) {
        echo "Exception: ", $e->getMessage(), "\n";
}
The Tarantool + Connect graph displays system performance only with connection initialization, without any computational operations. It turned out that in our demo application, most of the utilization of the Tarantula process is provided by the connection establishment procedure, and not the computational tasks themselves. In terms of CPU shares, the exact alignment is as follows: 20% in the case of the Tarantool + Connect test and 28% in the case of full work as a database.
What conclusion can there be? It is possible that the process of connecting to Tarantula is a resource-intensive operation, or the PHP driver does not work optimally. The important thing is that if you establish a permanent connection, for example, from a daemon written in C, Java or Go, the same operations would utilize the CPU 4 times less. This should be considered when writing programs.
WAL or not WAL?
And finally, the last test, which is extremely simple, but very interesting for the developer. As we already know, Tarantula declares data safety thanks to the Snapshoot mechanism and Write Ahead Log . The first creates and records a regular database cast, and the second writes all changes to a special change log. In the event of a sudden shutdown or server crash, the changes are saved and can be restored when the system restarts.
I tested the load with the WAL log turned off. With 50 streams, the number of rps increased from 879 to 963. It is clear that disabling writing to the disk of an additional log file should speed up the system, which is 100% loaded. However, it is clear that the increase in speed is close to the measurement error and is not at all worth the price that you have to pay for it. Better to be sure of the safety of your precious data.
Instead of an afterword
Previously, in web development, a common place was the discussion on the topic “why, they say, use fast programming languages to write a web-frontend, anyway the database will slow down!”. Now, as hardware, virtualization, and NoSQL solutions grow, the database ceases to be a bottleneck in the application.
 For me personally, one important question remains unclear. Is Tarantula really as reliable a repository as its developers are trying to prove? “Well, damn it, if not?”, As one song says. I would like to conduct a data loss test called “Break the Tarantula”, but I definitely need help and advice from skeptics, haters, competitors and just Hat.ru haters to simulate the harsh conditions for real! Because “ Plato is my friend, but truth is more precious!»
 And do not forget to vote on the demo site: ugly.begetan.me ! And then you have to lay out every time the same raccoon from the TOP section.