How we organized the competition of shifts between production workers (as in the USSR)
The original idea is very simple. A long time ago, one capitalist came to the factory at the end of the shift. He asked how many changes made the parts, and wrote in chalk on the floor this number in meter numbers. The next shift came, found a number, decided that she was called to a duel, and made a couple more details. They erased someone else's indicator, recorded their own. This is how production competitions began.
Our task was a little more difficult, because initially it was necessary not to whip up line operators, but to let everyone know whether he manages to complete the plan at the right pace of work or not. That is, somehow visualize this process. And then one very interesting feature of a specific production came to light.
So, there is a product packaging line. This is a chain of special machines, which have full moving parts. In these machines "comes" a lot of products, which are then fired, like a machine gun, in a sealed package. An operator is needed to do some of the packing work and generally watch the line. There are not one such lines and not even ten.
Solution architecture
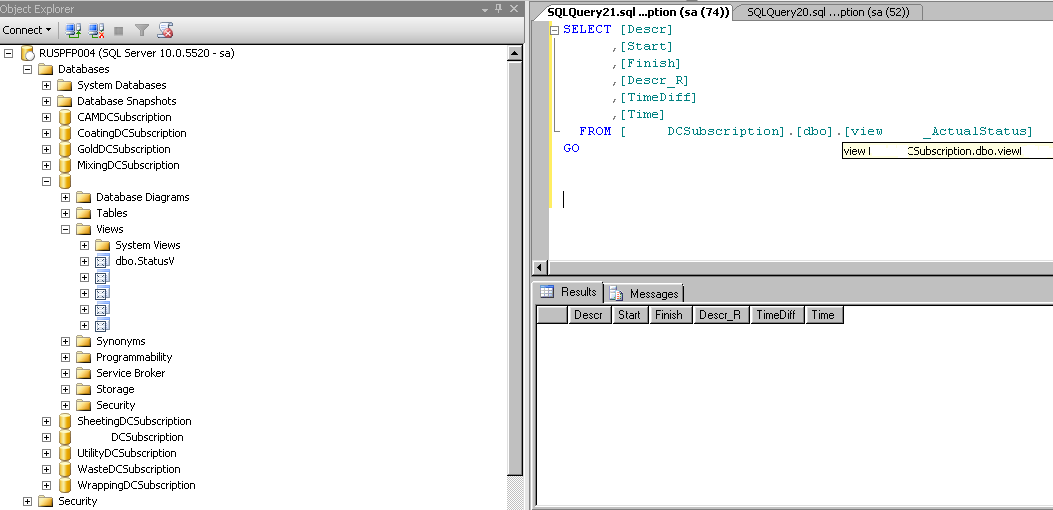
The machines give their data to the SQL server installed in production. It actually comes raw log, which then grinds production for their needs. We were given access to this server, that is, in fact, to this log.
It comes not in real time, but with a delay of about five minutes, because the machines are polled into one database, and the second database with already processed data (with which you can do something, that is, with the same production numbers) is considered and syncs with such a log. The survey lines are also not instant.
Employees log in to their lines (SQL-server knows where and who works), so we still have their names, the beginning-end and the duration of the shift.
Previously, at the end of the shift, the technologist wrote a report and told people how many boxes they had made. All this is unloaded in Excel. This was, firstly, slowly, secondly, terribly uncomfortable. In addition, it was impossible to look in real time and somehow understand how much money a worker will receive in addition for processing.
Gamification
The point is to show Vasya, who works on the 13th line, how cool he is. And his task is to make 2 thousand boxes for a change. From foreign production of various products of daily demand, we adopted the idea of gamification and screens on each line.
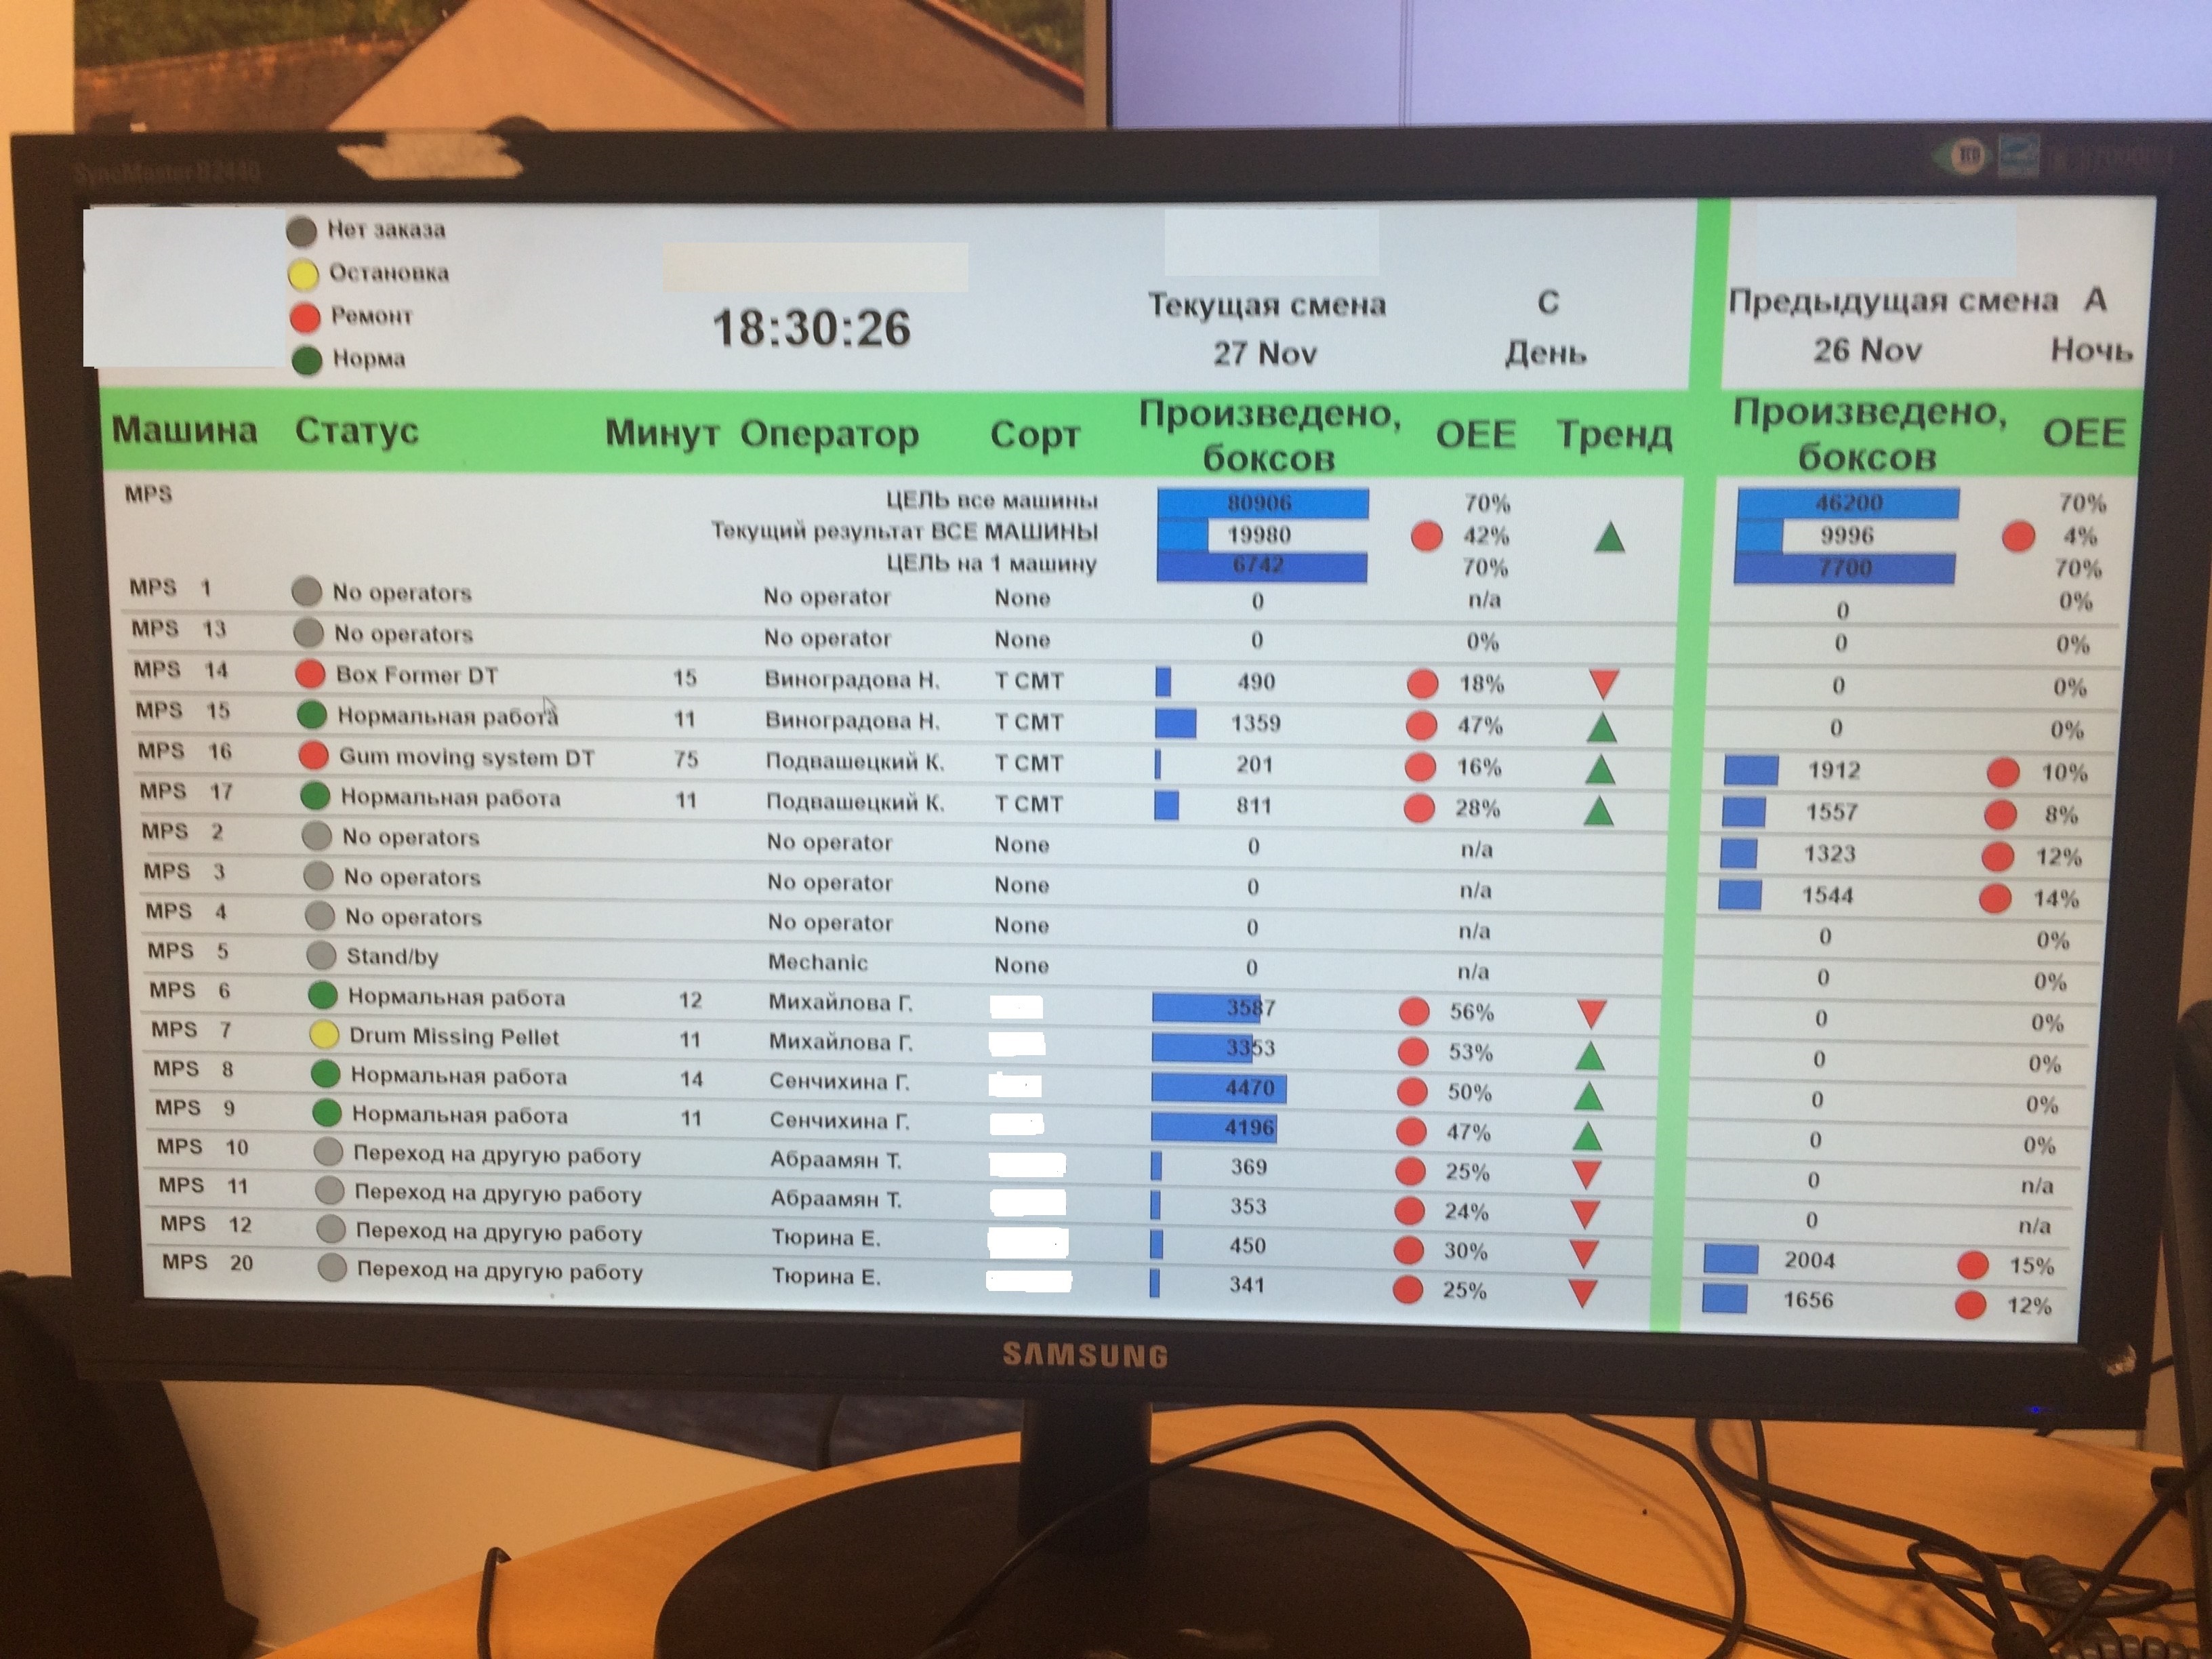
Next to the operator’s workplace, we installed a screen on which the output was shown on the line (Vasya had already done 1,572 boxes, he was in second place), on the next one (Peter on the 11th line made 1,425 boxes, he was in third place) and the next one (Anya on the 6th has already made 1,578 boxes, and she is the first).
The second task is to calculate the production and build a pace forecast. For example, Vasya from the 13th line constantly sees the forecast of the number of boxes at the end of the shift. That is something like this:
I place - Anya. Made 1 578 boxes, the forecast - 2 215 boxes.
II place - Vasya. Made 1 572 boxes, the forecast - 2 213 boxes.
III place - Peter. Made 1,425 boxes, the forecast is 1,998 boxes. Peter, do not brake!
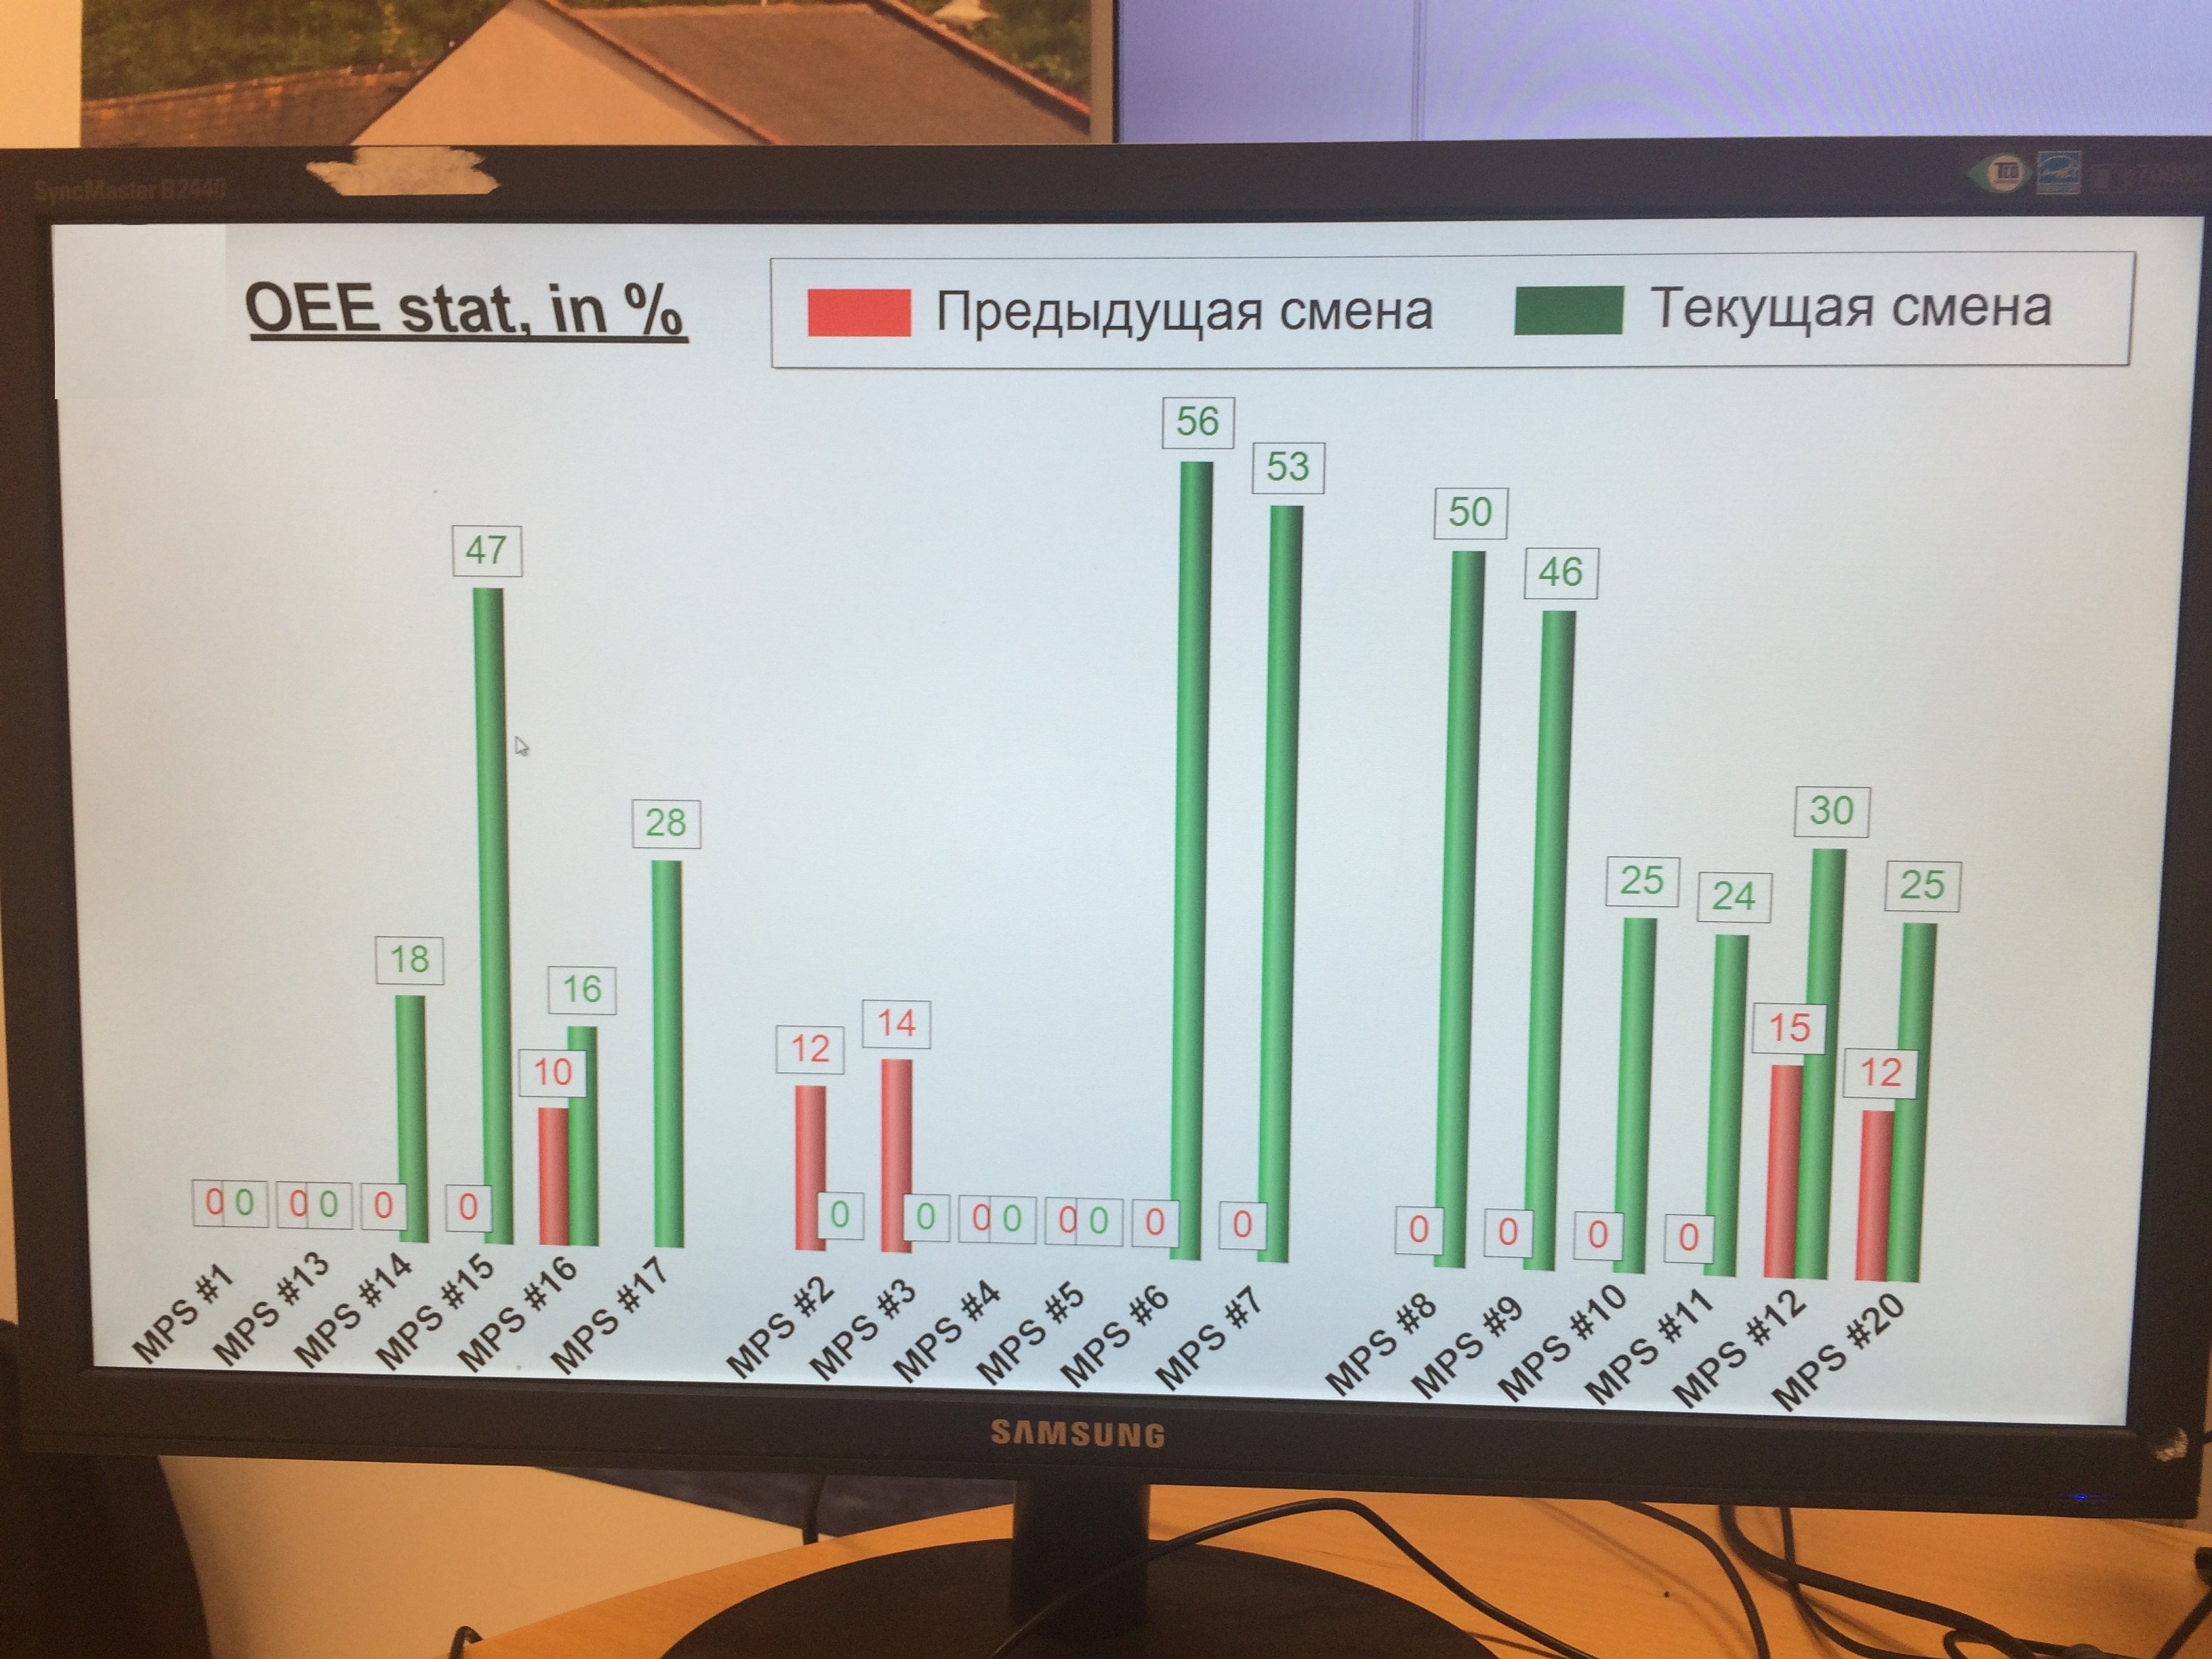
Also, so that the operator could compete with himself (well, or just compare the speed of his work), we began to display the readings for his last shift.
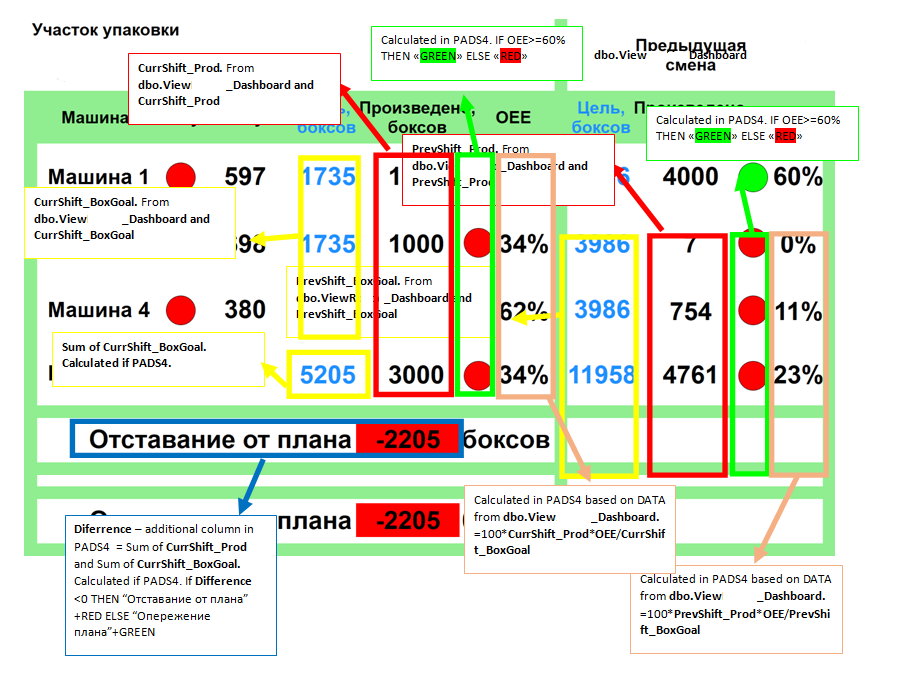
Production figures
There was an internal system that allowed monitoring the condition of the equipment, but indeed the customer did not have an operational picture of what was happening. They needed visualization. The solution was found, and it gave another interesting thing. It was necessary to monitor the availability of equipment, quality and performance.
Accessibility is when the line is working, and the operator can safely compete conditionally with Anya. The performance of iron is the same, and the operators - different. The quality of the idea should be at the same level, that is, the percentage of defects depends on the operator’s skills and the technical condition of the lines (and they are also about the same).
In production, equipment failures occur plus there are, shall we say, its “pre-breaks” states that the analytics system does not read. That is, observing the operation of the line and the speed of various operations, it can be said that in 5–10 minutes something may fail. For example, the process of packing a product has been disrupted - it’s elementary; Well, and so on. I will not open America if I say that repairing equipment in advance, before a serious breakdown, is economically more reasonable, because it allows you to avoid serious downtime.
What we did and what it led to
We installed a screen on each production line, connected digital surfaces to the corporate Digital Signage system (centralized content management), implemented an application for it that allows you to aggregate data, grind them up to reports on each screen and show the operator all the most important things about changing it. We set up all interfaces, integrated the systems, documented them and transferred them to the support of production specialists.
Gamification of production gave very good results for HR-service. The staff has become more involved in the process, more motivated. The only point is that at hazardous industries it is necessary to gamify very carefully.
Total:
- The operator takes the place of the shift and begins to do the packaging.
- Looking at the screen, he goes to the desired pace to fulfill the plan by the end of the shift.
- If you want a prize - compete with your neighbors.
- At any time available forecast at the end of the shift. And if he suddenly begins to decrease for no apparent reason, then it is necessary to check the line for potential problems.
This is not a big date or small datamining. This is a simple construction of the trend to slow-accelerate production. And it allows operators and the shift supervisor to understand what is happening. Previously, they saw the full picture after the fact or based on analyst technologist.
The system is able to respond to different triggers and show alerts. Before its introduction, it was possible to tune up some production equipment, change parameters, eliminate minor faults or reconfigure production in some other way with a delay. Now the response time has been reduced to five minutes. Information operators and the boss see immediately and can very quickly influence the situation.
What is the result? The impact on the production of such factors as malfunction of the equipment or its unplanned shutdown has been reduced by 30%.
Links
- The history of setting the production view somewhere far away
- Wi-Fi for specially protected production
- My mail: asavostikov@croc.ru