January 23, 2017 at 14:59
Load Test Automation: Jmeter + TeamCity + Grafana
Image: Flickr
In our blog on Habré we continue to talk about building DevOps culture in the company - for example, in one of the latest topics we described what tasks we solve using the SaltStack system. Today we will talk about another interesting topic - automation of load testing using a bunch of several ready-made tools.
As it was before
We needed to monitor the servers on which load testing was carried out - to collect metrics of processor performance, memory, operating system, etc. It was also necessary to monitor the status of databases, buses and queues, and sometimes it was sometimes necessary to work with logs. All these tasks were solved by Python scripts of our own design, the information was stored in a SQLite database, and reports were generated using CSV files.
Here is the diagram:

Cons of this approach:
- Everything that is highlighted in the picture with a curly brace was subsequently stored in an artifact by a dead weight, and it was extremely difficult to analyze the data.
- Our functionality allowed us to build a report only with a rigid form - without filters and displaying correlations.
- The main minus - the report was generated only at the end of the test.
New bunch
In the end, we abandoned our own bikes and decided to take advantage of the labor of others. As a result, a new bunch of several tools was born.
Data storage
As a data storage system, the product InfluxDB was used. This is one of the few DBMSs designed to store time series (performance metrics, analytics, events). It can aggregate data on the fly, and the system is easy to use due to the fact that it uses SQL-like syntax. From other advantages:
- Regular expression support.
- Automatic cleaning of old data.
- Scalability.
- Availability of libraries for popular languages.
- Easy deployment and administration.
Consider an example of using InfluxDB for measurements. Suppose we need to measure the temperature of a Type X machine in a time interval.
To do this, we have the options:
- Measurement: temperature;
- Tags: machine, type;
- Fields: internal_temperatre, external_temperature.
Tags are used for aggregation and filtering, data is stored in the fields for storage - they are not indexed, only one value is stored for the combination "measurement + tag + timestamp", time accuracy (s, ms, ms, ns) is set. Duration of data storage is determined by the cleaning policy.
Here's what the measurement will look like:
temperature, machine-unit42,type=assembly internal=32, external=100 1434055562000000035It is easy to form, easy to transfer and it does not require large expenditures of resources.
Monitoring
As a means of monitoring, we decided to use Zabbix. We use cross-platform agents on Windows and Linux hosts. Both passive and active checks are used. Through active checks, metrics are collected from hosts from closed networks. In addition, we actively used the autodiscovery function for virtual machines on hosts with ESXi.
Analysis
The open source grafana project is used as a data analysis tool - it is great for creating dashboards, plotting charts, and standardizing queries and dashboards. The system can build queries for different data sources - the same InfluxDB, Zabbix, Elasticsearch, etc. In general, the product is really convenient - you can create captions and playlists, search on dashboards, and export and import data.
Well, you can not help but mention the interface, which does not make your eyes bleed (hello, Zabbix).

Final configuration
After considering the elements of the system, we’ll talk about how it all ultimately works together.
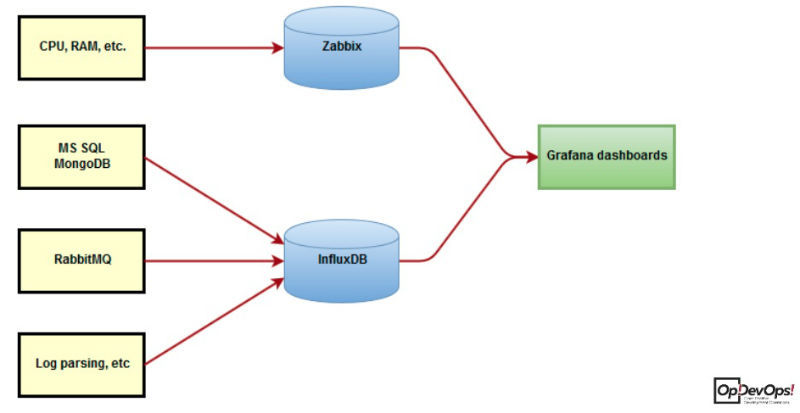
All important operating system and hardware metrics are monitored using Zabbix, as well as using modernized Python collector scripts. Metrics collected by scripts are stored in InfluxDB, information is displayed in Grafana.
Automation
Having prepared the infrastructure, we took up the issues of testing automation. For this, the Apache JMeter product was used. Here is what it is for:
- It can fully emulate the work of real users with the system - in our case, requests between the server and the browser.
- The system generates statistics on server operation — for example, the processing time of incoming requests and the processing of incoming responses.
- Sends results to InfluxDB and for display in Grafana.
On the way to its implementation it was necessary to solve several problems.
- It was necessary to develop a simple mechanism for deploying the tool to servers.
- Establish an easy process to launch and conduct stress testing.
- Develop a simple integration of test results in Grafana.
- Organize online monitoring of load testing.
Here is what we did to solve them:
- We developed a load script that covers up to 80% of all user operations.
- Implemented a mechanism for launching testing through TeamCity.
- Implemented the display of online statistics on the operation of our product MaxPatrol UI.
- Made a simple script update via Git.
Here is the interface for launching the test task in TeamCity:

Jmeter has a built-in plug-in (Backend Listener) for sending data to InfluxDB

Bottom line: how it works
Currently, the process of load testing is the launch of a task in TeamCity - you just need to select the necessary parameters at startup. Further, statistics on the operation of the UI are displayed immediately in the form of ready-made interactive graphs. Updated scripts are automatically pulled through Git in TeamCity.
PS The story about our experience using SaltStack was presented as part of the DevOps-meeting, which took place in the fall of 2016 in Moscow.
Video:
Slides:
The link presents presentations of 16 reports presented during the event. All presentations and video presentations are added to the table at the end of this topic-announcement .
Authors : Ivan Ostanin, Sergey Tikhonov