December 27, 2016 at 18:09
8 JavaScript libraries for visualizing data in the form of interactive maps
Data visualization has become an integral part of the life of almost every web developer. If the construction of graphs, charts, maps and dashboards has never been your headache, just wait a bit: for sure, and you will soon join our "club".
This article gives a general, but involved idea of the eight most interesting, in my opinion, JavaScript libraries for building interactive geovisualizations. In general, there are many such solutions now, and choosing the optimal one for a particular project is sometimes a difficult task at least in time. With this publication, I will try to at least slightly simplify the life of those who are just starting to understand this topic. By the way, this is a slightly modified translation of my recent article on Onextrapixel ( original in English ).

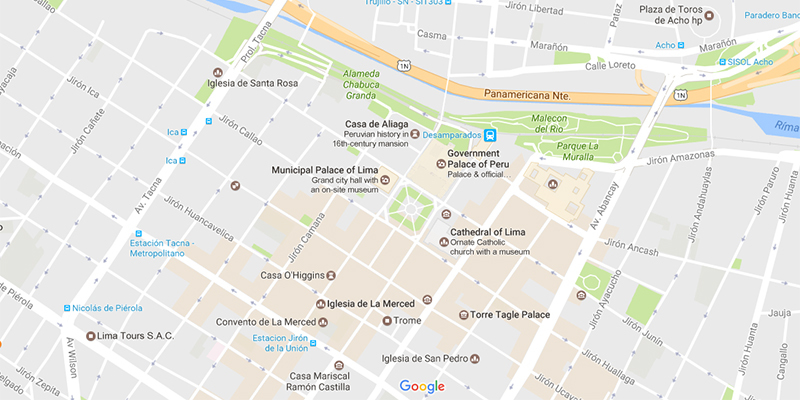
Just in case, I’ll immediately clarify: in general, JavaScript libraries for creating maps can be divided into two types. Some simply allow you to display the geographical location of one or more objects. For such a task, you can use maps such as Google Maps or OpenStreetMaps as a source. In principle, there are enough such solutions, and the result of their work is approximately as follows:
Another type - and I want to talk about it today - JavaScript libraries with which you can do data visualization by creating beautiful interactive maps. They show either the relationship between the values in different geographical regions, or the movement of any objects relative to their location, etc. - all that is extremely important in terms of data analysis and business intelligence.
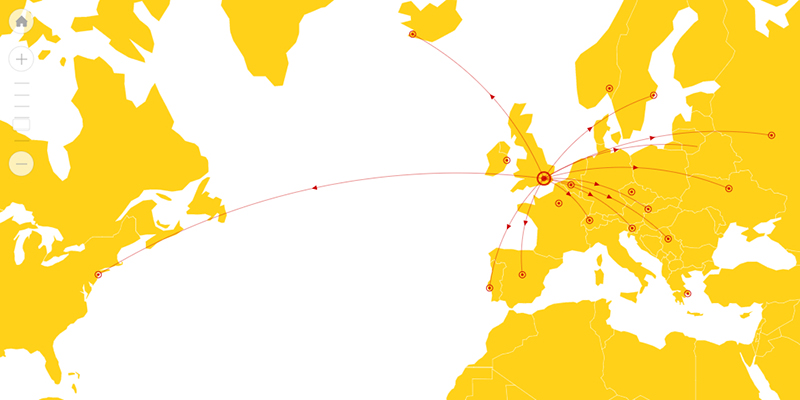
amMap is a special JavaScript (HTML5) library for building maps developed by the amCharts team . It does not need any external dependencies and makes it quite simple to make beautiful choropleth, bubble, dot (point), connector and flow maps, supporting many useful interactive features.
In particular, amMap makes it possible to easily "plunge" into one or another selected part of the map using drill down or, for example, using any pictures as markers is a rather interesting thing.
To get started with amMap, you need to download the ZIP file with binaries. By the way, it already contains 455 cards in each of the supported formats (JavaScript / SVG). DocumentationamMap is not very large and for the most part comes down to a set of questions and answers.
API description: yes .
Dependencies: no.
License: free (branded cards) or paid (from $ 140).

AnyMap is one of the popular JavaScript (HTML5) data visualization libraries created by AnyChart . As in the case of amMap, creating a map with its help does not require much effort, as well as connecting any external resources or third-party libraries (jQuery, etc.). AnyMap also supports all the basic types of series that you might need: choropleth, bubble, dot, connector, flow.
The main interactive features of AnyMap include drill down for a more detailed study of individual areas, an event model for processing events (user interactivity), a color scale for automatically painting the map according to the specified settings.
Looking a little ahead, I’ll say that, in my opinion, AnyMap is more like D3 than amMap or Highmaps. It, as it were, combines the capabilities of “boxed” solutions and at the same time it is well extensible and controlled by the developer, it allows you to fully customize visualizations by adding or changing various elements and easily create your own maps.
AnyMap binaries are located in a ZIP file and contain many examples, and AnyChart’s CDN has hundreds of maps in a variety of formats: GeoJSON, TopoJSON, SHP, SVG. It is also worth noting that this library has rich documentation and an extensive description of the API, by the way, is quite easy to understand and - again - with a lot of samples.
API Description: yes.
Dependencies: no.
License: free (branded cards) or paid (from $ 79).
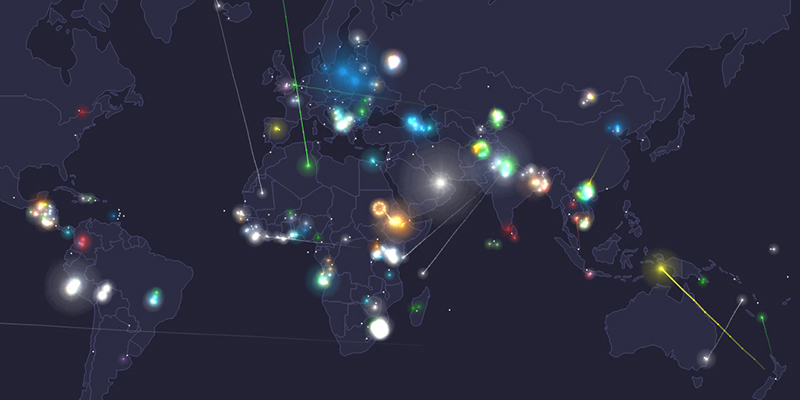
D3.js is a powerful open source data visualization library. Unlike the other JavaScript libraries mentioned, D3 is rather a framework that gives maximum creative freedom. Although the creation of interactive maps is not as obvious here as, say, in solutions from amCharts, AnyChart or Highcharts.
In particular, to make such a wonderful interactive map, as in the illustration, you will need to study a fairly large number of materials. Although, I must say, this is worth it, because in the end you can make really amazing, original visualizations.
In fact, many features are available in D3, including full customization of behavior, an event model, etc. In general, I would say that this is an ideal solution for web applications. Although, unfortunately, D3 does not provide its own cards. This means that they will have to search independently in open sources, but this is hardly a big problem right now.
D3 does not have documentation as such, but there is a well-written API and many different tutorials, examples, and other useful materials literally throughout the Internet.
API description: yes .
Dependencies: no.
License: free.

The giant Google has its own JavaScript library for data visualization - Google Charts . It also contains possibilities for constructing interactive visualization maps, called geocharts here, apparently so that they are not confused with ordinary maps, which are needed only to display the location of objects.
There is only one map in Google Geocharts, and this is a map of the world. However, you can select the region to which focus will be made using zoom.
Unfortunately, the local API does not support scrolling, scaling (zoom), drag and drop (drag). Also, Google does not offer other types of series for maps other than choropleth and bubble. Once, these shortcomings quite saddened me, to put it mildly, but this was also a positive point: in the end I had to start searching and studying all kinds of other libraries, and now I'm sharing the results of this micro-study with you.
One way or another, GeoCharts is an excellent solution for those people and projects who do not need large and complex features, but who seek primarily speed and stability instead of some special beauty and customization.
API description: yes .
Dependencies: no.
License: free.

Highmaps is the "younger sister" of Highcharts and Highstock, Highsoft's popular development libraries . Its key advantages are open source with all its advantages, small size, high rendering speed and a wide range of interactive features, such as drill down, etc.
Among the series supported in Highmaps are choropleth and bubble. In addition, using this library, you can draw lines to indicate roads, rivers, and connectors. Although it’s not as easy to make, say, a flow card here as in the same amMap and AnyMap.
It is also worth noting that neither Highcharts nor Highmaps work without jQuery, so to use them, this dependency must be connected (or, of course, there is another option to look for another library for data visualization - haha).
On the plus side, Highmaps has a large number of maps in SVG and GeoJSON formats. She also has plentiful documentation , which allows you to quickly and successfully figure out all sorts of settings.
API description: yes .
Dependencies: jQuery.
License: free (branded cards) and paid (from $ 390).

jQuery Mapael is another very decent, well-made open source library for creating dynamic vector maps. It is based on jQuery and Raphael JS, so you need to keep these dependencies in mind when building the choropleth, bubble, or connector maps it supports.
A set of ready-to-use maps is in the Mapael repository . The documentation and description of the API are combined in one article, but, frankly, getting started with this library is quite easy using this detailed tutorial .
API description: yes .
Dependencies: jQuery and Raphael.
License: free.
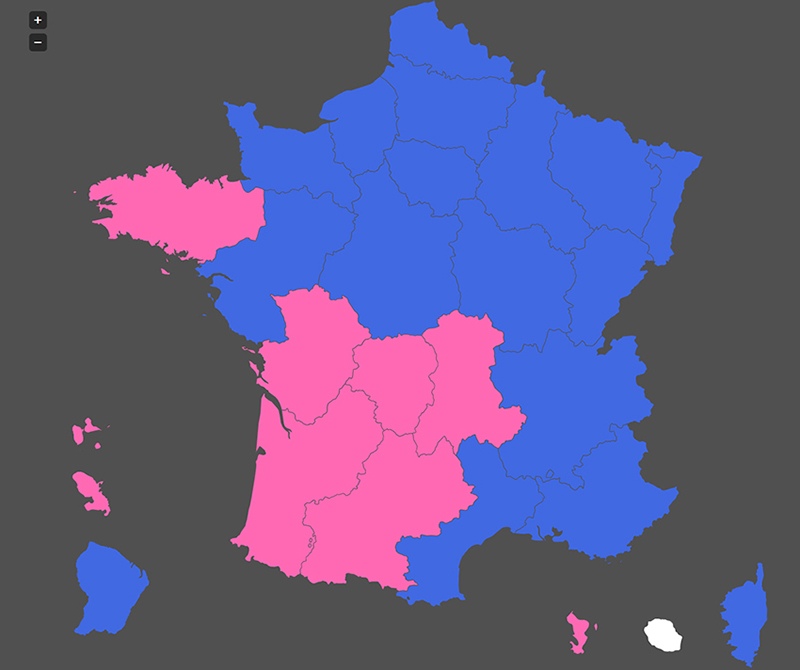
The jVectorMap library for interactive maps is open source, as are a number of others listed in the article. It will not work without jQuery. Although it may seem to someone that such an external dependency makes this (or any other) library not too universal, this should not be a big problem nowadays, because jQuery takes the first place among JavaScript libraries for sites and by popularity, and by market share.
Unfortunately, the choice of available types of series here is not too large: in jVectorMap only choropleth and marker maps are offered, but at the same time - we will give this library its due - they are made very soundly. In addition, here you can use any pictures as markers, and there are also drill down and a number of other interactive features.
JVectorMap has a rather small description of the API and there is no documentation in the usual form, at least for me. However, there is a small, but still very useful Getting Started tutorial . Their cards are used, but only in the GeoJSON format.
API description: yes .
Dependencies: jQuery.
License: free and paid (from $ 39).

Kartograph is another open source solution with all the benefits that come with it. This library is characterized by an abundance of visual effects, such as shadows, blur, etc.
It is also interesting that in addition to the traditional choropleth and bubble types of series, there are also 3D columns (or, as they are sometimes called, vertical 3D bars).
There is no ready-made collection of maps in Kartograph. But the library works with any cards in SVG format. She also offers the Kartograph.py utility for creating maps.
Although Kartograph has dependencies and will not work without Raphael JS (used as a drawing engine) and jQuery, this library makes the process of creating maps really quite understandable and problem-free, while the documentation and description of the API of this library, combined into one article, make it quite easy and it’s convenient to get the right interactive maps for your projects.
API description: yes .
Dependencies: jQuery and Raphael.
License: free.
All the JavaScript libraries I have listed for visualizing data using interactive maps are cross-browser. (Well, in the 21st century, it probably cannot be otherwise.) Some of them even support older browsers, such as Internet Explorer 6. (Although this, I hope, will soon cease to be important, at the end of 2010- x.)
All the free libraries that I mentioned are pretty good at creating interactive maps. But on the other hand, they do not provide such broad support as commercial ones, and, honestly, they are not so strong at customization (well, except for D3, of course).
Speaking of commercial libraries - by the way, you can usually use them for free for non-commercial and personal purposes - I cannot but mention AnyMap and Highmaps for their comprehensive documentation and API descriptions, as well as for large pools of all kinds of good JavaScript examples / demos with good quality interactivity.
Thanks for attention. I hope this article will be useful for someone with the goal of quickly grasping the essence of top JavaScript libraries designed to visualize data using interactive maps. Please share in the comments your own thoughts, conclusions, understandings and, of course, the names of your favorite libraries, if suddenly, in your opinion, I have not undeservedly touched on them in this article.
Have a nice day, everyone!
This article gives a general, but involved idea of the eight most interesting, in my opinion, JavaScript libraries for building interactive geovisualizations. In general, there are many such solutions now, and choosing the optimal one for a particular project is sometimes a difficult task at least in time. With this publication, I will try to at least slightly simplify the life of those who are just starting to understand this topic. By the way, this is a slightly modified translation of my recent article on Onextrapixel ( original in English ).
Just in case, I’ll immediately clarify: in general, JavaScript libraries for creating maps can be divided into two types. Some simply allow you to display the geographical location of one or more objects. For such a task, you can use maps such as Google Maps or OpenStreetMaps as a source. In principle, there are enough such solutions, and the result of their work is approximately as follows:
Another type - and I want to talk about it today - JavaScript libraries with which you can do data visualization by creating beautiful interactive maps. They show either the relationship between the values in different geographical regions, or the movement of any objects relative to their location, etc. - all that is extremely important in terms of data analysis and business intelligence.
JavaScript Libraries for Interactive Visualization Maps
amMap (from amCharts)
amMap is a special JavaScript (HTML5) library for building maps developed by the amCharts team . It does not need any external dependencies and makes it quite simple to make beautiful choropleth, bubble, dot (point), connector and flow maps, supporting many useful interactive features.
In particular, amMap makes it possible to easily "plunge" into one or another selected part of the map using drill down or, for example, using any pictures as markers is a rather interesting thing.
To get started with amMap, you need to download the ZIP file with binaries. By the way, it already contains 455 cards in each of the supported formats (JavaScript / SVG). DocumentationamMap is not very large and for the most part comes down to a set of questions and answers.
API description: yes .
Dependencies: no.
License: free (branded cards) or paid (from $ 140).
AnyMap (from AnyChart)
AnyMap is one of the popular JavaScript (HTML5) data visualization libraries created by AnyChart . As in the case of amMap, creating a map with its help does not require much effort, as well as connecting any external resources or third-party libraries (jQuery, etc.). AnyMap also supports all the basic types of series that you might need: choropleth, bubble, dot, connector, flow.
The main interactive features of AnyMap include drill down for a more detailed study of individual areas, an event model for processing events (user interactivity), a color scale for automatically painting the map according to the specified settings.
Looking a little ahead, I’ll say that, in my opinion, AnyMap is more like D3 than amMap or Highmaps. It, as it were, combines the capabilities of “boxed” solutions and at the same time it is well extensible and controlled by the developer, it allows you to fully customize visualizations by adding or changing various elements and easily create your own maps.
AnyMap binaries are located in a ZIP file and contain many examples, and AnyChart’s CDN has hundreds of maps in a variety of formats: GeoJSON, TopoJSON, SHP, SVG. It is also worth noting that this library has rich documentation and an extensive description of the API, by the way, is quite easy to understand and - again - with a lot of samples.
API Description: yes.
Dependencies: no.
License: free (branded cards) or paid (from $ 79).
D3.js (from Mike Bostock)
D3.js is a powerful open source data visualization library. Unlike the other JavaScript libraries mentioned, D3 is rather a framework that gives maximum creative freedom. Although the creation of interactive maps is not as obvious here as, say, in solutions from amCharts, AnyChart or Highcharts.
In particular, to make such a wonderful interactive map, as in the illustration, you will need to study a fairly large number of materials. Although, I must say, this is worth it, because in the end you can make really amazing, original visualizations.
In fact, many features are available in D3, including full customization of behavior, an event model, etc. In general, I would say that this is an ideal solution for web applications. Although, unfortunately, D3 does not provide its own cards. This means that they will have to search independently in open sources, but this is hardly a big problem right now.
D3 does not have documentation as such, but there is a well-written API and many different tutorials, examples, and other useful materials literally throughout the Internet.
API description: yes .
Dependencies: no.
License: free.
Google GeoCharts (from Google)
The giant Google has its own JavaScript library for data visualization - Google Charts . It also contains possibilities for constructing interactive visualization maps, called geocharts here, apparently so that they are not confused with ordinary maps, which are needed only to display the location of objects.
There is only one map in Google Geocharts, and this is a map of the world. However, you can select the region to which focus will be made using zoom.
Unfortunately, the local API does not support scrolling, scaling (zoom), drag and drop (drag). Also, Google does not offer other types of series for maps other than choropleth and bubble. Once, these shortcomings quite saddened me, to put it mildly, but this was also a positive point: in the end I had to start searching and studying all kinds of other libraries, and now I'm sharing the results of this micro-study with you.
One way or another, GeoCharts is an excellent solution for those people and projects who do not need large and complex features, but who seek primarily speed and stability instead of some special beauty and customization.
API description: yes .
Dependencies: no.
License: free.
Highmaps (from Highsoft)
Highmaps is the "younger sister" of Highcharts and Highstock, Highsoft's popular development libraries . Its key advantages are open source with all its advantages, small size, high rendering speed and a wide range of interactive features, such as drill down, etc.
Among the series supported in Highmaps are choropleth and bubble. In addition, using this library, you can draw lines to indicate roads, rivers, and connectors. Although it’s not as easy to make, say, a flow card here as in the same amMap and AnyMap.
It is also worth noting that neither Highcharts nor Highmaps work without jQuery, so to use them, this dependency must be connected (or, of course, there is another option to look for another library for data visualization - haha).
On the plus side, Highmaps has a large number of maps in SVG and GeoJSON formats. She also has plentiful documentation , which allows you to quickly and successfully figure out all sorts of settings.
API description: yes .
Dependencies: jQuery.
License: free (branded cards) and paid (from $ 390).
jQuery Mapael (by Vincent Broute)
jQuery Mapael is another very decent, well-made open source library for creating dynamic vector maps. It is based on jQuery and Raphael JS, so you need to keep these dependencies in mind when building the choropleth, bubble, or connector maps it supports.
A set of ready-to-use maps is in the Mapael repository . The documentation and description of the API are combined in one article, but, frankly, getting started with this library is quite easy using this detailed tutorial .
API description: yes .
Dependencies: jQuery and Raphael.
License: free.
jVectorMap (by Kirill Lebedev)
The jVectorMap library for interactive maps is open source, as are a number of others listed in the article. It will not work without jQuery. Although it may seem to someone that such an external dependency makes this (or any other) library not too universal, this should not be a big problem nowadays, because jQuery takes the first place among JavaScript libraries for sites and by popularity, and by market share.
Unfortunately, the choice of available types of series here is not too large: in jVectorMap only choropleth and marker maps are offered, but at the same time - we will give this library its due - they are made very soundly. In addition, here you can use any pictures as markers, and there are also drill down and a number of other interactive features.
JVectorMap has a rather small description of the API and there is no documentation in the usual form, at least for me. However, there is a small, but still very useful Getting Started tutorial . Their cards are used, but only in the GeoJSON format.
API description: yes .
Dependencies: jQuery.
License: free and paid (from $ 39).
Kartograph (by Gregor Aisch)
Kartograph is another open source solution with all the benefits that come with it. This library is characterized by an abundance of visual effects, such as shadows, blur, etc.
It is also interesting that in addition to the traditional choropleth and bubble types of series, there are also 3D columns (or, as they are sometimes called, vertical 3D bars).
There is no ready-made collection of maps in Kartograph. But the library works with any cards in SVG format. She also offers the Kartograph.py utility for creating maps.
Although Kartograph has dependencies and will not work without Raphael JS (used as a drawing engine) and jQuery, this library makes the process of creating maps really quite understandable and problem-free, while the documentation and description of the API of this library, combined into one article, make it quite easy and it’s convenient to get the right interactive maps for your projects.
API description: yes .
Dependencies: jQuery and Raphael.
License: free.
Conclusion
All the JavaScript libraries I have listed for visualizing data using interactive maps are cross-browser. (Well, in the 21st century, it probably cannot be otherwise.) Some of them even support older browsers, such as Internet Explorer 6. (Although this, I hope, will soon cease to be important, at the end of 2010- x.)
All the free libraries that I mentioned are pretty good at creating interactive maps. But on the other hand, they do not provide such broad support as commercial ones, and, honestly, they are not so strong at customization (well, except for D3, of course).
Speaking of commercial libraries - by the way, you can usually use them for free for non-commercial and personal purposes - I cannot but mention AnyMap and Highmaps for their comprehensive documentation and API descriptions, as well as for large pools of all kinds of good JavaScript examples / demos with good quality interactivity.
Thanks for attention. I hope this article will be useful for someone with the goal of quickly grasping the essence of top JavaScript libraries designed to visualize data using interactive maps. Please share in the comments your own thoughts, conclusions, understandings and, of course, the names of your favorite libraries, if suddenly, in your opinion, I have not undeservedly touched on them in this article.
Have a nice day, everyone!