Small code for big data or Apache Spark in 3 days
Let the Giraffe was wrong,
But it’s not the Giraffe who is guilty,
But the one who shouted from the branches:
“The big Giraffe is better for him!” (c)
It was necessary to quickly deal with Apache Spark technology sharpened for using Big Data. In the process of clarification, he actively used habrahabr, so I will try to return the information debt, sharing my experience.
Namely: installing the system from scratch, setting up and actually programming a code that solves the data processing problem to create a model that calculates the probability of bankruptcy of a bank client by a set of signs such as loan amount, interest rate, etc.
There seems to be a lot of big data, but for some reason it’s not easy to find that vicious place where they all feel it. First tried the option withambari , but on my Window7 there were errors in the settings of the network bridge. As a result, I rolled a variant with a pre-configured virtual machine from Cloudera ( CDH ). Just install VirtualBox, run the downloaded file, specify the main parameters (memory, location), and after 5 minutes, the venerable Apache Hadoopgenie longs for your instructions.
A few words, why exactly Spark. As I understand it, the key differences from the original MapReduce are that the data is held in memory, instead of being flushed to disk, which gives acceleration many times over. But perhaps more important are the implementation of a number of statistical functions and a convenient interface for loading / processing data.
Further, the actual code for solving the following problem. There is really big data (because the hand is very tired of scrolling these 2000 lines) in the format:
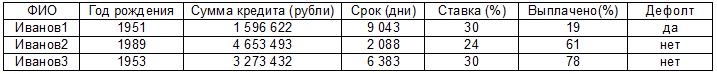
There is an assumption that the default is somehow related to the rest of the parameters (except for the first, there are no complaints to the respected Ivanov1 ... N) and you need to build a linear regression model. Before you start, it’s worth mentioning that this is my first Java code, I myself work as an analyst and in general this is my first Eclipse launch, setting up Maven, etc. So do not wait for exquisite miracles, below is a solution to the problem in the forehead in the way that for some reason it worked. Let's go:
1. Create a Spark session. The important point is that it all works only with version 2.0.0, while v1.6 comes in the CDH delivery. So you need to upgrade, otherwise there will be an exception at startup.
2. Load data into a special type of JavaRDD. Essentially, it’s like List in C #, at least I explained it to myself. The library can read a lot of things, but for a start a regular csv file will do.
Where Client is a regular class with our attributes (can be found in the project file, the link at the end of the post).
3. We create a dataset which is necessary for data normalization. Without normalization, the calculation of the linear regression model using the gradient descent method will not work. At first I tried to screw StandardScalerModel: fit -> transform, but there were problems with data types, it seems because of the difference in versions. In general, so far it has cost a workaround, namely through the select to the data, performing normalization directly in it:
4. The model receives data in JavaRDD format into which we cram the name of the client. This is the norm for a beautiful display of the test version, in life, of course, you should not do this, although in general this may be needed for other purposes.
5. Select LabeledPoint data for the model:
6. Create the actual model:
7. And actually the main work + result:
8. And we calculate the average square of the error (from paragraph 7):
In this case, the conclusion will look like this:
Ivanov1983 got the score 0.57. The real status is 1
Ivanov1984 got the score 0.54. The real status is 1
Ivanov1985 got the score -0.08. The real status is 0
Ivanov1986 got the score 0.33. The real status is 1
Ivanov1987 got the score 0.78. The real status is 1
Ivanov1988 got the score 0.63. The real status is 1
Ivanov1989 got the score 0.63. The real status is 1
Ivanov 1990 got the score 0.03. The real status is 0
Ivanov1991 got the score 0.57. The real status is 1
Ivanov1992 got the score 0.26. The real status is 0
Ivanov1993 got the score 0.07. The real status is 0
Ivanov 1994 got the score 0.17. The real status is 0
Ivanov 1995 got the score 0.83. The real status is 1
Ivanov 1996 got the score 0.31. The real status is 0
Ivanov1997 got the score 0.48. The real status is 0
Ivanov 1998 got the score 0.16. The real status is 0
Ivanov1999 got the score 0.36. The real status is 0
Ivanov2000 got the score -0.04. The real status is 0
16/11/21 21:36:40 INFO Executor: Finished task 0.0 in stage 176.0 (TID 176). 3194 bytes result sent to driver
16/11/21 21:36:40 INFO TaskSetManager: Finished task 0.0 in stage 176.0 (TID 176) in 432 ms on localhost (1/1)
16/11/21 21:36:40 INFO TaskSchedulerImpl: Removed TaskSet 176.0, whose tasks have all completed, from pool
16/11/21 21:36:40 INFO DAGScheduler: ResultStage 176 (mean at App.java:242) finished in 0.433 s
16/11/21 21:36:40 INFO DAGScheduler: Job 175 finished: mean at App.java : 242, took 0.452851 s
Training Error = 0.11655428630639536
Now it makes sense to compare it with the analytical solution in Excel:
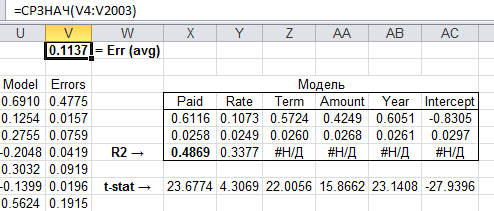
As you can see, the result is very close, the model turned out to be suitable, you can set the test sample. The project code with the source data can be downloaded here .
In general, I want to note that the hype around big data seems quite excessive (such a big one). It seems to me more valuable, rather than volume, but how to process this data. Those. any combination of TF-IDF - a neural network - ALS can give an amazing result if you can creatively work on a limited volume. The problem is probably that managers can knock out budgets for the magic words of Big Data, and spending a resource on just research purposes requires too long a planning horizon for an ordinary company.
To understand this thought, I’ll clarify that the Hadoop ecosystem zoo (Hive, Pig, Impala, etc.) is gorgeous. I myself am developing a distributed computing system on neural networks (simultaneous execution of multi-threaded applications on several servers with synchronization and aggregation of results) for macroeconomic modeling and I understand approximately how many rakes lie on this path. Yes, there are tasks where there are no alternatives to these technologies - for example, primitive, but online streaming processing of wild volumes of data (relatively speaking, some kind of analysis of the traffic of Moscow cellular subscribers). Then Apache Storm or Spark Streaming can do wonders.
But if we have an array of data on a million customers per year, then sampling every 10th (or even 100th) randomly to build a model of some scoring will give almost the same result as a full array. In other words, instead of the queen of the ball, Data mining became the stepdaughter, although most likely it is temporary. The excitement will subside, but the experimental approaches that are now rolling around on Hadoop clusters will spread and those who are the first to realize the prospects of researching "small" data will be in the damsels.
But it’s not the Giraffe who is guilty,
But the one who shouted from the branches:
“The big Giraffe is better for him!” (c)
It was necessary to quickly deal with Apache Spark technology sharpened for using Big Data. In the process of clarification, he actively used habrahabr, so I will try to return the information debt, sharing my experience.
Namely: installing the system from scratch, setting up and actually programming a code that solves the data processing problem to create a model that calculates the probability of bankruptcy of a bank client by a set of signs such as loan amount, interest rate, etc.
There seems to be a lot of big data, but for some reason it’s not easy to find that vicious place where they all feel it. First tried the option withambari , but on my Window7 there were errors in the settings of the network bridge. As a result, I rolled a variant with a pre-configured virtual machine from Cloudera ( CDH ). Just install VirtualBox, run the downloaded file, specify the main parameters (memory, location), and after 5 minutes, the venerable Apache Hadoop
Further, the actual code for solving the following problem. There is really big data (because the hand is very tired of scrolling these 2000 lines) in the format:
There is an assumption that the default is somehow related to the rest of the parameters (except for the first, there are no complaints to the respected Ivanov1 ... N) and you need to build a linear regression model. Before you start, it’s worth mentioning that this is my first Java code, I myself work as an analyst and in general this is my first Eclipse launch, setting up Maven, etc. So do not wait for exquisite miracles, below is a solution to the problem in the forehead in the way that for some reason it worked. Let's go:
1. Create a Spark session. The important point is that it all works only with version 2.0.0, while v1.6 comes in the CDH delivery. So you need to upgrade, otherwise there will be an exception at startup.
SparkSession ss = SparkSession
	.builder()
	.appName("Bankrupticy analyser")
	.getOrCreate();
2. Load data into a special type of JavaRDD. Essentially, it’s like List in C #, at least I explained it to myself. The library can read a lot of things, but for a start a regular csv file will do.
JavaRDD peopleRDD = ss.read()
	.textFile(filename)
	.javaRDD()
	.map(new Function()
	{
		public Client call(String line) throws Exception
		{
		 	String[] parts = line.split(",");	// Разделитель
			Client client = new Client();
			client.setName(parts[0]);	// Парсим поля (ФИО в первой колонке)
			client.setYearOfBirth(Double.parseDouble(parts[1]));
			client.setAmount(Double.parseDouble(parts[2]));
			client.setTerm(Double.parseDouble(parts[3]));
			client.setRate(Double.parseDouble(parts[4]));
			client.setPaid(Double.parseDouble(parts[5]));
			client.setStatus(Double.parseDouble(parts[6]));	// Тут признак банкротства (1 - банкрот, 0 – пока еще платит)
			 return client;
		}
	});
Where Client is a regular class with our attributes (can be found in the project file, the link at the end of the post).
3. We create a dataset which is necessary for data normalization. Without normalization, the calculation of the linear regression model using the gradient descent method will not work. At first I tried to screw StandardScalerModel: fit -> transform, but there were problems with data types, it seems because of the difference in versions. In general, so far it has cost a workaround, namely through the select to the data, performing normalization directly in it:
Dataset clientDF = ss.createDataFrame(peopleRDD, Client.class);
clientDF.createOrReplaceTempView("client");
Dataset scaledData = ss.sql(
	"SELECT name, (minYearOfBirth - yearOfBirth) / (minYearOfBirth - maxYearOfBirth),"
	+ "(minAmount - amount) / (minAmount - maxAmount),"
	+ "(minTerm - term) / (minTerm - maxTerm),"
	+ "(minRate - rate) / (minRate - maxRate),"
	+ "(minPaid - paid) / (minPaid - maxPaid),"
	+ "(minStatus - status) / (minStatus - maxStatus) "
	+ "FROM client CROSS JOIN "
	+ "(SELECT min(yearOfBirth) AS minYearOfBirth, max(yearOfBirth) AS maxYearOfBirth,"
	+ "min(amount) AS minAmount, max(amount) AS maxAmount,"
	+ "min(term) AS minTerm , max(term) AS maxTerm,"
	+ "min(rate) AS minRate, max(rate) AS maxRate,"
	+ "min(paid) AS minPaid, max(paid) AS maxPaid,"
	+ "min(status) AS minStatus, max(status) AS maxStatus "
	+ "FROM client)").cache();
4. The model receives data in JavaRDD format into which we cram the name of the client. This is the norm for a beautiful display of the test version, in life, of course, you should not do this, although in general this may be needed for other purposes.
JavaRDD rowData =  scaledData.javaRDD(); // Dataset to JavaRDD
JavaRDD> parsedData = rowData.map(
	new Function>()
	{
		public Tuple2 call(Row row)
		{
			int last = row.length();
			String cname = row.getString(0);	// Первый элемент - ФИО
			double label = row.getDouble(last - 1);	// Последний – признак дефолта
			double[] v = new double[last];
			for (int i = 1; i < last - 1; i++)	// Посередине независимые переменные
				v[i] = row.getDouble(i);
			v[last - 1] = 1; // +intercept
			return new Tuple2
				(cname, new LabeledPoint(label, Vectors.dense(v)));
		}
	});
5. Select LabeledPoint data for the model:
JavaRDD parsedDataToTrain = parsedData.map(
	new Function, LabeledPoint>()
	{
		public LabeledPoint call(Tuple2 namedTuple)
		{
			return namedTuple._2();  // 2 означает второй элемент в составе
		}
	});
parsedData.cache();
6. Create the actual model:
int numIterations = 200;
double stepSize = 2;
final LinearRegressionModel model
	= LinearRegressionWithSGD.train(JavaRDD.toRDD(parsedDataToTrain), numIterations, stepSize);
7. And actually the main work + result:
final NumberFormat nf = NumberFormat.getInstance(); // Для красоты вывода чисел
nf.setMaximumFractionDigits(2);
JavaRDD> valuesAndPreds = parsedData.map(
	new Function, Tuple2>()
	{
		public Tuple2 call(Tuple2 namedTuple)
		{
			double prediction = model.predict(namedTuple._2().features()); // Расчет зависимой переменной для набора признаков данного клиента
        		System.out.println(namedTuple._1() + " got the score " + nf.format(prediction)
	       			+ ". The real status is " + nf.format(namedTuple._2().label()));
        		return new Tuple2(prediction, namedTuple._2().label());
	       }
	 });
8. And we calculate the average square of the error (from paragraph 7):
double MSE = new JavaDoubleRDD(valuesAndPreds.map(
	new Function, Object>()
	{
		public Object call(Tuple2 pair)
		{
			return Math.pow(pair._1() - pair._2(), 2.0);
		}
	}).rdd()).mean();
In this case, the conclusion will look like this:
Ivanov1983 got the score 0.57. The real status is 1
Ivanov1984 got the score 0.54. The real status is 1
Ivanov1985 got the score -0.08. The real status is 0
Ivanov1986 got the score 0.33. The real status is 1
Ivanov1987 got the score 0.78. The real status is 1
Ivanov1988 got the score 0.63. The real status is 1
Ivanov1989 got the score 0.63. The real status is 1
Ivanov 1990 got the score 0.03. The real status is 0
Ivanov1991 got the score 0.57. The real status is 1
Ivanov1992 got the score 0.26. The real status is 0
Ivanov1993 got the score 0.07. The real status is 0
Ivanov 1994 got the score 0.17. The real status is 0
Ivanov 1995 got the score 0.83. The real status is 1
Ivanov 1996 got the score 0.31. The real status is 0
Ivanov1997 got the score 0.48. The real status is 0
Ivanov 1998 got the score 0.16. The real status is 0
Ivanov1999 got the score 0.36. The real status is 0
Ivanov2000 got the score -0.04. The real status is 0
16/11/21 21:36:40 INFO Executor: Finished task 0.0 in stage 176.0 (TID 176). 3194 bytes result sent to driver
16/11/21 21:36:40 INFO TaskSetManager: Finished task 0.0 in stage 176.0 (TID 176) in 432 ms on localhost (1/1)
16/11/21 21:36:40 INFO TaskSchedulerImpl: Removed TaskSet 176.0, whose tasks have all completed, from pool
16/11/21 21:36:40 INFO DAGScheduler: ResultStage 176 (mean at App.java:242) finished in 0.433 s
16/11/21 21:36:40 INFO DAGScheduler: Job 175 finished: mean at App.java : 242, took 0.452851 s
Training Error = 0.11655428630639536
Now it makes sense to compare it with the analytical solution in Excel:
As you can see, the result is very close, the model turned out to be suitable, you can set the test sample. The project code with the source data can be downloaded here .
In general, I want to note that the hype around big data seems quite excessive (such a big one). It seems to me more valuable, rather than volume, but how to process this data. Those. any combination of TF-IDF - a neural network - ALS can give an amazing result if you can creatively work on a limited volume. The problem is probably that managers can knock out budgets for the magic words of Big Data, and spending a resource on just research purposes requires too long a planning horizon for an ordinary company.
To understand this thought, I’ll clarify that the Hadoop ecosystem zoo (Hive, Pig, Impala, etc.) is gorgeous. I myself am developing a distributed computing system on neural networks (simultaneous execution of multi-threaded applications on several servers with synchronization and aggregation of results) for macroeconomic modeling and I understand approximately how many rakes lie on this path. Yes, there are tasks where there are no alternatives to these technologies - for example, primitive, but online streaming processing of wild volumes of data (relatively speaking, some kind of analysis of the traffic of Moscow cellular subscribers). Then Apache Storm or Spark Streaming can do wonders.
But if we have an array of data on a million customers per year, then sampling every 10th (or even 100th) randomly to build a model of some scoring will give almost the same result as a full array. In other words, instead of the queen of the ball, Data mining became the stepdaughter, although most likely it is temporary. The excitement will subside, but the experimental approaches that are now rolling around on Hadoop clusters will spread and those who are the first to realize the prospects of researching "small" data will be in the damsels.