Ceph. Anatomy of a catastrophe
Ceph is object storage designed to help build a failover cluster. And yet failures happen. Everyone who works with Ceph knows the legend about CloudMouse or Rosreestr. Unfortunately, sharing negative experiences is not accepted here, the reasons for failures are often silenced and do not allow future generations to learn from the mistakes of others.
Well, let's set up a test, but close to real cluster and analyze the catastrophe by bone. We measure all the performance drawdowns, find memory leaks, analyze the process of restoring maintenance. And all this under the leadership of Artemy Kapitula, who, having spent almost a year studying the pitfalls, made the cluster performance not drop to zero in case of failure, and the latency did not jump to indecent values. And I got a red graph, which is much better.
Below you will find a video and text version of one of the best reports of DevOpsConf Russia 2018.
About speaker: Artemy Kapitula, system architect RCNTEC. The company offers solutions for IP telephony (collaboration, organization of a remote office, software-defined storage systems and power management / distribution systems). The company mainly operates in the enterprise sector, and therefore is not very well known in the DevOps market. Nevertheless, some experience has been gained with Ceph, which in many projects is used as a basic element of the storage infrastructure.
Ceph is a software-defined repository with many software components.
In the diagram:
As a rule, all data is replicated, I specifically identified three groups in the diagram, each with three OSDs, and in each of these groups there is usually one replica of data. As a result, data is stored in three copies.
Above, the cluster network is the network through which Ceph clients access data. Through it, clients communicate with the monitor, with MDS (who needs it) and with the OSD. Each client works with each OSD and with each monitor independently. Therefore, the system is devoid of a single point of failure , which is very pleasing.
Customers
● S3 Clients S3
is an API for HTTP. S3 clients work over HTTP and connect to Ceph Rados Gateway (RGW) components. They almost always communicate with the component through a dedicated network. In this network (I called it S3 network) only HTTP is used, exceptions are rare.
● Hypervisor with virtual machines
This group of clients is often used. They work with monitors and OSD, from which they receive general information about the cluster status and data distribution. For data, these clients directly go to the OSD daemons through the Cluster public network.
● RBD clients
There are also physical BR metals hosts, on which, as a rule, Linux. They are RBD clients and access images stored within a Ceph cluster (virtual machine disk images).
● CephFS-clients
The fourth group of clients, which not many people still have, but which is of increasing interest, are the clients of the CephFS cluster file system. The CephFS cluster system can be mounted simultaneously from many nodes, and all nodes access the same data from each OSD. That is, there are no Gateways per se (Samba, NFS, and others). The problem is that such a client can only be Linux, with a fairly modern version.
Our company works in the corporate market, and ESXi, HyperV and others rule the ball there. Accordingly, the Ceph cluster, which is somehow used in the corporate sector, is required to support the relevant techniques. We didn’t have enough of this in Ceph, so we had to refine and expand the Ceph cluster with our components, in fact, building something more than Ceph, our platform for storing data.
In addition, clients in the corporate sector are not on Linux, but for the most part Windows, occasionally Mac OS, cannot go into the Ceph cluster themselves. They have to run through some gateways, which in this case become narrow places.
We had to add all these components, and we got a somewhat wider cluster.

We have two central components - a group of SCSI Gateways that provide access to data in a Ceph cluster via FibreChannel or iSCSI. These components are used to connect the HyperV and ESXi to the Ceph cluster. PROXMOX clients still work in their native way - through RBD.
We do not allow file clients directly to the cluster network, they are allocated several fault-tolerant gateways. Each Gateway provides access to the file cluster system via NFS, AFP or SMB. Accordingly, almost any client, be it Linux, FreeBSD, or not just a client, server (OS X, Windows), gets access to CephFS.
In order to manage all of this, we had to actually develop our own Ceph orchestra and all our components, which are numerous. But to talk about it now makes no sense, because this is our development. Most of them will probably be interested in the “naked” Ceph itself.
Ceph is used in many places, and in some places failures occur periodically. Surely everyone who works with Ceph knows the legend about CloudMouse. This is a terrible urban legend, but everything is not as bad as it seems. There is a new tale of Rosreestr. Ceph was spinning everywhere, and his refusal was everywhere. Somewhere it ended fatally, somewhere it was possible to quickly eliminate the consequences.
Unfortunately, it is not customary to share negative experiences with us, everyone is trying to hide the relevant information. Foreign companies are a little more open, in particular, in DigitalOcean (a well-known provider that distributes virtuals), Ceph was also almost a day off, it was April 1 - a wonderful day! Some of the reports they posted, below a brief log.
The problems started at 7 in the morning, at 11 they understood what was happening, and began to eliminate the failure. To do this, they identified two teams: one for some reason ran through the servers and installed memory there, and the second for some reason manually started one server after another and carefully monitored all servers. Why? We are all used to everything turned on with one click.
What basically happens in a distributed system when it is effectively built and works almost at the limit of its abilities?
To answer this question, we need to see how the Ceph cluster works and how the failure occurs.

Ceph crash scenario
At first the cluster is working fine, everything is going great. Then something happens, after which the OSD daemons, where the data is stored, lose contact with the central components of the cluster (monitors). At this point, a timeout occurs and the entire cluster gets a stake. The cluster is worth some time until it realizes that something is wrong with it, and after that it corrects its inner knowledge. After that, customer service is restored to some extent, and the cluster is again operating in degraded mode. And the funny thing is that it works faster than in normal mode - this is an amazing fact.
Then we eliminate the failure. Suppose we have lost power, the rack is cut down completely. Electricians came running, everything was restored, power was supplied, the servers were turned on, and here the most interesting part begins .
The cluster practically stops, performs primary synchronization, and then begins a smooth, slow recovery, gradually leaving for normal mode.

The above is the performance graph of the Ceph cluster as the failure progresses. Please note that here the very intervals that we talked about are very clearly visible:
Let's try to figure out what really happened there. The first thing that interests us is a dip down at the very beginning of the chart.
OSD failure
Consider an example of a cluster with three racks, several nodes in each. If the left rack fails, all OSD daemons (not hosts!) Ping themselves with Ceph messages at a certain interval. If there is a loss of several messages, a message is sent to the monitor "I, OSD is such and such, I can not reach OSD such and such."

In this case, messages are usually grouped by hosts, that is, if two messages from different OSDs arrive on the same host, they are combined into one message. Accordingly, if OSD 11 and OSD 12 reported that they could not reach OSD 1, it would be interpreted as Host 11 complained about OSD 1. When OSD 21 and OSD 22 reported, it is interpreted as Host 21 not satisfied with OSD 1 After that, the monitor considers that OSD 1 is in the down state and notifies all about it (by changing the OSD map) of all cluster members, work continues in degraded mode.
So, here is our cluster and the failed rack (Host 5 and Host 6). Turn on Host 5 and Host 6, as the power has appeared, and ...
Ceph's internal behavior
And now the most interesting - we begin the initial synchronization of data . Since there are many replicas, they must be synchronous and in the same version. In the process of starting OSD:
The story that is collected from all OSDs is used, and this story can be quite a lot; the actual location of the set of objects in the cluster is determined, where the corresponding versions lie. How many objects are in a cluster, so many records are obtained, if the cluster has been standing for a long time in the degraded mode, then the story is big.
For comparison:The typical object size when working with an RBD image is 4 MB. When we work in erasure coded - 1MB. If we have a 10 TB disk, we get a million megabyte objects on the disk. If we have 10 disks in the server, then there are already 10 million objects, if 32 disks (we build an efficient cluster, we have a dense location), then 32 million objects that need to be kept in memory. And in fact, information about each object is stored in several copies, because each copy says that in this place it lies in this version, and in this - in this.
It turns out a huge amount of data that is placed in RAM:
Besides:
in other words, the steeper the cluster we have built, and the longer a part of the cluster did not respond, the more RAM will be required at the start .
Extreme optimizations - the root of all evil
So, a lot of RAM is required, memory consumption is growing (we started right away in a third of the cluster) and the system can in theory go to SWAP, if you have created it, of course. I think there are many people who think that SWAP is bad and they don’t create it: “Why? We have a lot of memory! ”But this is the wrong approach.
If the SWAP file is not created in advance, since it was decided that Linux will work more efficiently, then sooner or later it will happen out of memory killer (OOM killer) And it’s not a fact that it will kill the one who ate all the memory, and not the one who was not lucky first. We know what an optimistic location is - we request a memory, we are promised it, we say: “Now give it to us”, in response: “But no!” - and out of memory killer.
This is Linux full-time work, if it is not configured in the field of virtual memory.
The process gets out of memory killer and falls out quickly and ruthlessly. In this case, no other processes that he died, do not know. He did not have time to notify anyone about anything, he was simply terminated.
Then the process, of course, will restart - we have systemd, it also starts, if necessary, OSD, which have fallen. Fallen OSD start, and ... begins a chain reaction.
In our case, we started OSD 8 and OSD 9, they started to push everything, but no luck OSD 0 and OSD 5. They flew out of the memory killer and terminated them. They restarted - read their data, began to synchronize and crush the rest. Three more were unlucky (OSD 9, OSD 4 and OSD 7). These three restarted, began to put pressure on the entire cluster, the next pack was unlucky.
The cluster begins to fall apart literally before our eyes . Degradation occurs very quickly, and this “very quickly” is usually expressed in minutes, maximum, in tens of minutes. If you have 30 knots (10 knots in the rack), and knocked out the rack due to a power failure - after 6 minutes, half of the cluster lies.
So, we get something like the following.
Virtually every server we have failed OSD. And if it is on every server, that is, in every failure domain we have on the failed OSD, then most of our data is not available . Any request is blocked - for writing, for reading - no difference. Everything! We got up.
What to do in this situation? More precisely, what should have been done ?
Answer: Do not start the cluster at once, that is, the entire rack, but carefully raise one daemon.
But we didn't know that. We started right away and got what we got. In this case, we launched one of the four daemon (8, 9, 10, 11), the memory consumption will increase by about 20%. As a rule, we sustain such a jump. Then the memory consumption starts to decrease, because some of the structures that were used to hold information about how the cluster has degraded, go away. That is, part of the Placement Groups has returned to its normal state, and everything that is needed to maintain a degraded state is released — in theory, it is released .
Let's see an example. The C code on the left and on the right is almost identical, the only difference is in constants.
These two examples request a different amount of memory from the system:
Then both examples are waiting for us to photograph them in the top. And after pressing ENTER, they release the memory - all but the last piece. This is very important - the last piece remains. And again they are waiting for us to photograph them.
Below is what actually happened.

The answer, why did this happen, lies in the Linux malloc.
If we request memory in large chunks, it is issued using the anonymous mmap mechanism, which is given to the address space of the processor, from which we are then cut into memory. When we do free (), the memory is freed and the pages return to page cache (system).
If we allocate memory in small pieces, we do sbrk (). sbrk () shifts the pointer to the tail of the heap, in theory the shifted tail can be returned back by returning memory pages to the system if memory is not used.
Now look at the illustration. We had many entries in the history of the location of degraded objects, and then came the user session - a long-lived object. We synchronized and all unnecessary structures left, but the long-lived object remained, and we cannot move sbrk () back.

We still have a large unused space that could be freed if we had SWAP. But we are smart - we have disabled SWAP.
Of course, then some part of the memory from the beginning of the heap will be used, but this is only a certain part, and a very substantial remainder will be kept occupied.
What to do in this situation? The answer is below.
Controlled launch
DigitalOcean actually did this:
“It’s a team’s memory.”
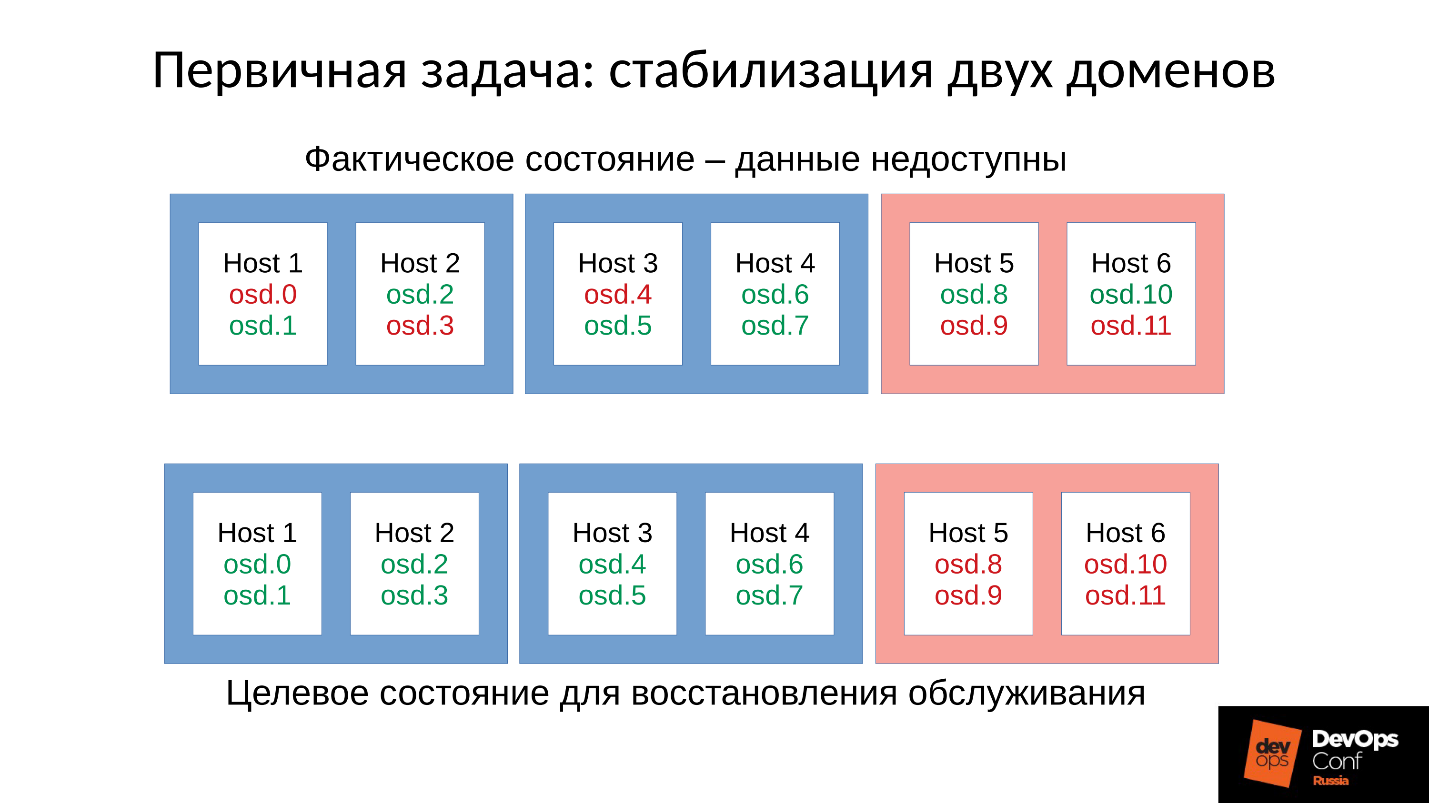
Let's return to our configuration and the current situation. Now we have a collapsed cluster after a chain reaction out of memory killer. We prohibit automatic restart of the OSD in the red domain, and one by one we start the nodes from the blue domains. Because our first task is always to restore service , without understanding why this happened. We will understand later when we restore service. In operation is always the case.
We bring the cluster to the target state in order to restore the service, and then we start to run one OSD after another according to our methodology. We are looking at the first one, restarting others if necessary, in order to adjust the memory budget, the next one - 9, 10, 11 - and the cluster seems to be synchronized and ready to start servicing.
The problem is how the recording service in Ceph is performed .
We have 3 replicas: one master OSD and two slaves for it. Let's clarify that the master / slave in each Placement Group has its own, but each has one master and two slaves.
The write or read operation goes to master. When reading, if master has the necessary version, he will give it to the client. The recording is a bit more complicated; the recording must be repeated on all replicas. Accordingly, when a client writes 64 KB in OSD 0, the same 64 KB in our example falls on OSD 5 and OSD 8.
But the fact is that here we have OSD 8 which is very much degraded, since we restarted many processes.

Since in Ceph any change is a transition from version to version, on OSD 0 and OSD 5 we will have a new version, on OSD 8 - the old one. This means that in order to repeat the recording (send out 64 KB) we need to update the version on OSD 8 - and this is 4 MB (object size). That is, we read 4 MB on OSD 0, send on OSD 8, it writes, it comes to the synchronous state. Now we have the same fresh versions everywhere, and only then we write 64 KB.
Now the numbers will go - the most interesting.
Test cluster performance:
Consequently, when one of the three domains fails, the cluster is in a degraded state for some time, and half of the hot objects spread to different versions, then half of the write operations will begin with forced recovery.
The compulsory recovery time is calculated approximately - write operations to the degraded object.
First we read 4 MB for 22 ms, we write 22 ms, and then 1 ms we write 4 Kb of data itself. A total of 45 ms per one write operation to a degraded object on the SSD, when we had a nominal performance of 1 ms - a performance drop of 45 times .
The greater the percentage of degraded objects we have, the more terrible things become.
Average service time
This is the factory mechanism of Ceph, and nothing can be done with it. If your cluster has partially been offline and at this time its other part has serviced customer requests, then after switching it on, there will be a dramatic, several dozen times, drop in performance on some operations.
Now let's look at the results of Ceph performance tests in emergency mode on two graphs at once.

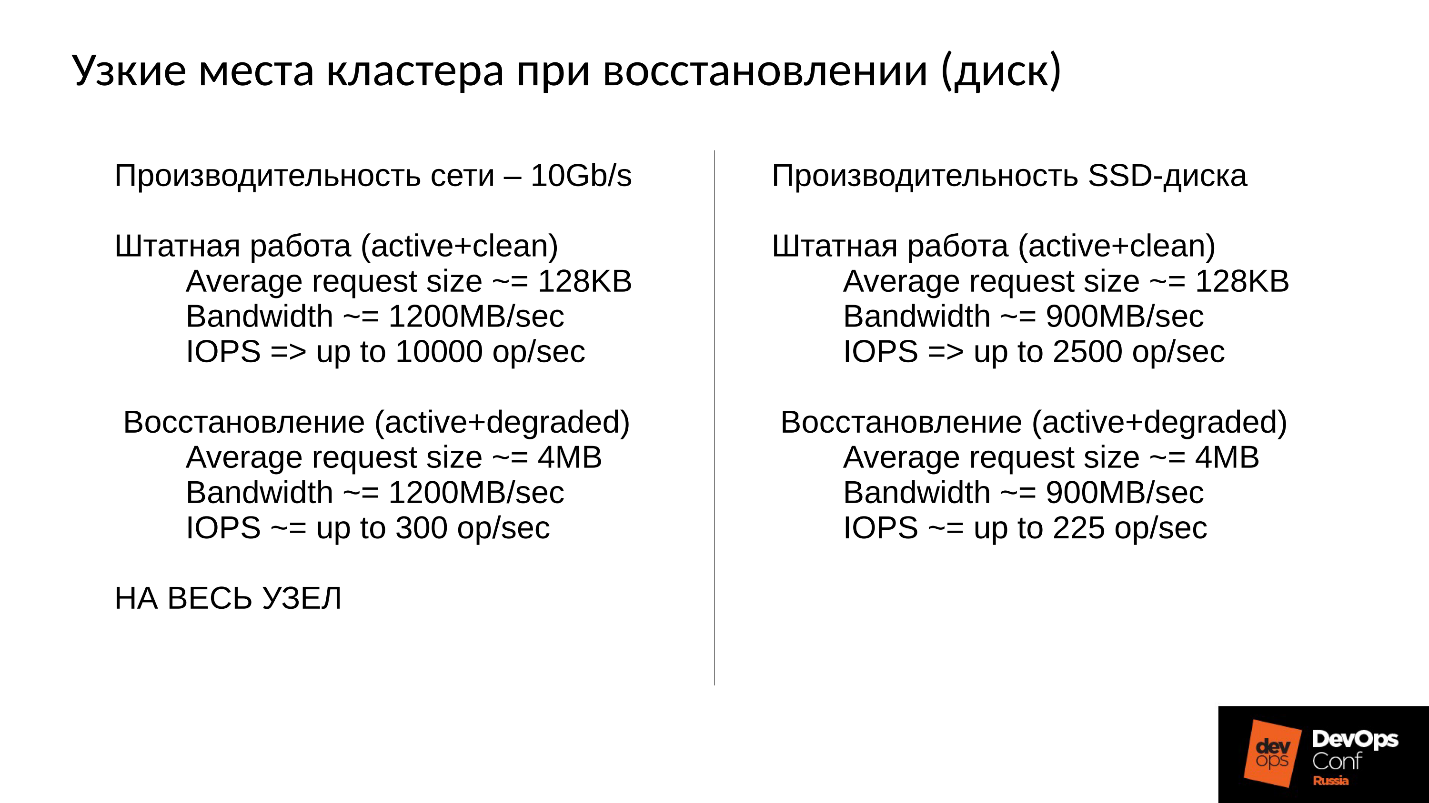
The cluster will be restored in the course of regular work, and we will rest primarily on the network. A network of 10 Gbps, that is, 1,200 Mb / s, which means 300 objects per second per server, regardless of how many disks there are. There will be 10 SSD - it is still 300 objects per second, one disk - maybe there will still be 300 objects per second.
In addition, there is still disk bandwidth. Our drive in normal mode gives 900 MB / s (this is the average SSD). Usually it serves about 2,500 operations at 128 Kb per second (as a rule, ESXi and HyperV align their requests under 128 Kb). But if we enter into degraded, we rest on 225 objects per second. And if we use the file store, and not the object store, then we also have a journal (double entry), then we generally get 110 operations per second, and everything becomes generally very, very sad.
SSD issues 110 operations per second - a catastrophe!
What we can do?
Answer 1: You can only fight architecture - to make more domains of failure .
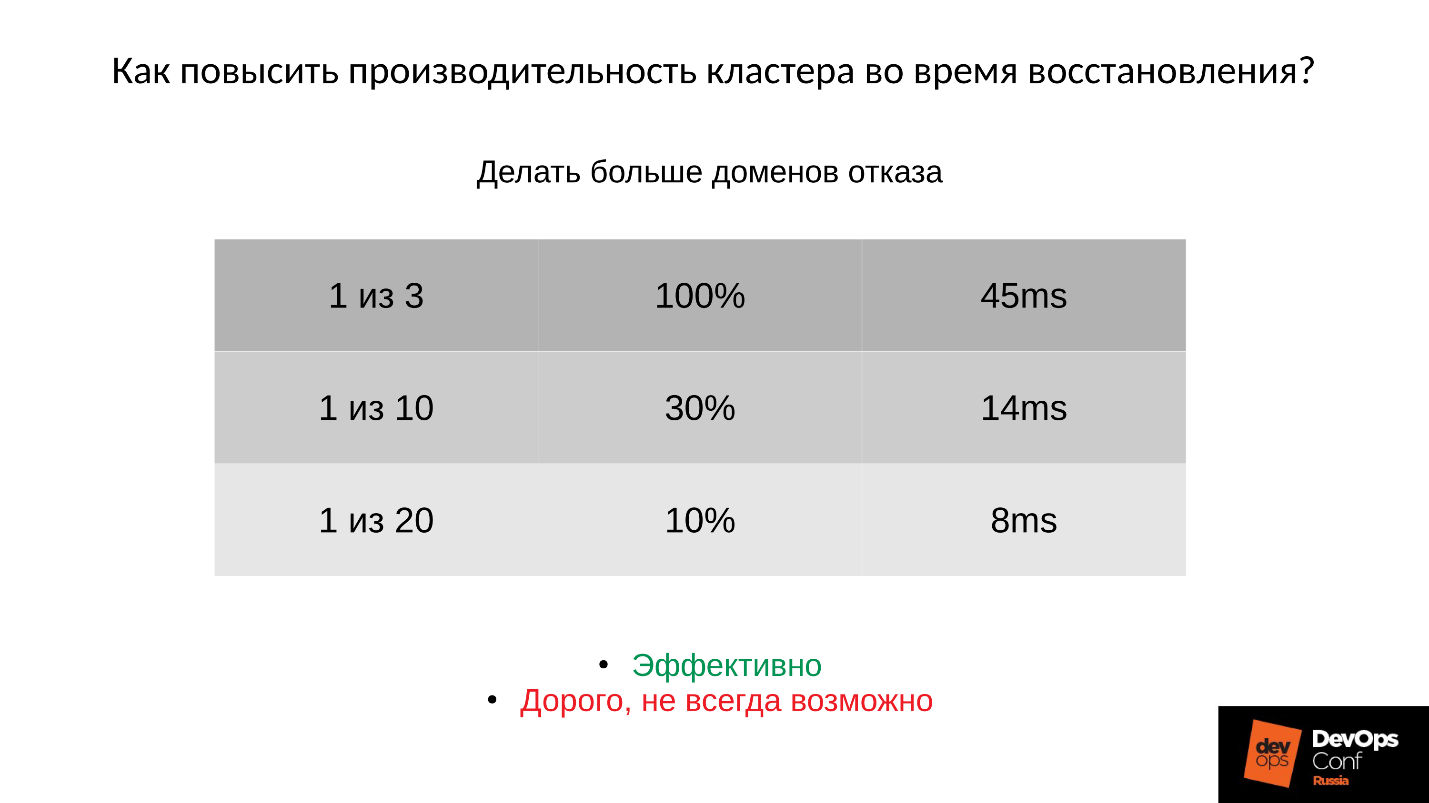
Here are the columns from left to right: how many domains failed; the percentage of degraded PG;
average service time with the corresponding failure.
If we refused:
That is, adding domains is effective, but expensive , since a domain of failure is designed for a power failure of servers, other equipment, and this is not always possible.
Answer 2: The second option is to reduce the size of the object (order, objectsize) in the image.
If we reduce the size of the object, then, for example, operations from 4 MB will become 2 or 1 MB. Then everything will be much faster, but still much slower than the normal mode. Wherein:
But you have to pay for everything:
If we created it for maximum performance (32 MB object) - then we hit it very specifically right away!
Answer 3: Another way is to refine Ceph .
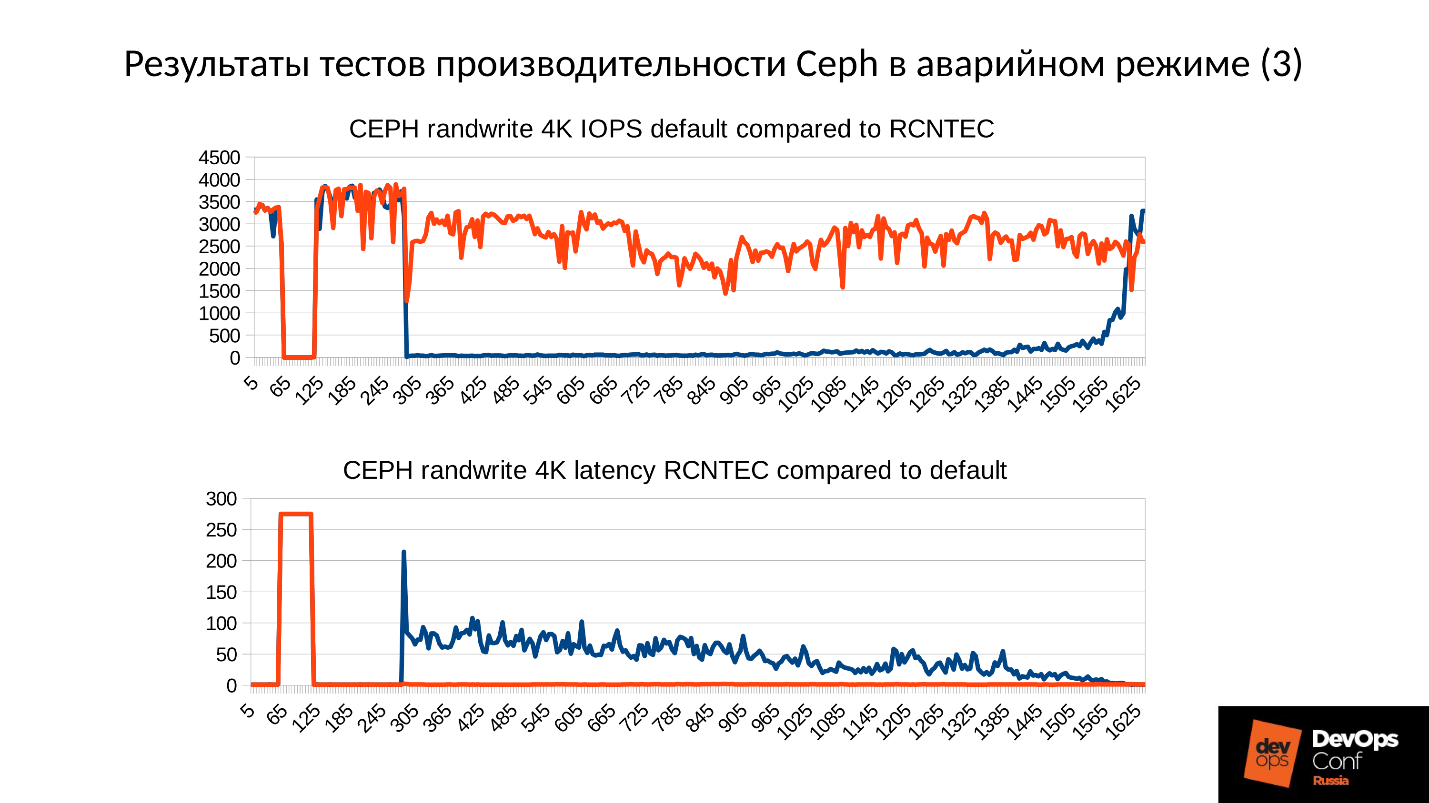
As part of the functional responsibilities, I, as a system architect and developer, climbed deep into Ceph . In the course of the survey, we managed to force the cluster not to replicate for every sushi when writing to a degraded object, but at the same time to preserve the consistency of the cluster, that is, to truncate part of the transmitted data. It turned out such an interesting picture.
On the top graph cluster performance, on the bottom - Latency. Blue - the regular schedule, red - experimental. Latency is actually growing at a minimum of 30%, just this is not visible on this scale, that is, everything is not so good.
This code is not yet in the Community, as it is in a preproduction state. It can not be included on the go, but it does not suit us. When we bring this to the end, we will do it.
Conclusion
It took about a man-year for us to get this work schedule. If you do not have the opportunity to invest so much effort, climb inside Ceph and do something cardinal there, then this is what you can do.
● It is useless to do something during an accident .
During the accident, you can not panic, you should be ready for it. This means that it is imperative to conduct exercises . Without this, all your theoretical research is useless. Moreover, it is highly recommended to conduct exercises on approximately the same configurations as your production. Because if you have little data in the teachings, then the memory problem encountered by DigitalOcean and we, you will not step on. If there is a lot of data, then come, and you will not know what to do.
In addition, if you have little data and a small load, then you will not see this hell of productivity. Clients will come to you, they will start shouting: “Nothing works for you! What happened? ”They will jerk your tech support, tech support you, you will grab his head. Everything will be sad, and we must be ready for this: to understand where we will spend, how long it will last for about down time.
● You cannot delete cluster components (OSD).
Every time you remove a seemingly slowing component, you lose some of the data — some of the data that is redundant for now, but if something goes wrong elsewhere, it may be necessary. Therefore, do not remove OSD cluster components — monitors and others — never on the go . If you do this, you are your own vicious Buratino.
● Design your cluster correctly.
It should be at the design stage to minimize the number of inaccessible OSD in case of planned work or unplanned situations. Do more failure domains if possible . If you can not, at least choose a hardware that can change disks without shutting down the server.
● Allocate enough RAM on the OSD nodes.
● Do not disable SWAP.
Behavior with SWAP is not just Ceph behavior, but generally general Linux behavior. You must be prepared for this and remember this.
● Maximize cluster replication network performance.
Let it not be used in normal mode by 100%, and even by 10%. But, if an abnormal mode happens, every extra gigabit will make your life easier, and it is very essential.
● Sometimes it makes sense to reduce the size of frequently modified RBD objects or reduce the size of an object in Rados Getway.
But remember that reducing the size of the object will require additional RAM. Do not forget to add SWAP - no need to be afraid of it. The fact that there is SWAP activity is not so bad, because, most likely, the system takes down something that is not actively used.
Well, let's set up a test, but close to real cluster and analyze the catastrophe by bone. We measure all the performance drawdowns, find memory leaks, analyze the process of restoring maintenance. And all this under the leadership of Artemy Kapitula, who, having spent almost a year studying the pitfalls, made the cluster performance not drop to zero in case of failure, and the latency did not jump to indecent values. And I got a red graph, which is much better.
Below you will find a video and text version of one of the best reports of DevOpsConf Russia 2018.
About speaker: Artemy Kapitula, system architect RCNTEC. The company offers solutions for IP telephony (collaboration, organization of a remote office, software-defined storage systems and power management / distribution systems). The company mainly operates in the enterprise sector, and therefore is not very well known in the DevOps market. Nevertheless, some experience has been gained with Ceph, which in many projects is used as a basic element of the storage infrastructure.
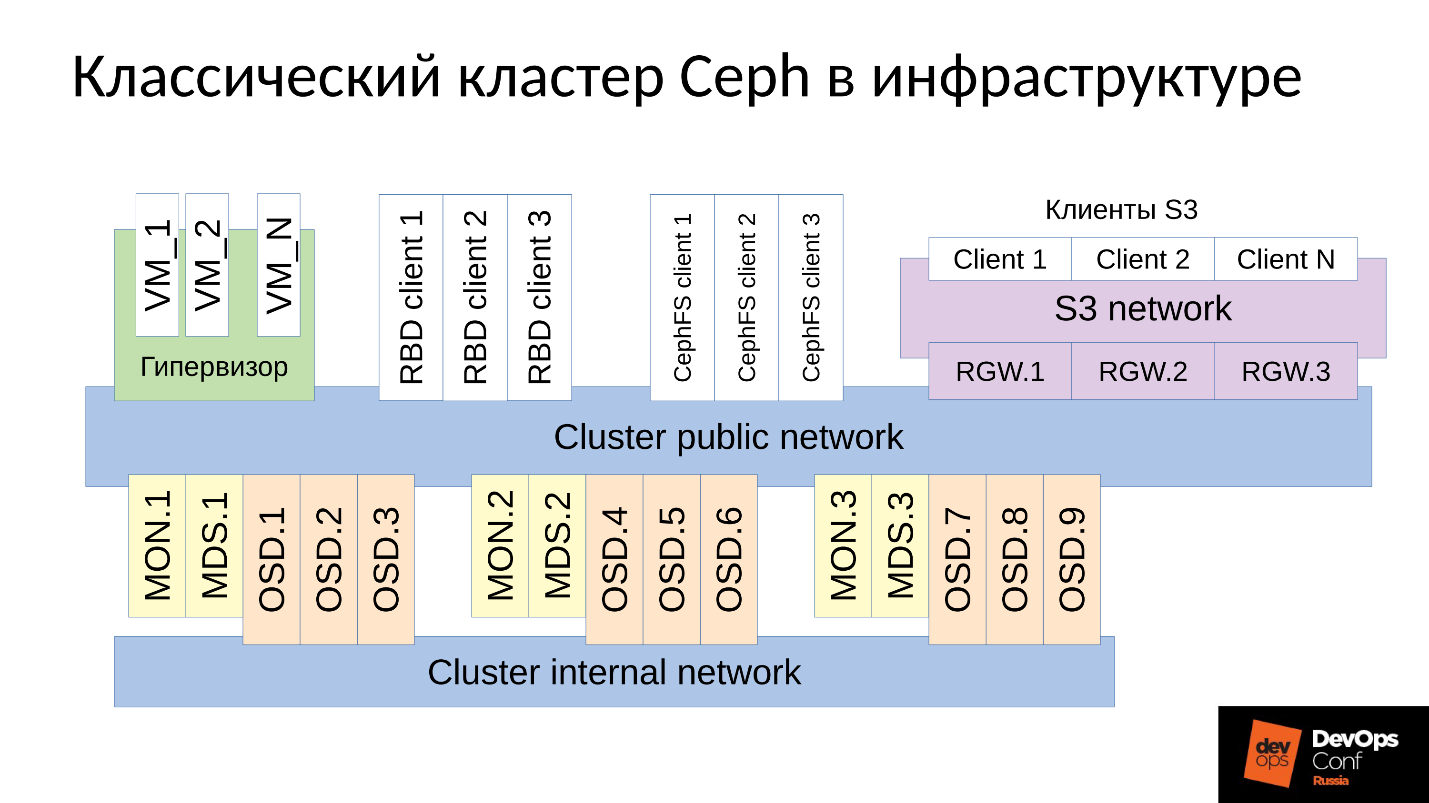
Ceph is a software-defined repository with many software components.
In the diagram:
- The upper level is an internal cluster network over which the cluster itself communicates;
- The bottom level is Ceph itself, a set of internal Ceph daemons (MON, MDS and OSD) that store data.
As a rule, all data is replicated, I specifically identified three groups in the diagram, each with three OSDs, and in each of these groups there is usually one replica of data. As a result, data is stored in three copies.
Above, the cluster network is the network through which Ceph clients access data. Through it, clients communicate with the monitor, with MDS (who needs it) and with the OSD. Each client works with each OSD and with each monitor independently. Therefore, the system is devoid of a single point of failure , which is very pleasing.
Customers
● S3 Clients S3
is an API for HTTP. S3 clients work over HTTP and connect to Ceph Rados Gateway (RGW) components. They almost always communicate with the component through a dedicated network. In this network (I called it S3 network) only HTTP is used, exceptions are rare.
● Hypervisor with virtual machines
This group of clients is often used. They work with monitors and OSD, from which they receive general information about the cluster status and data distribution. For data, these clients directly go to the OSD daemons through the Cluster public network.
● RBD clients
There are also physical BR metals hosts, on which, as a rule, Linux. They are RBD clients and access images stored within a Ceph cluster (virtual machine disk images).
● CephFS-clients
The fourth group of clients, which not many people still have, but which is of increasing interest, are the clients of the CephFS cluster file system. The CephFS cluster system can be mounted simultaneously from many nodes, and all nodes access the same data from each OSD. That is, there are no Gateways per se (Samba, NFS, and others). The problem is that such a client can only be Linux, with a fairly modern version.
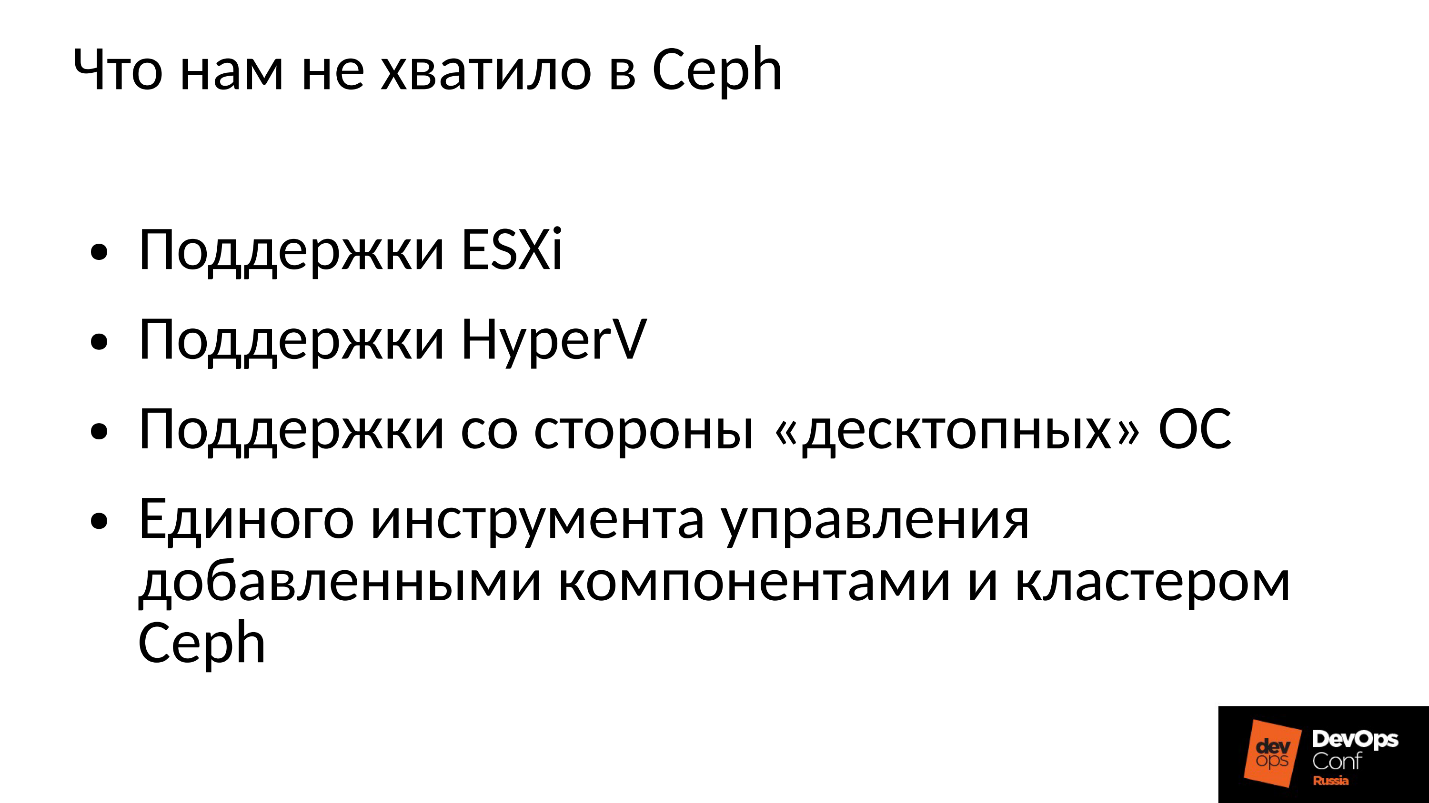
Our company works in the corporate market, and ESXi, HyperV and others rule the ball there. Accordingly, the Ceph cluster, which is somehow used in the corporate sector, is required to support the relevant techniques. We didn’t have enough of this in Ceph, so we had to refine and expand the Ceph cluster with our components, in fact, building something more than Ceph, our platform for storing data.
In addition, clients in the corporate sector are not on Linux, but for the most part Windows, occasionally Mac OS, cannot go into the Ceph cluster themselves. They have to run through some gateways, which in this case become narrow places.
We had to add all these components, and we got a somewhat wider cluster.
We have two central components - a group of SCSI Gateways that provide access to data in a Ceph cluster via FibreChannel or iSCSI. These components are used to connect the HyperV and ESXi to the Ceph cluster. PROXMOX clients still work in their native way - through RBD.
We do not allow file clients directly to the cluster network, they are allocated several fault-tolerant gateways. Each Gateway provides access to the file cluster system via NFS, AFP or SMB. Accordingly, almost any client, be it Linux, FreeBSD, or not just a client, server (OS X, Windows), gets access to CephFS.
In order to manage all of this, we had to actually develop our own Ceph orchestra and all our components, which are numerous. But to talk about it now makes no sense, because this is our development. Most of them will probably be interested in the “naked” Ceph itself.
Ceph is used in many places, and in some places failures occur periodically. Surely everyone who works with Ceph knows the legend about CloudMouse. This is a terrible urban legend, but everything is not as bad as it seems. There is a new tale of Rosreestr. Ceph was spinning everywhere, and his refusal was everywhere. Somewhere it ended fatally, somewhere it was possible to quickly eliminate the consequences.
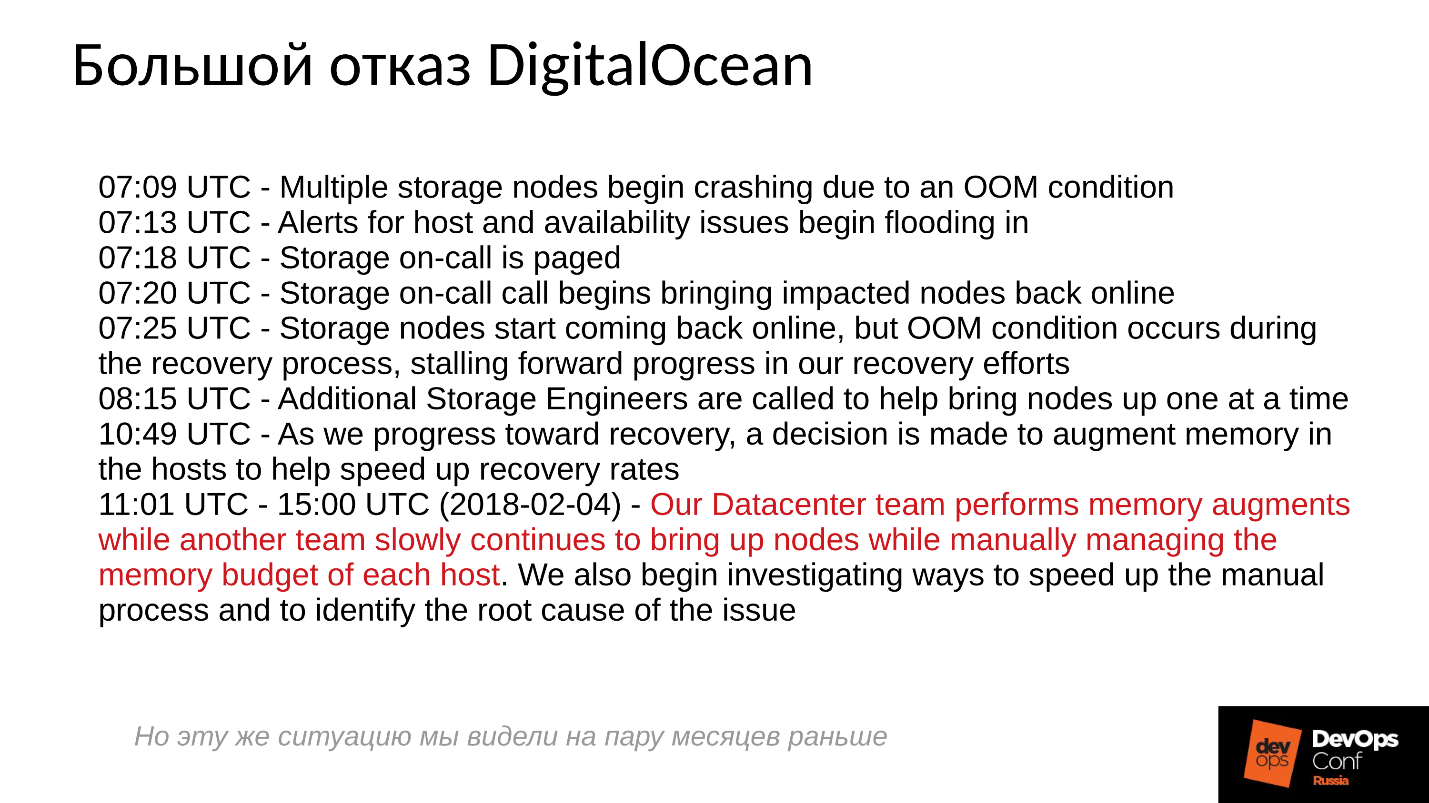
Unfortunately, it is not customary to share negative experiences with us, everyone is trying to hide the relevant information. Foreign companies are a little more open, in particular, in DigitalOcean (a well-known provider that distributes virtuals), Ceph was also almost a day off, it was April 1 - a wonderful day! Some of the reports they posted, below a brief log.
The problems started at 7 in the morning, at 11 they understood what was happening, and began to eliminate the failure. To do this, they identified two teams: one for some reason ran through the servers and installed memory there, and the second for some reason manually started one server after another and carefully monitored all servers. Why? We are all used to everything turned on with one click.
What basically happens in a distributed system when it is effectively built and works almost at the limit of its abilities?
To answer this question, we need to see how the Ceph cluster works and how the failure occurs.
Ceph crash scenario
At first the cluster is working fine, everything is going great. Then something happens, after which the OSD daemons, where the data is stored, lose contact with the central components of the cluster (monitors). At this point, a timeout occurs and the entire cluster gets a stake. The cluster is worth some time until it realizes that something is wrong with it, and after that it corrects its inner knowledge. After that, customer service is restored to some extent, and the cluster is again operating in degraded mode. And the funny thing is that it works faster than in normal mode - this is an amazing fact.
Then we eliminate the failure. Suppose we have lost power, the rack is cut down completely. Electricians came running, everything was restored, power was supplied, the servers were turned on, and here the most interesting part begins .
Everyone is used to the fact that when a server fails, everything becomes bad, and when we turn on the server, everything becomes good. Here everything is completely wrong.
The cluster practically stops, performs primary synchronization, and then begins a smooth, slow recovery, gradually leaving for normal mode.
The above is the performance graph of the Ceph cluster as the failure progresses. Please note that here the very intervals that we talked about are very clearly visible:
- Normal operation up to about 70 seconds;
- Fail to a minute to about 130 seconds;
- The plateau, which is noticeably higher than normal operation, is the work of degraded clusters;
- Then we include the missing node - this is a training cluster, there are only 3 servers and 15 SSDs. We start the server to work somewhere around 260 seconds.
- The server turned on, entered the cluster - IOPS fell.
Let's try to figure out what really happened there. The first thing that interests us is a dip down at the very beginning of the chart.
OSD failure
Consider an example of a cluster with three racks, several nodes in each. If the left rack fails, all OSD daemons (not hosts!) Ping themselves with Ceph messages at a certain interval. If there is a loss of several messages, a message is sent to the monitor "I, OSD is such and such, I can not reach OSD such and such."
In this case, messages are usually grouped by hosts, that is, if two messages from different OSDs arrive on the same host, they are combined into one message. Accordingly, if OSD 11 and OSD 12 reported that they could not reach OSD 1, it would be interpreted as Host 11 complained about OSD 1. When OSD 21 and OSD 22 reported, it is interpreted as Host 21 not satisfied with OSD 1 After that, the monitor considers that OSD 1 is in the down state and notifies all about it (by changing the OSD map) of all cluster members, work continues in degraded mode.
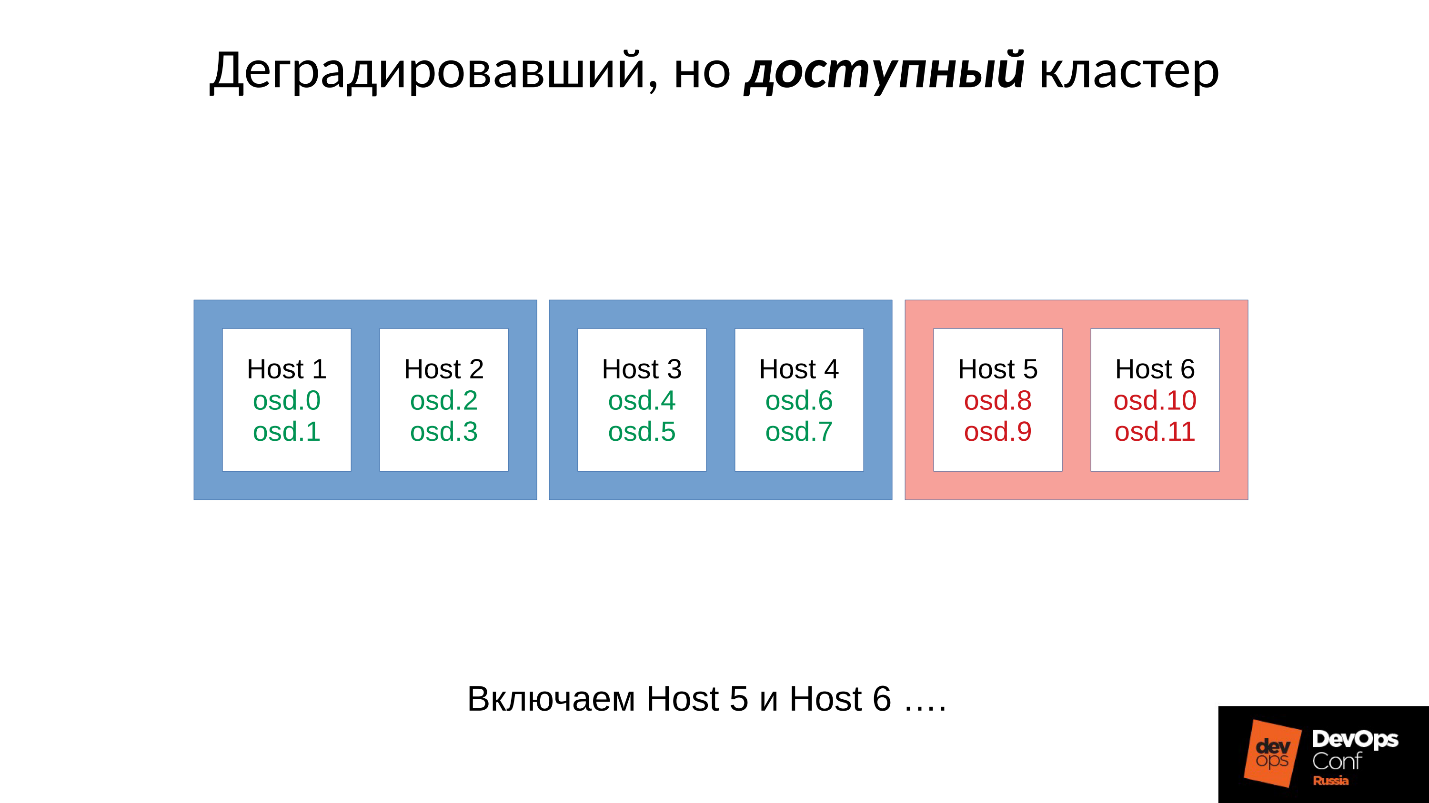
So, here is our cluster and the failed rack (Host 5 and Host 6). Turn on Host 5 and Host 6, as the power has appeared, and ...
Ceph's internal behavior
And now the most interesting - we begin the initial synchronization of data . Since there are many replicas, they must be synchronous and in the same version. In the process of starting OSD:
- OSD reads available versions, existing history (pg_log - to determine the current versions of objects).
- Then it determines which OSD the latest versions of the degraded objects (missing_loc) are on, and which are the backward ones.
- Where backward versions are stored, you need to synchronize, and new versions can be used as reference ones for reading and writing data.
The story that is collected from all OSDs is used, and this story can be quite a lot; the actual location of the set of objects in the cluster is determined, where the corresponding versions lie. How many objects are in a cluster, so many records are obtained, if the cluster has been standing for a long time in the degraded mode, then the story is big.
For comparison:The typical object size when working with an RBD image is 4 MB. When we work in erasure coded - 1MB. If we have a 10 TB disk, we get a million megabyte objects on the disk. If we have 10 disks in the server, then there are already 10 million objects, if 32 disks (we build an efficient cluster, we have a dense location), then 32 million objects that need to be kept in memory. And in fact, information about each object is stored in several copies, because each copy says that in this place it lies in this version, and in this - in this.
It turns out a huge amount of data that is placed in RAM:
- the more objects, the greater the history of the missing_loc;
- the more PG - the more pg_log and OSD map;
Besides:
- the larger disk size;
- the higher the density (the number of disks in each server);
- the higher the load on the cluster and the faster your cluster;
- the longer the OSD is down (in the Offline state);
in other words, the steeper the cluster we have built, and the longer a part of the cluster did not respond, the more RAM will be required at the start .
Extreme optimizations - the root of all evil
"... and to the bad boys and girls at night comes the black OOM and kills all the processes right and left"
City sisadminskaya legend
So, a lot of RAM is required, memory consumption is growing (we started right away in a third of the cluster) and the system can in theory go to SWAP, if you have created it, of course. I think there are many people who think that SWAP is bad and they don’t create it: “Why? We have a lot of memory! ”But this is the wrong approach.
If the SWAP file is not created in advance, since it was decided that Linux will work more efficiently, then sooner or later it will happen out of memory killer (OOM killer) And it’s not a fact that it will kill the one who ate all the memory, and not the one who was not lucky first. We know what an optimistic location is - we request a memory, we are promised it, we say: “Now give it to us”, in response: “But no!” - and out of memory killer.
This is Linux full-time work, if it is not configured in the field of virtual memory.
The process gets out of memory killer and falls out quickly and ruthlessly. In this case, no other processes that he died, do not know. He did not have time to notify anyone about anything, he was simply terminated.
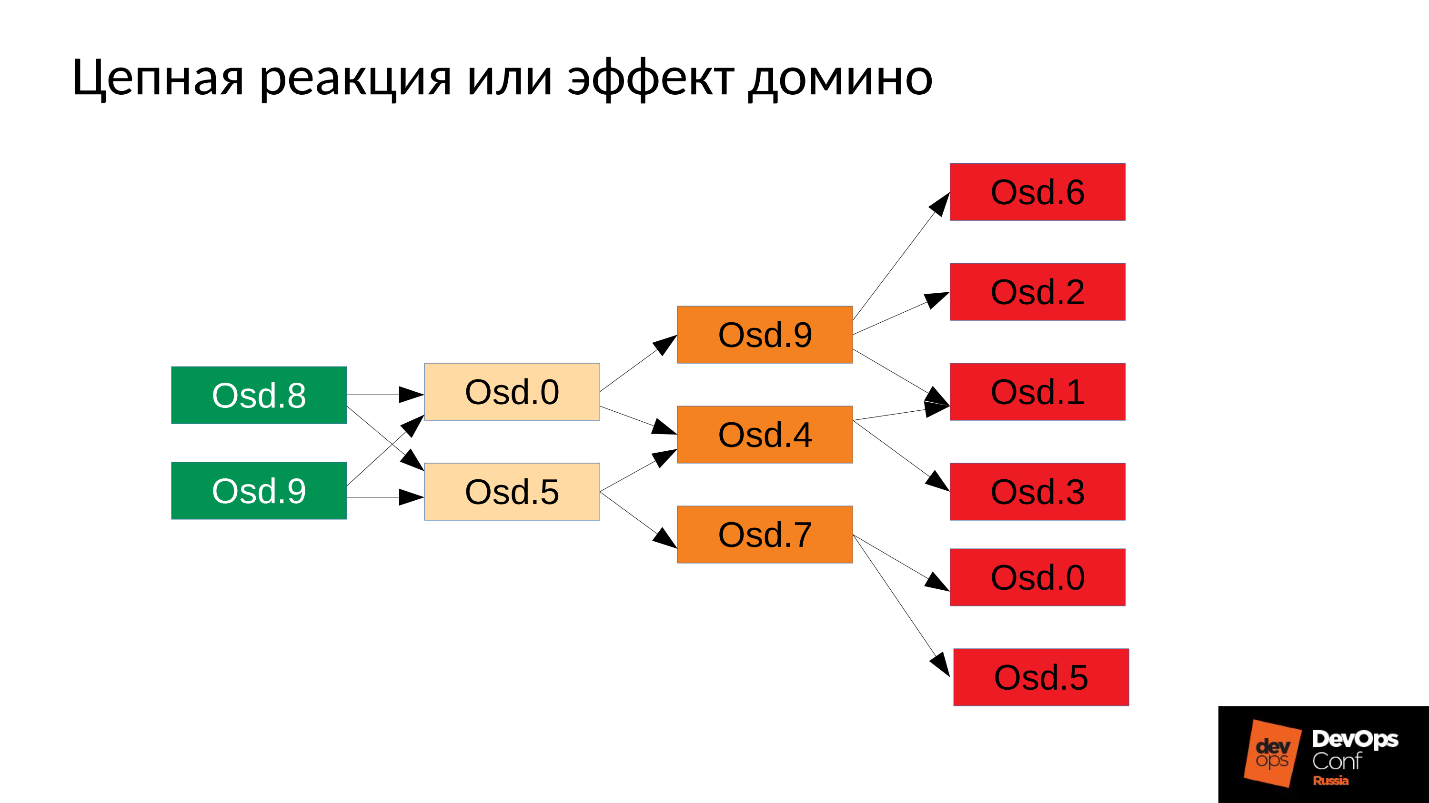
Then the process, of course, will restart - we have systemd, it also starts, if necessary, OSD, which have fallen. Fallen OSD start, and ... begins a chain reaction.
In our case, we started OSD 8 and OSD 9, they started to push everything, but no luck OSD 0 and OSD 5. They flew out of the memory killer and terminated them. They restarted - read their data, began to synchronize and crush the rest. Three more were unlucky (OSD 9, OSD 4 and OSD 7). These three restarted, began to put pressure on the entire cluster, the next pack was unlucky.
The cluster begins to fall apart literally before our eyes . Degradation occurs very quickly, and this “very quickly” is usually expressed in minutes, maximum, in tens of minutes. If you have 30 knots (10 knots in the rack), and knocked out the rack due to a power failure - after 6 minutes, half of the cluster lies.
So, we get something like the following.
Virtually every server we have failed OSD. And if it is on every server, that is, in every failure domain we have on the failed OSD, then most of our data is not available . Any request is blocked - for writing, for reading - no difference. Everything! We got up.
What to do in this situation? More precisely, what should have been done ?
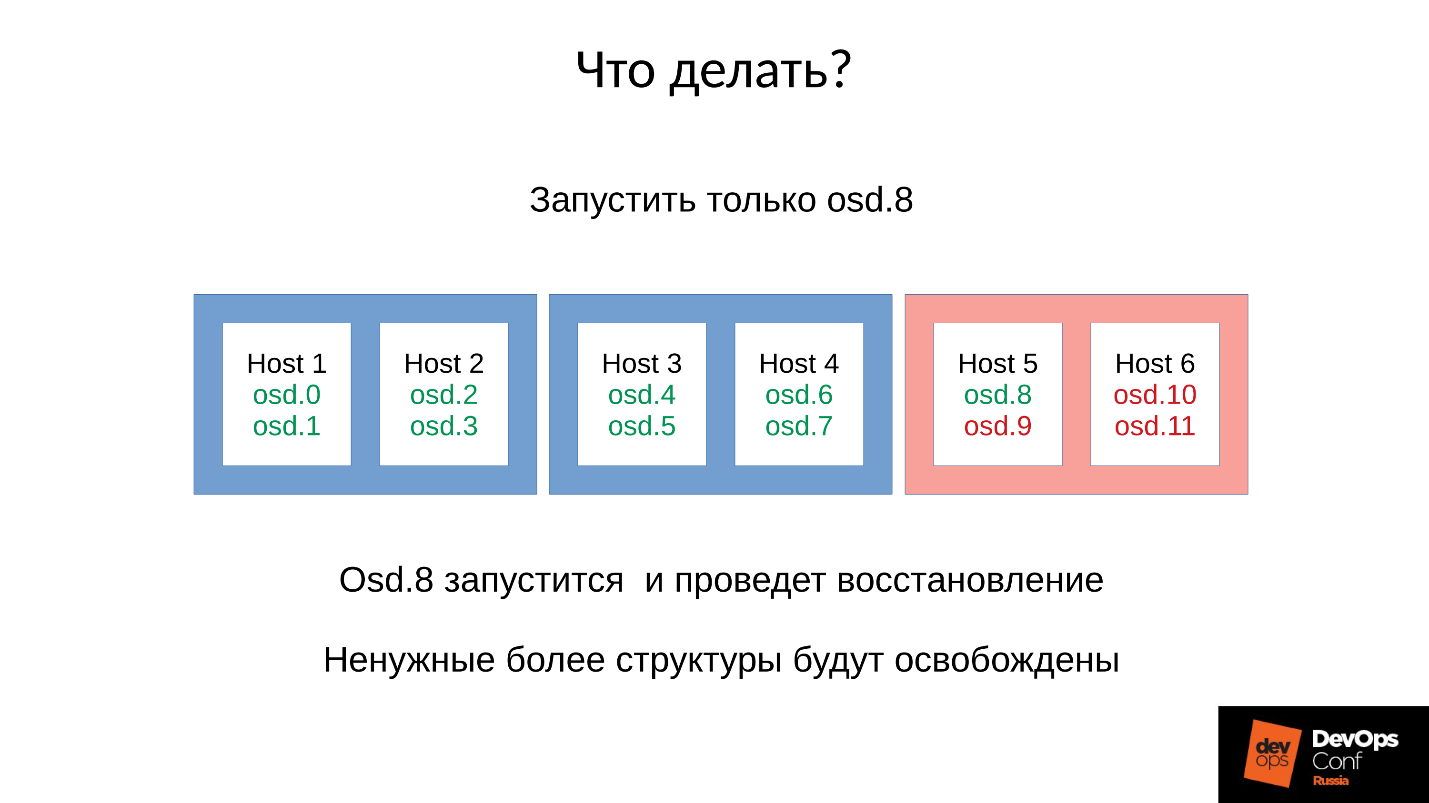
Answer: Do not start the cluster at once, that is, the entire rack, but carefully raise one daemon.
But we didn't know that. We started right away and got what we got. In this case, we launched one of the four daemon (8, 9, 10, 11), the memory consumption will increase by about 20%. As a rule, we sustain such a jump. Then the memory consumption starts to decrease, because some of the structures that were used to hold information about how the cluster has degraded, go away. That is, part of the Placement Groups has returned to its normal state, and everything that is needed to maintain a degraded state is released — in theory, it is released .
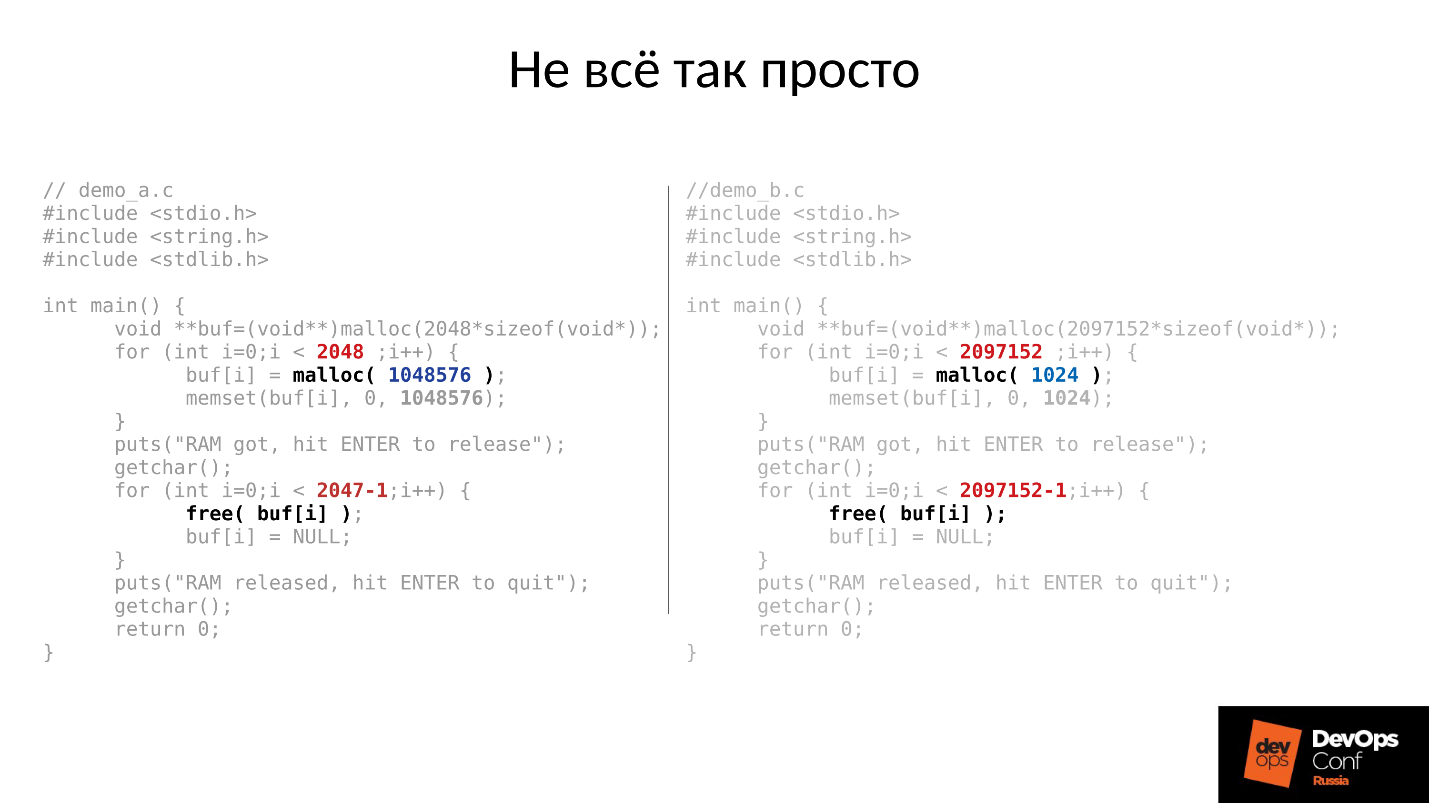
Let's see an example. The C code on the left and on the right is almost identical, the only difference is in constants.
These two examples request a different amount of memory from the system:
- left - 2048 pieces of 1 MB;
- right - 2097152 pieces of 1 KB.
Then both examples are waiting for us to photograph them in the top. And after pressing ENTER, they release the memory - all but the last piece. This is very important - the last piece remains. And again they are waiting for us to photograph them.
Below is what actually happened.
- At first, both processes started and ate the memory. It looks like the truth - 2 GB of RSS.
- We press ENTER and we are surprised. The first program, which allocated in large pieces, the memory returned. But the second program did not return.
The answer, why did this happen, lies in the Linux malloc.
If we request memory in large chunks, it is issued using the anonymous mmap mechanism, which is given to the address space of the processor, from which we are then cut into memory. When we do free (), the memory is freed and the pages return to page cache (system).
If we allocate memory in small pieces, we do sbrk (). sbrk () shifts the pointer to the tail of the heap, in theory the shifted tail can be returned back by returning memory pages to the system if memory is not used.
Now look at the illustration. We had many entries in the history of the location of degraded objects, and then came the user session - a long-lived object. We synchronized and all unnecessary structures left, but the long-lived object remained, and we cannot move sbrk () back.
We still have a large unused space that could be freed if we had SWAP. But we are smart - we have disabled SWAP.
Of course, then some part of the memory from the beginning of the heap will be used, but this is only a certain part, and a very substantial remainder will be kept occupied.
What to do in this situation? The answer is below.
Controlled launch
- We start one OSD demon.
- We are waiting for it to synchronize, check the memory budgets.
- If we understand that we will sustain the start of the next demon, we start the next one.
- If not, then quickly restart the daemon that occupied the most memory. He was able to down for a short time, he doesn’t have much history, there are missing locs and other things, so he will eat less memory, the memory budget will increase slightly.
- Run through the cluster, control it, and gradually raise everything.
- Check whether you can proceed to the next OSD, go to it.
DigitalOcean actually did this:
“It’s a team’s memory.”
Let's return to our configuration and the current situation. Now we have a collapsed cluster after a chain reaction out of memory killer. We prohibit automatic restart of the OSD in the red domain, and one by one we start the nodes from the blue domains. Because our first task is always to restore service , without understanding why this happened. We will understand later when we restore service. In operation is always the case.
We bring the cluster to the target state in order to restore the service, and then we start to run one OSD after another according to our methodology. We are looking at the first one, restarting others if necessary, in order to adjust the memory budget, the next one - 9, 10, 11 - and the cluster seems to be synchronized and ready to start servicing.
The problem is how the recording service in Ceph is performed .
We have 3 replicas: one master OSD and two slaves for it. Let's clarify that the master / slave in each Placement Group has its own, but each has one master and two slaves.
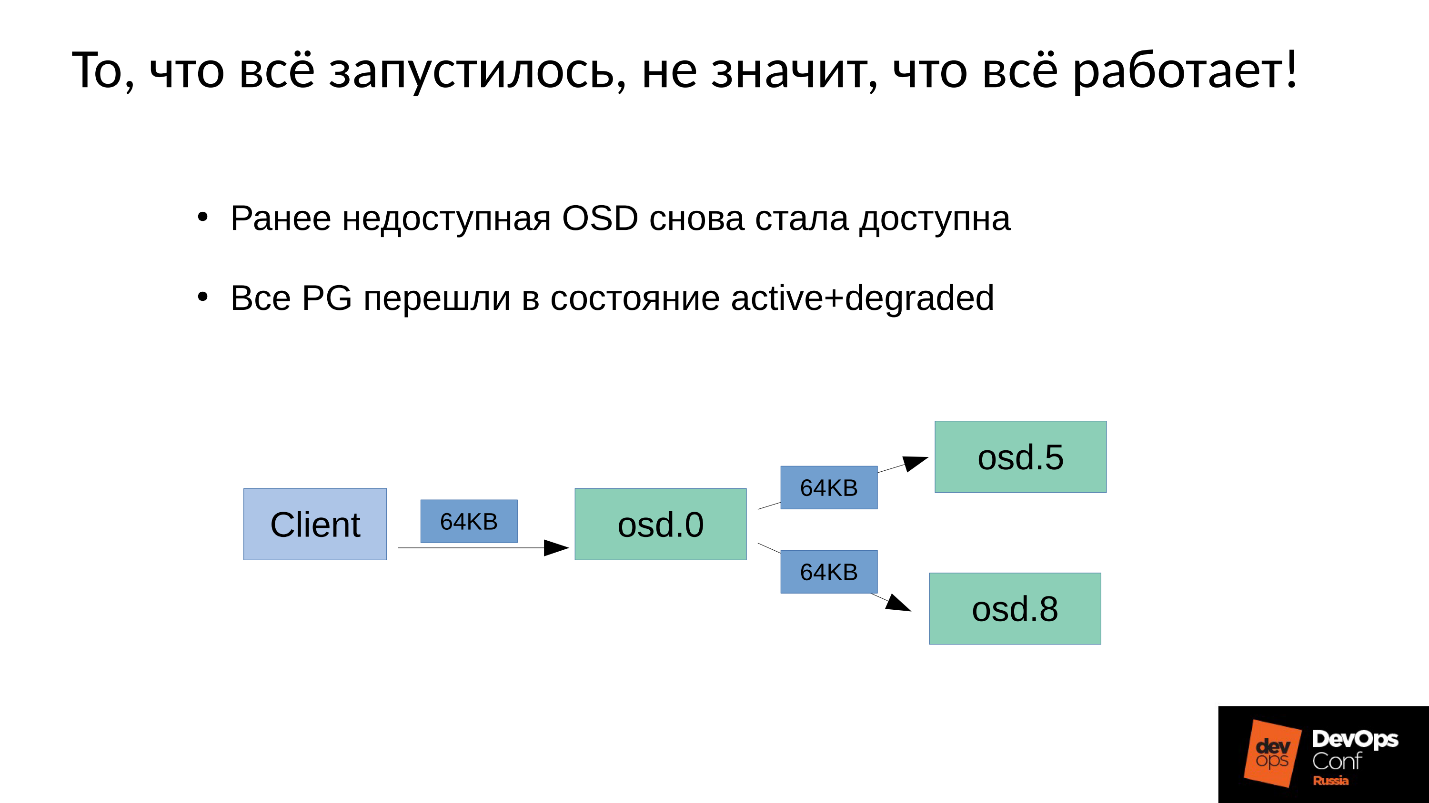
The write or read operation goes to master. When reading, if master has the necessary version, he will give it to the client. The recording is a bit more complicated; the recording must be repeated on all replicas. Accordingly, when a client writes 64 KB in OSD 0, the same 64 KB in our example falls on OSD 5 and OSD 8.
But the fact is that here we have OSD 8 which is very much degraded, since we restarted many processes.
Since in Ceph any change is a transition from version to version, on OSD 0 and OSD 5 we will have a new version, on OSD 8 - the old one. This means that in order to repeat the recording (send out 64 KB) we need to update the version on OSD 8 - and this is 4 MB (object size). That is, we read 4 MB on OSD 0, send on OSD 8, it writes, it comes to the synchronous state. Now we have the same fresh versions everywhere, and only then we write 64 KB.
Now the numbers will go - the most interesting.
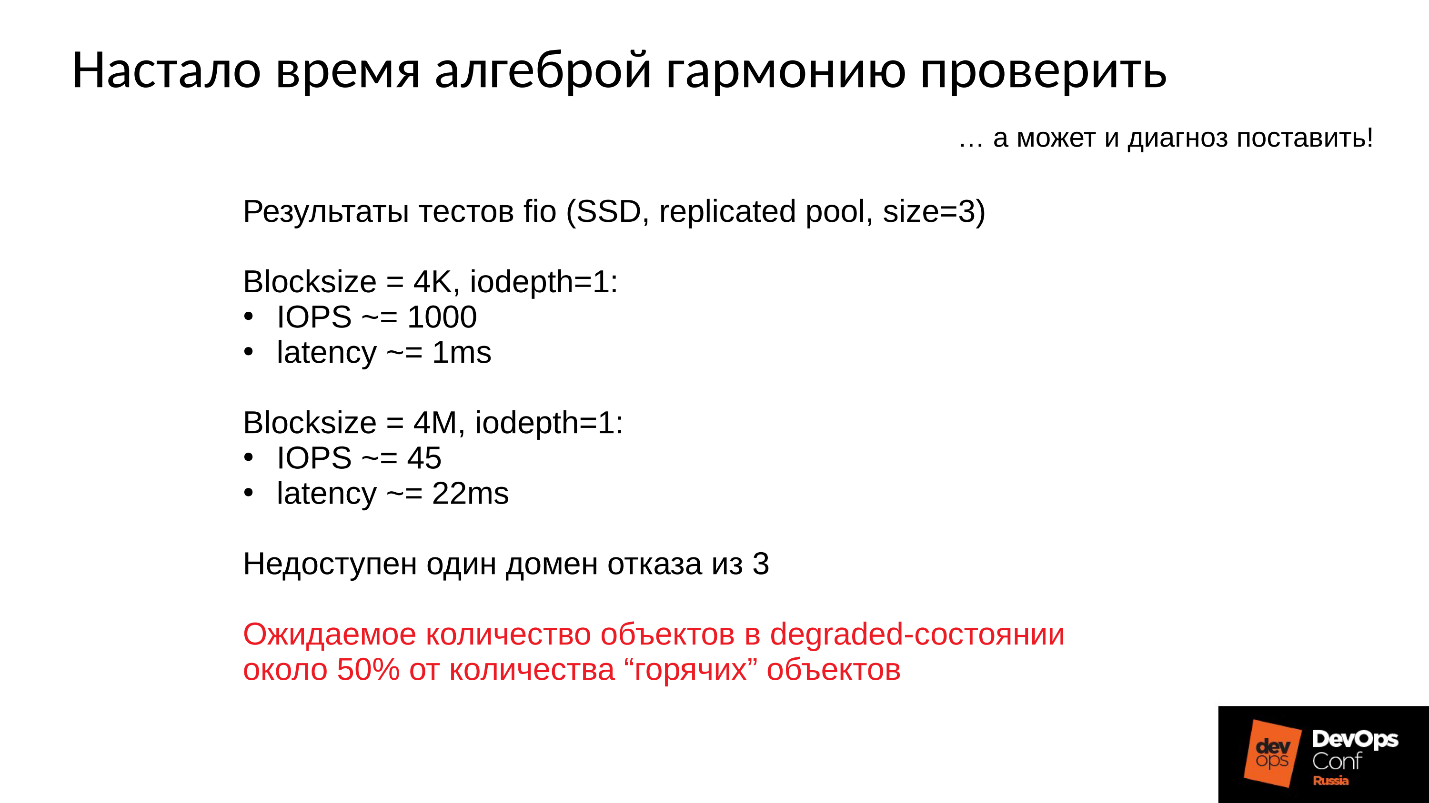
Test cluster performance:
- A 4 KB write operation takes 1 ms, a performance of 1000 operations / second in 1 stream.
- An operation of 4 MB in size (object size) takes 22 ms, the performance is 45 operations / second.
Consequently, when one of the three domains fails, the cluster is in a degraded state for some time, and half of the hot objects spread to different versions, then half of the write operations will begin with forced recovery.
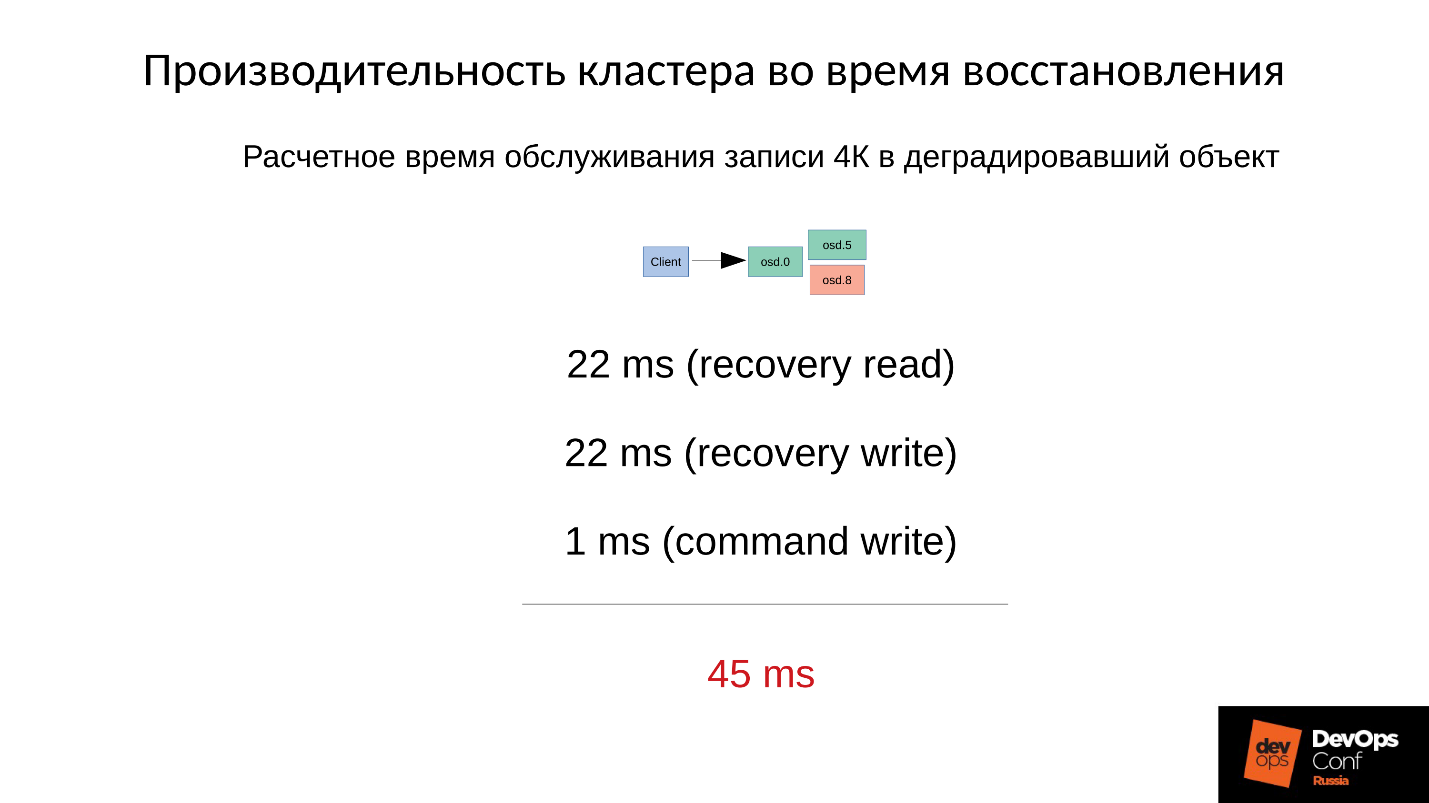
The compulsory recovery time is calculated approximately - write operations to the degraded object.
First we read 4 MB for 22 ms, we write 22 ms, and then 1 ms we write 4 Kb of data itself. A total of 45 ms per one write operation to a degraded object on the SSD, when we had a nominal performance of 1 ms - a performance drop of 45 times .
The greater the percentage of degraded objects we have, the more terrible things become.
Average service time
- When half of the objects have degraded , the average service time is (45 + 1) / 2 = 23 ms.
- If 75% of objects have degraded , then (45 * 3 + 1) / 4 = 34 ms .
- If 90% - (45 * 9 + 1) / 10 = 41 ms - 40 times slower than the normal mode.
This is the factory mechanism of Ceph, and nothing can be done with it. If your cluster has partially been offline and at this time its other part has serviced customer requests, then after switching it on, there will be a dramatic, several dozen times, drop in performance on some operations.
Now let's look at the results of Ceph performance tests in emergency mode on two graphs at once.
- The lower graph is familiar to us - this is cluster performance: normal mode, failure, failure detection, degraded mode, work in degraded mode.
- Above - latency. Here, in fact, latency is even worse than we expected. This cluster degraded by almost 100% during the test (I specifically held it longer so that the pictures were spectacular and the depth of the lesion reached you). Latency from 60 ms due to overhead costs, which we did not take into account in the initial calculations.
The cluster will be restored in the course of regular work, and we will rest primarily on the network. A network of 10 Gbps, that is, 1,200 Mb / s, which means 300 objects per second per server, regardless of how many disks there are. There will be 10 SSD - it is still 300 objects per second, one disk - maybe there will still be 300 objects per second.
We built an efficient cluster, and got into a replication network.
In addition, there is still disk bandwidth. Our drive in normal mode gives 900 MB / s (this is the average SSD). Usually it serves about 2,500 operations at 128 Kb per second (as a rule, ESXi and HyperV align their requests under 128 Kb). But if we enter into degraded, we rest on 225 objects per second. And if we use the file store, and not the object store, then we also have a journal (double entry), then we generally get 110 operations per second, and everything becomes generally very, very sad.
SSD issues 110 operations per second - a catastrophe!
What we can do?
Answer 1: You can only fight architecture - to make more domains of failure .
Here are the columns from left to right: how many domains failed; the percentage of degraded PG;
average service time with the corresponding failure.
If we refused:
- One domain of three, then 45 ms is an optimistic estimate.
- One domain out of ten (according to the theory of probability with the mat. Expectations), turns out about 14 ms.
- One domain of twenty, then 8 ms (degraded approximately 10% PG).
That is, adding domains is effective, but expensive , since a domain of failure is designed for a power failure of servers, other equipment, and this is not always possible.
Answer 2: The second option is to reduce the size of the object (order, objectsize) in the image.
If we reduce the size of the object, then, for example, operations from 4 MB will become 2 or 1 MB. Then everything will be much faster, but still much slower than the normal mode. Wherein:
- the replication time of the object is multiplied;
- proportionally decreases maintenance time (latency) on the cluster during recovery.
But you have to pay for everything:
- the number of objects is multiplied;
- memory consumption increases by almost a factor;
- the most annoying thing is that it is impossible to resize an object for an already created image. How it was created in 4 MB will remain so.
If we created it for maximum performance (32 MB object) - then we hit it very specifically right away!
Answer 3: Another way is to refine Ceph .
As part of the functional responsibilities, I, as a system architect and developer, climbed deep into Ceph . In the course of the survey, we managed to force the cluster not to replicate for every sushi when writing to a degraded object, but at the same time to preserve the consistency of the cluster, that is, to truncate part of the transmitted data. It turned out such an interesting picture.
On the top graph cluster performance, on the bottom - Latency. Blue - the regular schedule, red - experimental. Latency is actually growing at a minimum of 30%, just this is not visible on this scale, that is, everything is not so good.
This code is not yet in the Community, as it is in a preproduction state. It can not be included on the go, but it does not suit us. When we bring this to the end, we will do it.
Conclusion
It took about a man-year for us to get this work schedule. If you do not have the opportunity to invest so much effort, climb inside Ceph and do something cardinal there, then this is what you can do.
● It is useless to do something during an accident .
During the accident, you can not panic, you should be ready for it. This means that it is imperative to conduct exercises . Without this, all your theoretical research is useless. Moreover, it is highly recommended to conduct exercises on approximately the same configurations as your production. Because if you have little data in the teachings, then the memory problem encountered by DigitalOcean and we, you will not step on. If there is a lot of data, then come, and you will not know what to do.
In addition, if you have little data and a small load, then you will not see this hell of productivity. Clients will come to you, they will start shouting: “Nothing works for you! What happened? ”They will jerk your tech support, tech support you, you will grab his head. Everything will be sad, and we must be ready for this: to understand where we will spend, how long it will last for about down time.
● You cannot delete cluster components (OSD).
Every time you remove a seemingly slowing component, you lose some of the data — some of the data that is redundant for now, but if something goes wrong elsewhere, it may be necessary. Therefore, do not remove OSD cluster components — monitors and others — never on the go . If you do this, you are your own vicious Buratino.
● Design your cluster correctly.
It should be at the design stage to minimize the number of inaccessible OSD in case of planned work or unplanned situations. Do more failure domains if possible . If you can not, at least choose a hardware that can change disks without shutting down the server.
● Allocate enough RAM on the OSD nodes.
● Do not disable SWAP.
Behavior with SWAP is not just Ceph behavior, but generally general Linux behavior. You must be prepared for this and remember this.
● Maximize cluster replication network performance.
Let it not be used in normal mode by 100%, and even by 10%. But, if an abnormal mode happens, every extra gigabit will make your life easier, and it is very essential.
● Sometimes it makes sense to reduce the size of frequently modified RBD objects or reduce the size of an object in Rados Getway.
But remember that reducing the size of the object will require additional RAM. Do not forget to add SWAP - no need to be afraid of it. The fact that there is SWAP activity is not so bad, because, most likely, the system takes down something that is not actively used.
This article is a transcript of one of the best DevOpsConf Russia reports. Soon we will open the video and publish in the text version more interesting topics. Subscribe here, on youtube or in the newsletter , if you want to not miss such useful materials and be aware of DevOps news.