February 7, 2017 at 13:27
Analysis of the class of non-stationary processes with stationary increments in stock markets
The purpose of this article is to share the results of a study to identify the structure in the values of stock prices traded on the Moscow Exchange and the NYSE, by checking their stationarity using the Dickey-Fuller test.
There is a small class of stocks, which is a non-stationary process with stationary increments and the distribution of t-statistics which behaves in a rather curious way, namely it does not tend to a standard normal distribution with an increase in the number of observations. How to identify such shares?
The first thing we need is a list of tickers that you can actually trade through one of the brokers. A ticker is a short name in the stock information of quoted instruments (in this case, stocks). I will start with the Russian stock market. We have the most popular exchange - Moscow, so let's talk about it.
At some point in my life, I went offline and entered into a brokerage service agreement with Sberbank. In this situation, the list of tickers can be obtained quite simply. It is enough to download the QUIK system, order a stock quotes flow for stocks:

Then display them on the Trade tab and save the table to a file. A total of 296 tickers. If you don’t really want to arrange a quest for yourself, then a list of tickers can be found in the Data Examples section on the Moscow Exchange website. The only one, perhaps this list is out of date.
The second thing we need is stock price data. How many of them are needed to draw up an adequate picture of the market and for what period of time to take them is a matter of debate. The technical limitation that we will encounter further is a minimum of 10 values for each stock.
I wanted to take data on stock closing prices for 2016 (252 trading days) from the previously received tickers, but you can take data for a shorter period, you can even do research inside the day. By and large, it’s not so important for us now which data we will take. The only thing is, if we go to the Moscow Exchange and ask her for archival data for 2016, she will tell us that 32,400 rubles must be paid for the whole thing (earlier, by the way, the data cost even more). I wrote a parser out of harm.
In fact, it’s much faster to get data from the finals or from Yahoo Finance, but for some reason it's not so much fun. At one time, I even contacted the head of the information audit group and asked if I could parse their site for research. I was allowed.
[There were a lot of letters and code about the parser, but I deleted everything because it is probably not very interesting. If I am mistaken, write, I will publish the parser as a separate article.]
I managed to collect data for 289 stocks (there were no data on the rest). For convenience, tickers and prices were saved in the Microsoft SQL Server database. Now move on to math.
If we talk about stationarity without any formulas and complex concepts, the point is that the stationary series does not change its characteristics over time, such as expectation, variance and covariance.
The stock price can be considered as an autoregressive process of the order of 1:


where - parameter model
  - white noise
  . Such a process is stationary provided
  .
.
Suppose we have stock prices for 252 trading days. How can we determine from the available observations whether such an autoregressive process is stationary or not? It is necessary to conduct a standard procedure for testing a hypothesis :
:  (i.e., the process is not stationary) against an alternative hypothesis
  :
:  (i.e., the process is stationary).
In fact, testing a hypothesis is not so simple, because if the true value, t-statistics are not distributed according to Student's law and its distribution does not tend to the standard normal with an increase in the number of observations. In this case, we cannot just take the table of critical values of Student and test the hypothesis against it.
Here, t-statistics is understood as the ratio of the deviation of the parameter estimation of the autoregressive model from its true value to the standard error of coefficient estimation:

where is the parameter estimation of the autoregressive model (1),
  is the standard error of the estimate . The coefficient estimate in an alternative model can be performed using the conventional least squares (LSM) method.
Wayne Fuller began talking in 1976 for the first time that t-statistics are not all right. Then, in 1979, they, together with David Dickey, wrote an interesting article entitled “Distribution of the Estimators for Autoregressive Time Series with a Unit Root”.
It is almost impossible to parse it with a sober head, but it was there that they presented the distribution of t-statistics under the condition, that is, when  (which was called the Dickey-Fuller statistics), for equation (1) and its two modifications:




For equation (1), the Dickey-Fuller distribution has the form:
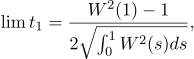
where is the t-statistic for the process (1),
  is the standard Wiener process.
The critical values of Dickey-Fuller statistics are given in Fuller’s book, Introduction to Statistical Time Series. Thus, to test the autoregressive process for stationarity, it is necessary to use the standard hypothesis testing procedure with the difference that instead of the critical value table for the Student distribution, it is necessary to use the critical value table for the Dickey-Fuller distribution.
It is also important to note that equations (1), (2) and (3) can be rewritten in the form:












where , a
, a  . Processes (4), (5) and (6) can be evaluated and tested in the
  same way as testing the hypothesis for . Consequently, the Dickey-Fuller statistics make it possible to verify the stationarity of not only the process itself, but also its first-order differences.
The Dickey-Fuller test is available in all standard packages, so we can check the stock prices obtained at the data collection stage for stationarity, for example, in MATLAB. Below is the code that establishes a connection to the Microsoft SQL Server database (where stock prices and tickers are stored) and two arrays are created. The first is for prices directly, the second is only for those tickers for which there is price data:
The Dickey-Fuller test is performed using the adftest function, which takes a one-dimensional time series at the input and returns a logical value of 1 if the null hypothesis is rejected in favor of the alternative, and 0 otherwise. Let's run the Dickey-Fuller test at a 5% significance level for a model of the form (1):
The program rejects the null hypothesis 5 times in favor of an alternative model. We depict these time series:
Let's look at the price chart of one of the shares.
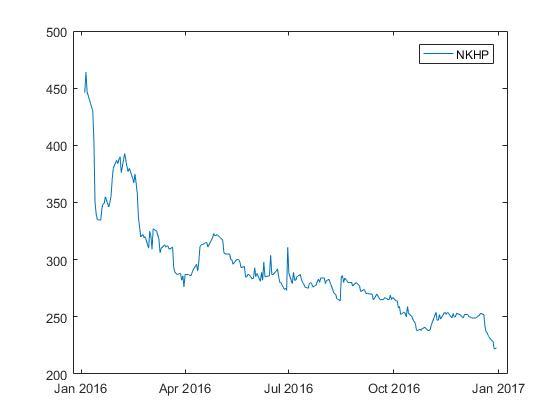
It can be seen here that the time series of the stock price is not stationary.
We construct the first-order differences for a given time series.
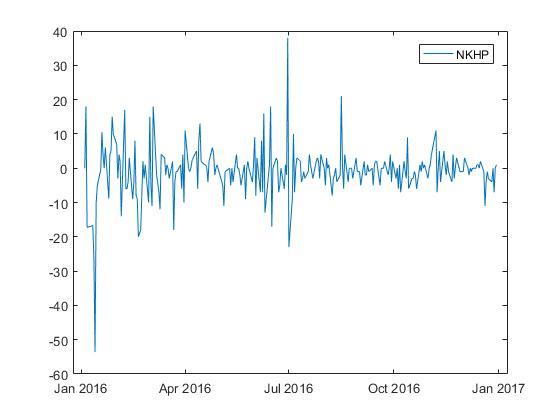
It seems that the first-order differences for the time series of the stock price really satisfy the stationary condition.
The same studies were conducted for the US stock market, namely for the New York Stock Exchange. The list of tickers was taken from the NASDAQ website . There are currently 2,714 adequate tickers. Price data was taken from Yahoo Finance. There were 2647 tickers for which there is data on stock prices for 2016, and as a result of testing for stationarity, 26 stocks with stationary increments were obtained.
There are a large number of assets on the stock markets for which price change is a non-stationary process with stationary increments. The presence of such processes provides the basis for further research and stable profit-making, but we will talk about this next time.
Magnus, Y.R. Econometrics. Beginner course / Ya.R. Magnus, P.K. Katyshev, A.A. Peresetsky. - M .: Business, 2004 .-- 576 p.
This is a very good textbook on econometrics, no worse than bourgeois, and written normally, so you can figure it out.
UPD Stationary increment stock analytics for 2017 on the Moscow Exchange .
There is a small class of stocks, which is a non-stationary process with stationary increments and the distribution of t-statistics which behaves in a rather curious way, namely it does not tend to a standard normal distribution with an increase in the number of observations. How to identify such shares?
Data collection
The first thing we need is a list of tickers that you can actually trade through one of the brokers. A ticker is a short name in the stock information of quoted instruments (in this case, stocks). I will start with the Russian stock market. We have the most popular exchange - Moscow, so let's talk about it.
At some point in my life, I went offline and entered into a brokerage service agreement with Sberbank. In this situation, the list of tickers can be obtained quite simply. It is enough to download the QUIK system, order a stock quotes flow for stocks:
Then display them on the Trade tab and save the table to a file. A total of 296 tickers. If you don’t really want to arrange a quest for yourself, then a list of tickers can be found in the Data Examples section on the Moscow Exchange website. The only one, perhaps this list is out of date.
The second thing we need is stock price data. How many of them are needed to draw up an adequate picture of the market and for what period of time to take them is a matter of debate. The technical limitation that we will encounter further is a minimum of 10 values for each stock.
I wanted to take data on stock closing prices for 2016 (252 trading days) from the previously received tickers, but you can take data for a shorter period, you can even do research inside the day. By and large, it’s not so important for us now which data we will take. The only thing is, if we go to the Moscow Exchange and ask her for archival data for 2016, she will tell us that 32,400 rubles must be paid for the whole thing (earlier, by the way, the data cost even more). I wrote a parser out of harm.
In fact, it’s much faster to get data from the finals or from Yahoo Finance, but for some reason it's not so much fun. At one time, I even contacted the head of the information audit group and asked if I could parse their site for research. I was allowed.
[There were a lot of letters and code about the parser, but I deleted everything because it is probably not very interesting. If I am mistaken, write, I will publish the parser as a separate article.]
I managed to collect data for 289 stocks (there were no data on the rest). For convenience, tickers and prices were saved in the Microsoft SQL Server database. Now move on to math.
About stationarity
If we talk about stationarity without any formulas and complex concepts, the point is that the stationary series does not change its characteristics over time, such as expectation, variance and covariance.
The stock price can be considered as an autoregressive process of the order of 1:
where
- parameter model - white noise . Such a process is stationary provided . Suppose we have stock prices for 252 trading days. How can we determine from the available observations whether such an autoregressive process is stationary or not? It is necessary to conduct a standard procedure for testing a hypothesis
: (i.e., the process is not stationary) against an alternative hypothesis : (i.e., the process is stationary).About Dickey-Fuller distribution
In fact, testing a hypothesis is not so simple, because if the true value
, t-statistics are not distributed according to Student's law and its distribution does not tend to the standard normal with an increase in the number of observations. In this case, we cannot just take the table of critical values of Student and test the hypothesis against it. Here, t-statistics is understood as the ratio of the deviation of the parameter estimation of the autoregressive model from its true value to the standard error of coefficient estimation:
where
is the parameter estimation of the autoregressive model (1), is the standard error of the estimate . The coefficient estimate in an alternative model can be performed using the conventional least squares (LSM) method. Wayne Fuller began talking in 1976 for the first time that t-statistics are not all right. Then, in 1979, they, together with David Dickey, wrote an interesting article entitled “Distribution of the Estimators for Autoregressive Time Series with a Unit Root”.
It is almost impossible to parse it with a sober head, but it was there that they presented the distribution of t-statistics under the condition
, that is, when (which was called the Dickey-Fuller statistics), for equation (1) and its two modifications:For equation (1), the Dickey-Fuller distribution has the form:
where
is the t-statistic for the process (1), is the standard Wiener process. The critical values of Dickey-Fuller statistics are given in Fuller’s book, Introduction to Statistical Time Series. Thus, to test the autoregressive process for stationarity, it is necessary to use the standard hypothesis testing procedure with the difference that instead of the critical value table for the Student distribution, it is necessary to use the critical value table for the Dickey-Fuller distribution.
It is also important to note that equations (1), (2) and (3) can be rewritten in the form:
where
, a . Processes (4), (5) and (6) can be evaluated and tested in the same way as testing the hypothesis for . Consequently, the Dickey-Fuller statistics make it possible to verify the stationarity of not only the process itself, but also its first-order differences.About the Dickey-Fuller test
The Dickey-Fuller test is available in all standard packages, so we can check the stock prices obtained at the data collection stage for stationarity, for example, in MATLAB. Below is the code that establishes a connection to the Microsoft SQL Server database (where stock prices and tickers are stored) and two arrays are created. The first is for prices directly, the second is only for those tickers for which there is price data:
conn = database.ODBCConnection('uXXXXXX.mssql.masterhost.ru', 'uXXXXXX', 'XXXXXXXXXX');
curs = exec(conn, 'SELECT ALL PriceId, StockId, Date, Price FROM StockPrices');
curs = fetch(curs);
data = curs.Data
idsArr = unique(cell2mat(data(:,2)));
sqlquery = 'SELECT ALL StockId, ShortName, Code FROM Stocks WHERE StockId IN (';
for i=1:length(idsArr)
    if i==length(idsArr)
        sqlquery = strcat(sqlquery,int2str(idsArr(i)),')');
    else
        sqlquery = strcat(sqlquery,int2str(idsArr(i)),',');
    end
end
curs = exec(conn, sqlquery);
curs = fetch(curs);
names = curs.Data
close(conn);
The Dickey-Fuller test is performed using the adftest function, which takes a one-dimensional time series at the input and returns a logical value of 1 if the null hypothesis is rejected in favor of the alternative, and 0 otherwise. Let's run the Dickey-Fuller test at a 5% significance level for a model of the form (1):
for i = 1:length(names)
    % Indexes with current stock's data
    indexes = find(cell2mat(data(:,2)) == cell2mat(names(i,1)));
    isStat(i) = adftest(cell2mat(data(indexes,4)));
end
% Indexes with stationary stocks
stat = find(isStat == 1);
The program rejects the null hypothesis 5 times in favor of an alternative model. We depict these time series:
for i=1:length(stat)
    indexes = find(cell2mat(data(:,2)) == cell2mat(names(stat(i),1)));
    figure
    plot(datetime(data(indexes,3)), cell2mat(data(indexes,4)))
    legend(names(stat(i),3));
end
Let's look at the price chart of one of the shares.
It can be seen here that the time series of the stock price is not stationary.
We construct the first-order differences for a given time series.
It seems that the first-order differences for the time series of the stock price really satisfy the stationary condition.
NYSE Results
The same studies were conducted for the US stock market, namely for the New York Stock Exchange. The list of tickers was taken from the NASDAQ website . There are currently 2,714 adequate tickers. Price data was taken from Yahoo Finance. There were 2647 tickers for which there is data on stock prices for 2016, and as a result of testing for stationarity, 26 stocks with stationary increments were obtained.
conclusions
There are a large number of assets on the stock markets for which price change is a non-stationary process with stationary increments. The presence of such processes provides the basis for further research and stable profit-making, but we will talk about this next time.
What to read on the topic?
Magnus, Y.R. Econometrics. Beginner course / Ya.R. Magnus, P.K. Katyshev, A.A. Peresetsky. - M .: Business, 2004 .-- 576 p.
This is a very good textbook on econometrics, no worse than bourgeois, and written normally, so you can figure it out.
UPD Stationary increment stock analytics for 2017 on the Moscow Exchange .