“Monitoring .NET Application Performance: Approaches and Tools,” an interview with Dina Goldstein
 Not always developed solution works with acceptable performance. Especially for the customer. And if the offer to buy memory and raise system requirements does not work (I have never succeeded), I have to take on the optimization. And for this, we have not only StopWatch: we talked with Dina , a great girl, an excellent specialist and speaker at the DotNext 2016 Moscow conference, about the tools that allow you to understand where to look, where to climb in the first place, what results to expect while working on the application’s performance. Goldstein .
Dina is a senior software engineer at Aternity. Aternity is developing monitoring tools for millions of PCs and mobile devices. Dina works on the team responsible for the main mechanism for collecting data from various sources.
About monitoring solutions
- What are the ready-made solutions for monitoring? How popular and popular are they? What tasks do you solve?
- Monitoring tools can be divided into two main groups - embedded units and separate independent programs.
For the first category, there are such infrastructures as ETW (Event Tracing for Windows) and performance counters. They are already preinstalled on Windows. You can use ready-made solutions for data collection or embed components in your tool through the .NET (or C ++) API. These solutions will certainly help you realize exactly what you want. But the main word here is to realize. Basically, you have to do all the work yourself. Oh yes, you can always hook Windows API calls to get even more data, but this requires a special approach and increased attention.
Among the finished tools, there are many products. And the libraries that are embedded in your code, for example, New Relic, and completely ready-made monitoring systems that do not require the intervention of programmers. For example, Aternity, where I just work.
- Sooner or later, a situation arises when there are not enough ready-made tools. And you have to write code in your product. Do the .NET Framework and language tools offer anything to simplify development?
- Yes, definitely. Performance counters, of course, have a convenient .NET API, and you can use ETW using the freely available NuGet package called TraceEvent , which is being developed by Microsoft. Recently, by the way, the company opened the source code. The repository is now available on GitHub.
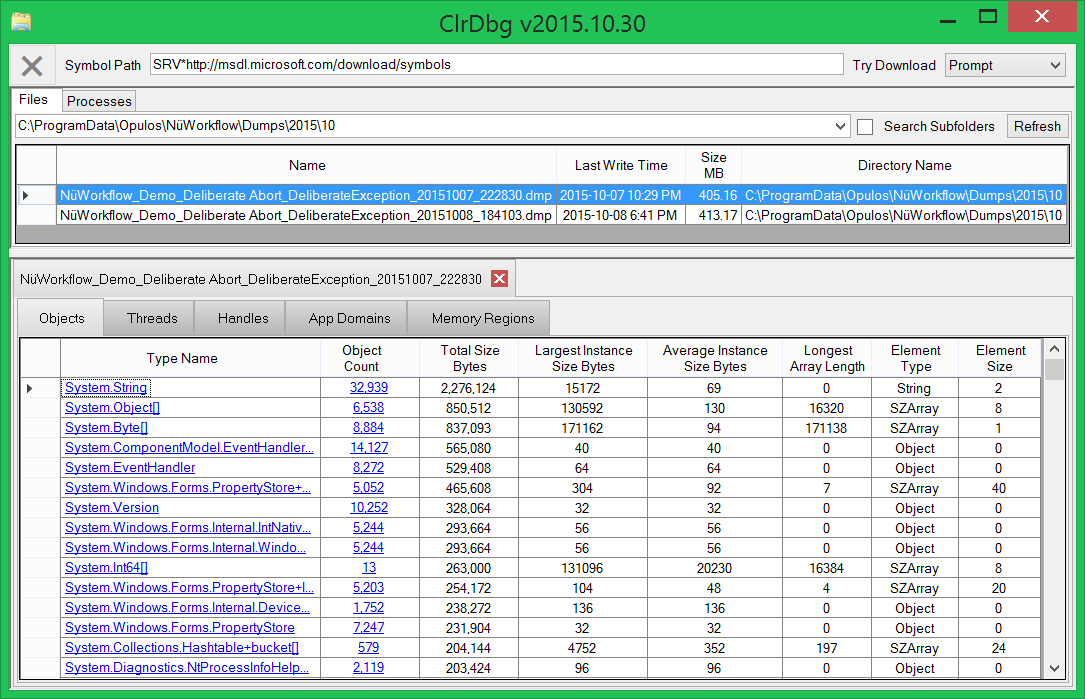
These were a few words about the general approach. Separate .NET frameworks (such as WCF, WPF, and Entity Framework) have extension points where you can embed your code and collect the necessary data. Another interesting option is to use ClrMD. This is a set of debugging APIs in .NET (also open source, supported by Microsoft, available on GitHub and through NuGet ).
With ClrMD, you can get a call stack, examine a managed heap, and the like. I don’t think it will be possible to do large-scale monitoring using only this tool, if only because the overhead is too high, but if you find a problem using any other tool, then with ClrMD you can get specific information. For example, if you find that the heap in the application is too large, then you can determine which objects consume the most memory.
If you want to dive deeper into the Win32 API, then I'm afraid. NET will not be able to particularly help, and you will have to resort to C ++. For example, use Microsoft Detours .
You must not lose control
- Our software product went into operation. Have we lost control or are there still ways to collect information? What is the best way to do this?
- Not! You do not lose control. If we are talking about a server or cloud product, then, of course, you can use any monitoring solution that suits your needs, since the environment is under complete control.
If you are developing a desktop application, you cannot require users to install a monitoring framework. And this means that you have to embed the ability to independently monitor the application. Of course, here you can use ready-made libraries, for example, New Relic, or implement them yourself using the .NET API, which I have already mentioned.
In truth, recently I’ve been trying to convince the manager to add monitoring of the processor load to our application, which will work using performance counters, and upon reaching a certain threshold value, start collecting statistics on the call stack using ETW.
- What measurement error is considered acceptable, and how do we achieve it?
- I believe that accuracy is not the main task. You clearly want to generally understand how the product works. Monitoring a released product is not the same as debugging and profiling during development. There are always ways to get more data during operation, for example, using ClrMD, but you have to pay for high accuracy. You can, of course, do this from time to time, but so far I do not see the point in its constant use. You can connect with the profiler or debugger for a short time when faced with performance issues. In the ideal case, monitoring should give a general idea, and when a problem is discovered, you return to the office, reproduce it locally and examine using specialized tools.
- Let's say you need to measure the performance of a method. But there is no certainty that third-party actions will not affect this, a garbage collector, for example. What are the pitfalls in measurements and how to avoid them?
- It depends on what you mean by the performance of the method. If we are talking about “algorithmic” performance, then there is probably no need to measure during operation in a real environment, but you can write a test locally, stop garbage collection, turn off the swap file, connect the laptop to power, and generally do whatever you think necessary.
But in real life, we have no way to control when these interruptions happen. What really CAN be done is to get information when interruptions took place and how long they lasted. ETW provides information about the garbage collector, network, disk accesses and so on. Then you can analyze all this data together and come to a conclusion about performance. Specifically, with the garbage collector, if there are critical places, then you can use GC.TryStartNoGCRegion.
- Let's touch on a slightly clean theory. On large systems with large amounts of data, there is a desire to use the achievements of mathematics. Are there many theories? How popular are statistical methods? Are they used in any tools?
“The tools I know only collect data.” And then everyone decides how to process this data. One of the things to keep in mind is that sometimes sampling is used instead of intercepting the Windows API, which are significantly more expensive in terms of performance. By its nature, discrediting can lead to an underestimation of the number of rare events. This is especially evident when measuring the use of the processor, and you need to make sure that measurements are taken long enough to statistically obtain information even about small actions. But on the other hand, these little things are clearly not what causes performance problems, and probably are not important at all if you want to get an idea of what takes more time and what less.
About monitoring at the system design stage
- Do you need to lay extension points for future monitoring when designing a system? Are there existing approaches and recommendations?
- Yes, definitely! I did not mention this before, but we can create our own performance counters and ETW logs. Therefore, during the development of the system, you should think about which places can be interesting and what data should be collected. Ideally, the system should be designed so that DevOps can monitor everything they need without the intervention of programmers.
- Is it worth waiting for help from development tools, for example, Visual Studio?
- Here again depends on the environment. Of course, Visual Studio has great tools for profiling during development. But do not wait for help during the operation of the application. Firstly, because profiling has a lot of overhead. Secondly, you cannot install Visual Studio on users computers, if only because of license restrictions. If you have a remote connection to the server and you are allowed to stop the application for a while, then you can use Visual Studio Remote Debugger. But this is still debugging, not monitoring.
- Many are faced with the need to process a huge amount of raw data obtained during monitoring. Is it possible to automate?
- Oh sure. If you use ETW, then you can also use TraceEvent and write some .NET code that will analyze events online or offline. If you use a different data source and the result has a standard format, then you can use any preferred programming language for analysis. And, of course, in our time there is an incredible number of ready-made programs and analysis platforms that allow you to process data in a beautiful form and dynamically display on the dashboard.
- What problems do monitoring tools face now? And in what direction is development going?
- I think that the most pressing problems are overhead and data overdose. We cannot allow large performance sinks due to monitoring. In addition, the user should be able to change what to monitor and the configuration dynamically, without recompiling or restarting the application. This is especially true for stock exchanges and the military.
Another thing that is especially lacking under Windows is the ability to conveniently dynamically intercept any Windows API calls, something like eBFP for Linux. Currently, we are faced with an abundance of data, so control panels are becoming increasingly popular, which allow you to group and dynamically display information in accordance with constantly changing requirements.
Dina speaks in the first section at the DotNext 2016 Moscow conference , which will be held on December 9 at the Radisson Slavyanskaya Hotel. You can still register here .
In addition to Dina's report, it will also be possible to listen to:
⬝ .NET Core: State of the art
⬝ Squeezing the Hardware to Make Performance Juice
⬝ Intelligent Chatbots and Cognitive Services
⬝ Stack Overflow - It's all about performance!
⬝ Advanced Xamarin.Forms
⬝ C ++ through C #
⬝ Continuing to talk about arithmetic
⬝ ASP.NET SignalR: Why It's Getting Really Crucial for Web Development
⬝ Exceptional Exceptions in .NET
⬝ Modifying .NET code in
runtime ⬝ End-to-end JIT
⬝ Performance tuning Stack Overflow tags
⬝C # Scripting - why and how you can use your C # in places you never thought of before!
⬝ Multithreading Deep Dive
⬝ Collect Everything, or Meet Cake (C # Make)
⬝ WinDbg Superpowers for .NET Developers
⬝ Overview of the new .NET Core and .NET Platform Standard
⬝ What vulnerabilities are found in the .NET platform and how to avoid repeating them in their applications
⬝ for What's new in the C # 7?