DellEMC Unity 400F: a little testing
In early May 2016, before the merger with Dell ended, EMC announced the release of a new generation of mid-range arrays under the name Unity. In September 2016, the Unty 400F demo array was brought to us in a configuration with 10 SSD disks with 1.6TB each. What is the difference between models with and without the F index, you can read on this link in the blog of Denis Serov. Since before the demo was transferred to the customer, a time lag arose, it was decided to drive the array with the same test that the VNXe3200 and VNX5400 had previously loaded. To look at least at the “synthetics”, is Unity really good compared to previous generations of EMC arrays, as the vendor writes. Moreover, judging by the vendor's presentations, the Unity 400 is a direct replacement for the VNX5400.
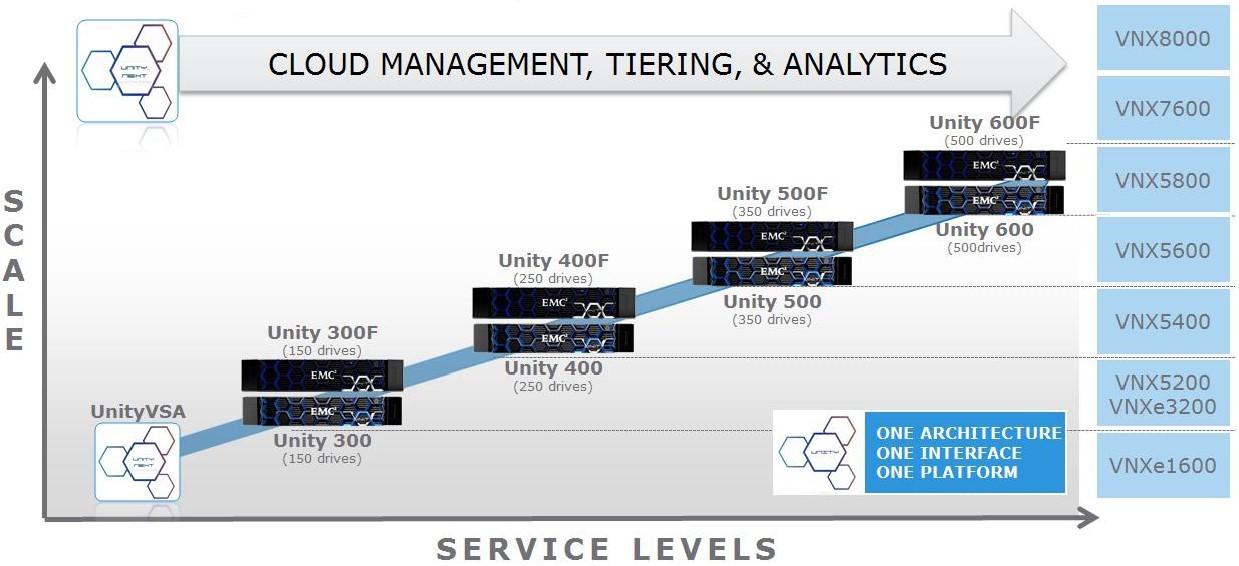
And DellEMC claims that the new generation is at least 3 times more productive than VNX2.
If you wonder what came of all this, then ...
When calculating performance, DellEMC recommends using a maximum value of 20,000 IOPS for SSD drives (see document here ).

That is, as much as possible in theory, our 9 disks can give out 20,000 * 9 = 180,000 IOPS. We need to calculate how many IOPS will receive from these server disks, taking into account our load profile. Where the read / write ratio as a percentage is 67% / 33%. And you also need to consider the overhead of writing to RAID5. We get the following equation with one unknown: 180,000 = X * 0.33 * 4 + X * 0.67. Where X is our IOPS that will receive the server from our disks, and 4 is the write penalty size for RAID5. As a result, we get on average X = 180,000 / 1.99 = ~90452 IOPS.
As a result of the test, we obtained the following IOPS dependence on the number of I / O flows:
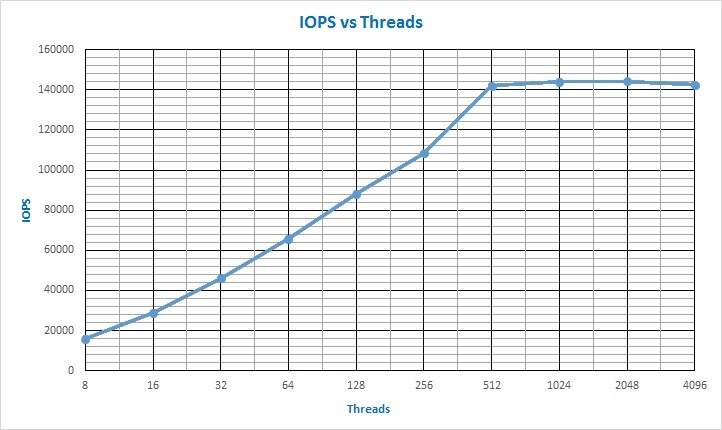
According to the graph, it is clearly seen that saturation occurred at 512 I / O flows on the tested LUNs and at the same time a value of approximately 142,000 IOPS was reached . If you look at testing the VNX5400, you can see that even when testing the controller cache, the maximum values for IOPS did not exceed the threshold of 32000 IOPS. And VNX5400 I / O saturation occurred on approximately 48 threads. It should also be noted that one HP DL360 G5 server, in the configuration described above, issued a maximum of about 72,000 IOPS. Then rested on 100% CPU load. Why actually had to look for a second "computer".
Unity has a good feature for collecting performance statistics on various components of the array. So for example, you can see load schedules for IOPS by array disks (each individually or all at once).
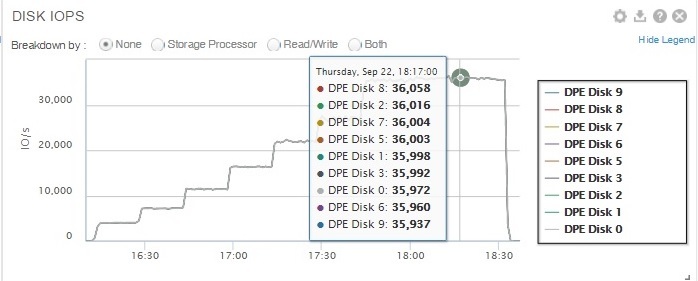

It can be seen from the graph that at maximum the disks give out “somewhat” more than the value that the vendor recommends when calculating performance.
The response time on the tested Unity configuration grew as follows:
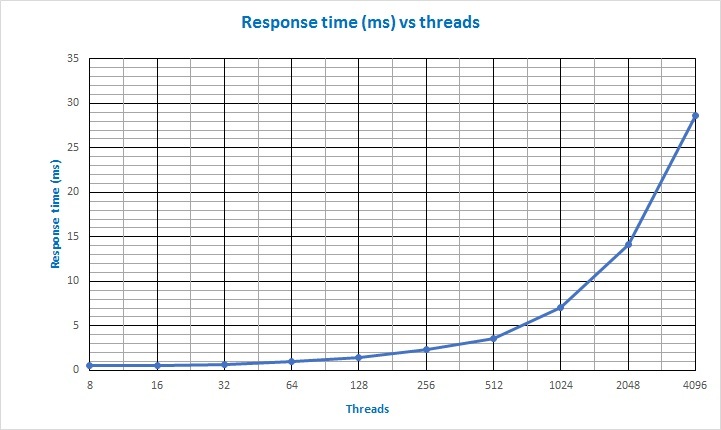
i.e. even at the “saturation point”, when with an increase in the number of streams the IOPS stop growing (512 streams), the response time did not exceed 5ms.
Response time versus the number of IOPS.
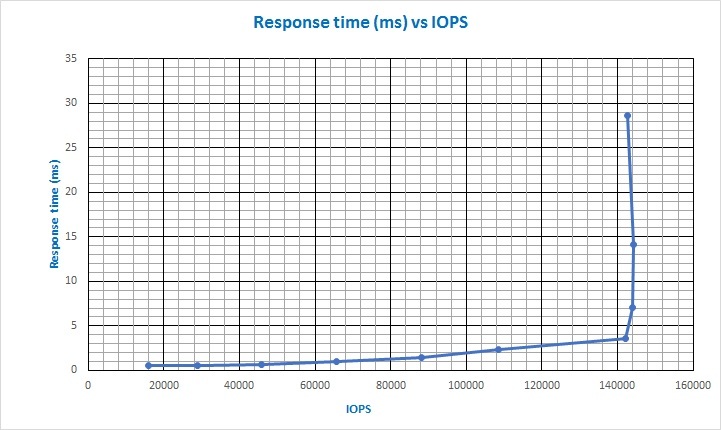
Again, when compared to the response time when testing the controller cache on the VNX5400, you can see that on the VNX5400, a response time of 1ms was reached already at about 31,000 IOPS and about 30 I / O streams (and this is actually on RAM). On Unity, on SSDs, this only happens with ~ 64000 IOPS. And if we add more SSD drives to our Unity, then this intersection point with a value of 1ms on the graph will move much further on the IOPS scale.
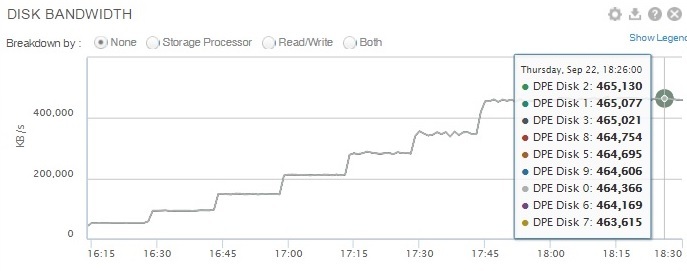
Dependence of bandwidth on the number of input / output streams:
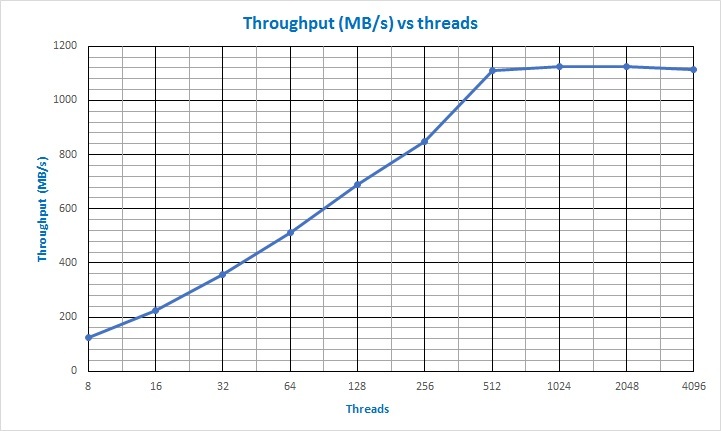
It turns out that the array received and gave out packet streams of 8KB in size at a speed of more than 1GB / s (gigabytes per second).
Yes, not to bore the reader, a series of performance graphs of various components of the Unity 400F array is hidden for the curious ...
Link to the IOMETR-a source file.
Conclusions, I think, everyone will make for himself.
As for me, an interesting new storage system has appeared on the market, which even with a small number of SSD drives shows high performance. And given the available SSD sizes (and DellEMC for Unity already has 7.68 TB SSDs available and 15.36TB SSD support should be available soon), I think that in the next few years hybrid arrays with a mixture of SSDs and spindle drives will become a story.
PSFor fans to ask questions "how much does it cost?". In his presentations, the vendor indicates that the price tag for Unity F (All Flash) starts at $ 18k, and for Hybrid configurations, at less than $ 10k. But since the presentations are all “bourgeois”, the price tag in our Russian realities may differ. In any case, it is better to check with the local vendor or its partners in each specific situation.

And DellEMC claims that the new generation is at least 3 times more productive than VNX2.
If you wonder what came of all this, then ...
Description of the stand and test
Under the spoiler
Initially, for testing, a stand was assembled all from the same old HP DL360 G5 with 1 CPU (4-core) and 4GB RAM. Only in the PCI-E slots were two single-port 8Gb / s HBA Emulex LPE1250-Es connected directly to the Unity 400F FC 16Gb / s ports. As it turned out a little later, the CPU performance of this server was not enough to load the storage. Therefore, as an additional source of IOPS generation, the Blade HP BL460c G7 with 1 CPU (12-core) and 24GB RAM were connected to the array. True, in the Blade basket there are FC switches with 4G ports. But, as they say, "they don’t look in the teeth for a gift horse." There were no other calculators at hand anyway. The servers used OS Win2012R2 SP1 and PowerPath software from EMC to manage LUN access paths.
On the Unity 400F array, a pool was created in the RAID5 (8 + 1) configuration. The pool hosted two test LUNs that were connected to the servers. NTFS file systems and 400GB test files were created on LUNs to eliminate the effect of the controller cache on the result.
The settings in IOMETER in this case are as follows:
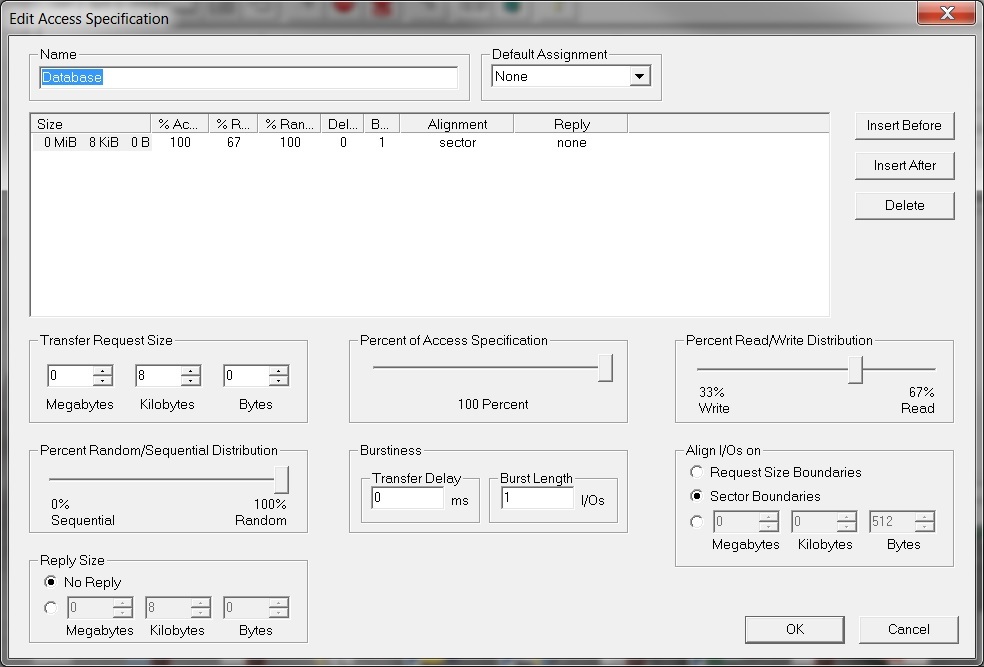
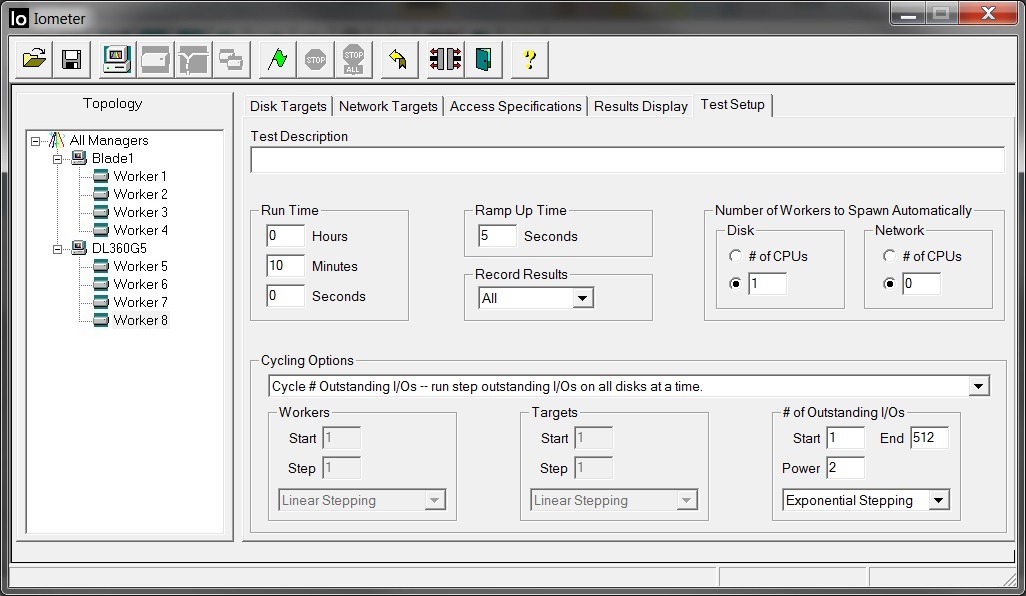
I.e. 4 workers worked on each server (a total of 8), on which, at each subsequent stage of testing, the number of input / output streams doubled. Thus, for each worker sequentially 1, 2, 4, 16, 32, 64, 128, 256, 512 threads. And all in all, the array had 4, 8, 16, 32, 64, 128, 256, 512, 1024, 2048, 4096 streams at each stage.
On the Unity 400F array, a pool was created in the RAID5 (8 + 1) configuration. The pool hosted two test LUNs that were connected to the servers. NTFS file systems and 400GB test files were created on LUNs to eliminate the effect of the controller cache on the result.
The settings in IOMETER in this case are as follows:


I.e. 4 workers worked on each server (a total of 8), on which, at each subsequent stage of testing, the number of input / output streams doubled. Thus, for each worker sequentially 1, 2, 4, 16, 32, 64, 128, 256, 512 threads. And all in all, the array had 4, 8, 16, 32, 64, 128, 256, 512, 1024, 2048, 4096 streams at each stage.
By tradition, a few calculations
When calculating performance, DellEMC recommends using a maximum value of 20,000 IOPS for SSD drives (see document here ).

That is, as much as possible in theory, our 9 disks can give out 20,000 * 9 = 180,000 IOPS. We need to calculate how many IOPS will receive from these server disks, taking into account our load profile. Where the read / write ratio as a percentage is 67% / 33%. And you also need to consider the overhead of writing to RAID5. We get the following equation with one unknown: 180,000 = X * 0.33 * 4 + X * 0.67. Where X is our IOPS that will receive the server from our disks, and 4 is the write penalty size for RAID5. As a result, we get on average X = 180,000 / 1.99 = ~90452 IOPS.
Test and Results
As a result of the test, we obtained the following IOPS dependence on the number of I / O flows:

According to the graph, it is clearly seen that saturation occurred at 512 I / O flows on the tested LUNs and at the same time a value of approximately 142,000 IOPS was reached . If you look at testing the VNX5400, you can see that even when testing the controller cache, the maximum values for IOPS did not exceed the threshold of 32000 IOPS. And VNX5400 I / O saturation occurred on approximately 48 threads. It should also be noted that one HP DL360 G5 server, in the configuration described above, issued a maximum of about 72,000 IOPS. Then rested on 100% CPU load. Why actually had to look for a second "computer".
Unity has a good feature for collecting performance statistics on various components of the array. So for example, you can see load schedules for IOPS by array disks (each individually or all at once).


It can be seen from the graph that at maximum the disks give out “somewhat” more than the value that the vendor recommends when calculating performance.
The response time on the tested Unity configuration grew as follows:

i.e. even at the “saturation point”, when with an increase in the number of streams the IOPS stop growing (512 streams), the response time did not exceed 5ms.
Response time versus the number of IOPS.

Again, when compared to the response time when testing the controller cache on the VNX5400, you can see that on the VNX5400, a response time of 1ms was reached already at about 31,000 IOPS and about 30 I / O streams (and this is actually on RAM). On Unity, on SSDs, this only happens with ~ 64000 IOPS. And if we add more SSD drives to our Unity, then this intersection point with a value of 1ms on the graph will move much further on the IOPS scale.
Dependence of bandwidth on the number of input / output streams:

It turns out that the array received and gave out packet streams of 8KB in size at a speed of more than 1GB / s (gigabytes per second).
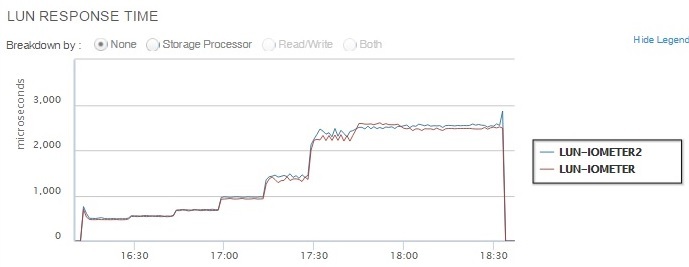
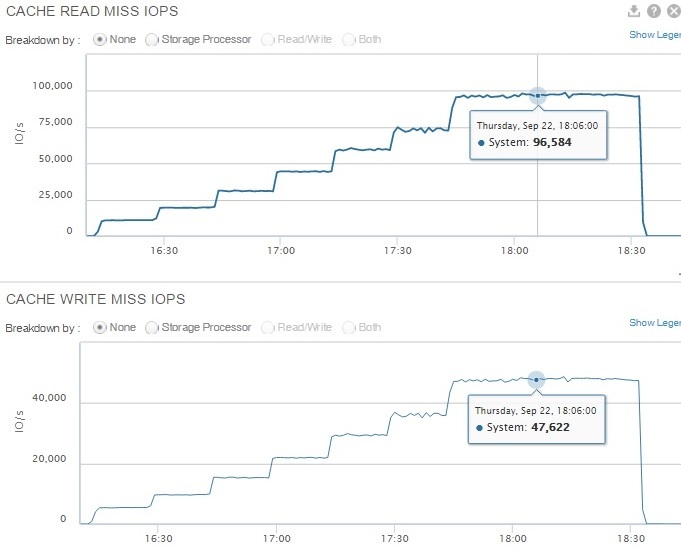
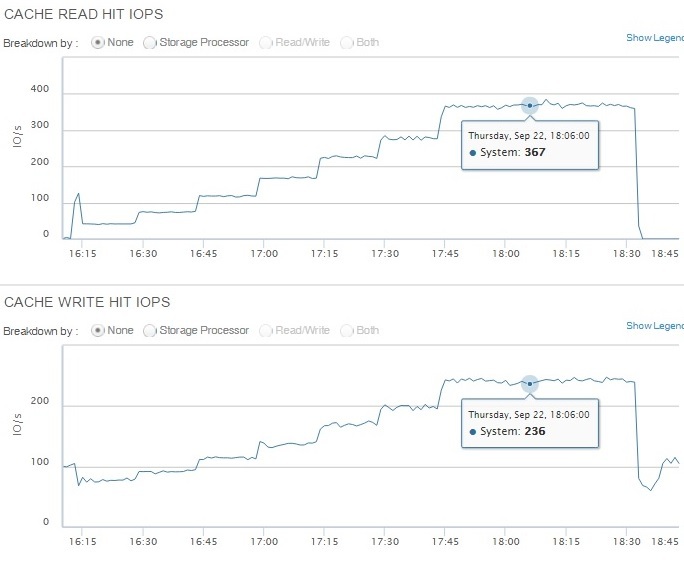
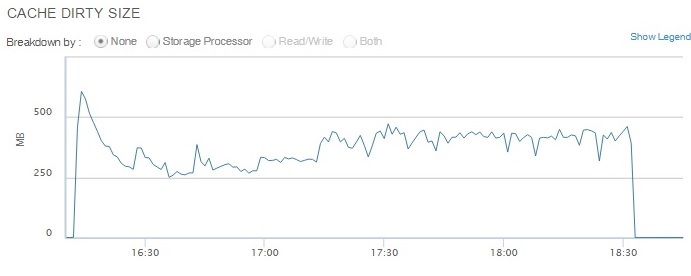
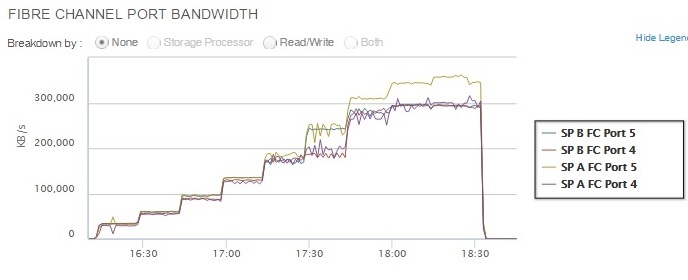
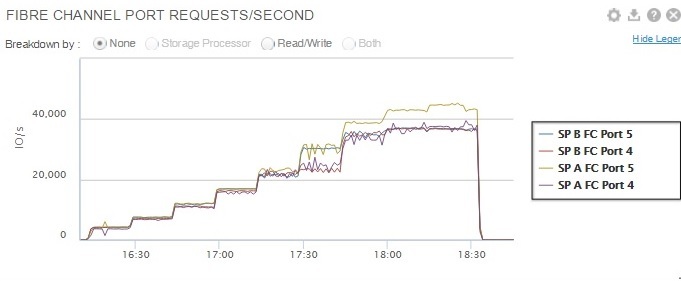
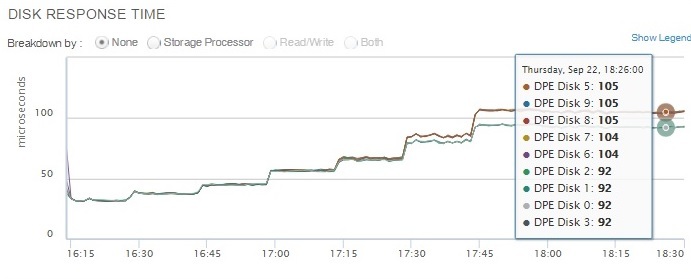
Yes, not to bore the reader, a series of performance graphs of various components of the Unity 400F array is hidden for the curious ...
Under the second spoiler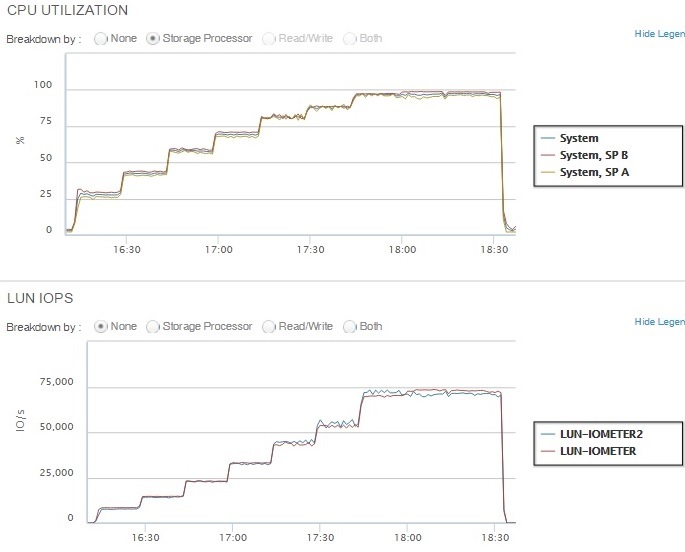


Link to the IOMETR-a source file.
conclusions
Conclusions, I think, everyone will make for himself.
As for me, an interesting new storage system has appeared on the market, which even with a small number of SSD drives shows high performance. And given the available SSD sizes (and DellEMC for Unity already has 7.68 TB SSDs available and 15.36TB SSD support should be available soon), I think that in the next few years hybrid arrays with a mixture of SSDs and spindle drives will become a story.
PSFor fans to ask questions "how much does it cost?". In his presentations, the vendor indicates that the price tag for Unity F (All Flash) starts at $ 18k, and for Hybrid configurations, at less than $ 10k. But since the presentations are all “bourgeois”, the price tag in our Russian realities may differ. In any case, it is better to check with the local vendor or its partners in each specific situation.
