September 30, 2016 at 19:46
Website optimization. Diagnoses and treatments
Ivan Mikheev (AGIMA)

Today we’ll talk about optimization, as the name of the report makes clear. In general, did someone have to optimize sites? It was necessary. On this way, we are faced with many interesting things, from how an incomprehensible code comes to us - from a previous contractor, for example, or your own code, which we then have to rethink - and there are problems that, under certain loads, begin to bother us wildly.

If you came for some kind of wild hardcore, you, unfortunately, will not see it in this report, and maybe, fortunately. What I will tell you today is, in general, no Rocket Science, nothing is complicated, these are the tools that you can get even on shared hosting, if you use, say, shared hosting on highload. I’ll tell you about the tools, about some examples of optimization we had in our company, and a little touch on scaling, because this is also from optimization, but a little in a different context.

The first sad conclusion that I made for myself on the path of my development history is that a silver bullet, in general, does not exist anywhere. Those. there is no universal solution, universal approach or tool that would save everyone from the headache that we encounter on the way to optimization. Therefore, here is such a conclusion - there is no silver bullet.

Also, from experience, I realized over time that if you had a day of updates yesterday, and yesterday your site crashed, then there is also no special science here - it is in the update. What are we doing? We roll back and begin to figure out what happened, what was wrong with the release. It is important to understand this right away, that something happened wrong with you.

Let's talk about a situation more or less close to reality. For example, your site load is growing. Perhaps it grows evenly, but most likely it grows unevenly with some peaks. And at these peaks, your site is getting wildly bad. It starts to render pages endlessly, you have a white screen, instead of content, various random errors of the 500s and not 500s, you often notice a connection disconnected from the server, or, in general, your pages load half, half of the pictures are not loaded, and , in general, there is some kind of meat going on. All these symptoms suggest that you should think about optimizing your portal or website and already begin to take some steps towards improvement.

To structure the report, we will consider typical components of the application - what does it consist of? Usually in any language there is some kind of front-end where the user interface is located directly, i.e. if the site, then this is the browser, if the application, then some kind of interface. There is an application on which your application is spinning, all business logic is spinning. And there is a data layer - it can be a DBMS, it can be, God forbid, XML, it can be any data that should come to you in any way in the application. And having this structure, we return to the problem - our site is dumb, it has been loading for a long time, there are some problems. Where to begin? How to approach this matter, what should we do?
The first thing that begs you is to look at your front-end, because it will help you to drop several options at once in which direction you should move.

The main problems at this stage are precisely the problems associated with why your site slows down. This is your page loading inadequately long, i.e. you understand that the script worked as quickly as possible, but the delivery of content to the client in the browser takes a very long time. Your CSS execution is blocked. This is about the fact that if, for example, you see a user first see a white screen, and then it somehow unexpectedly turns into something beautiful for him, this is not a good situation ... When you see a partial loading of content, i.e. the picture is loaded for you unrealistically long, or your model is being drawn for a very long time - this is also not a very situation. Well, the delay in the execution of JS scripts, when you have some kind of script connected to the 80th in the list of all Java scripts, and you understand that it does not work out as it should, you need to optimize something here too.

For diagnostics, there are fairly simple tools that are available in every browser, probably not in the browser.
The first thing that begs it is Firebug. Everyone knows how to use it - they clicked on F12, and even in the oldest ie it is definitely there. They stuck it in Firebug, looked at what requests you had there, how many pages were returned when the content loaded, and when some kind of script was running. It's generally free, just looked at the statistics, it took you 5 minutes - well, to reach the F12 key + a couple of minutes. Everything, you have all the statistics, you already have some kind of understanding in which direction to move on.
There is a very interesting tool - YSlow. He, in addition to some metrics, can also tell you in words what you need to fix. This tool is a discovery for me.
There is also Google PageSpeed, which will also tell you how to increase the ranking of your site based on the fact that you need to change something at the front. Here, by the way, the front is considered from the point of view of the client as a browser.
Thus, they stuck these tools, saw what had broken, and we were already starting to fix something.

What should I look for when you look at these metrics?
The first and key, most content sites sin with this - this is the speed of rendering the DOM. There are such sites where the DOM contains well, a lot of elements - more than 10 thousand - this already becomes a problem in order to render it, when scrolling sites start to stupid, if you open it on the phone, this becomes an even bigger problem. So, it’s worth seeing how much you generally have difficulty rendering.
The second is the presence of external JS and CSS. This is, in general, a separate topic, because if you have some kind of JS that is not on your server, it is requested, and sometimes you don’t know what size it will end up because there are some external libraries, and with them everything is complicated. And of course, loading of these scripts starts blocking, i.e. it waits for one script to load, only then it starts to load something else. Same thing with CSS i.e. here you need to correctly select such scripts and, probably, it’s not only about the availability of the service that this JS takes from you, but about that too.
For example, we had such a case when we rolled out the site of a fairly well-known fitness club. There was a certain external script that connected and did some operations. Developers developed, everything was cool with them, they did not take into account only that it was cached by them on the browser, and when they rolled it into the product, this script weighed half a meter there. What is 500 Kb as part of the transfer between disks? These are not very big numbers, but when it starts to load it is not very cool when your preloads load seconds. Plus, there was still a lot of graphic content, which was also cached by the developers, but they did not seem to ask for a cache. In general, a lot of research was carried out until, in the end, they realized that it could be a matter of seeing Firebug and that’s all.
Well, the time to establish a connection to the server. Everything is interesting here, because it is important to understand if your front is really dull, or you just have some very weak Internet channel. Such problems also happen, and here you should rather go to deal with your network provider, and not dig your code.
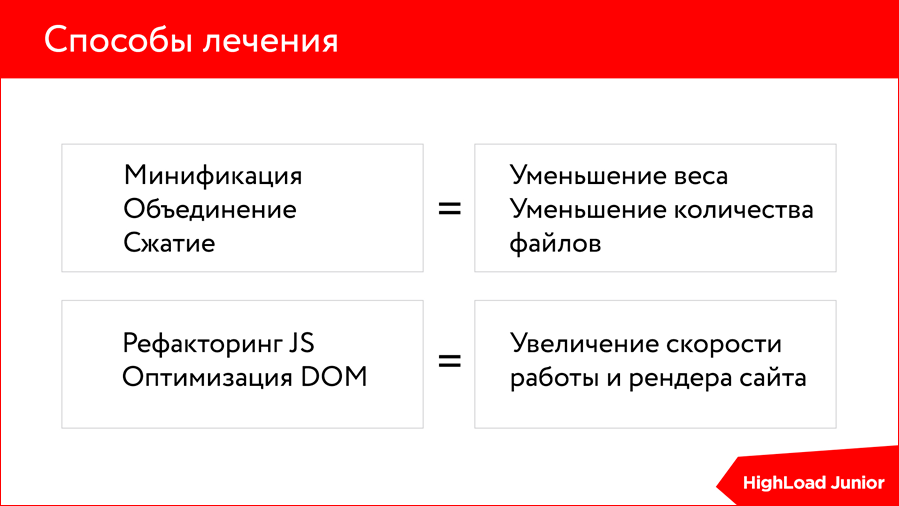
What methods of front optimization can be applied?
Minification, combining, compression - all this affects only two factors - the weight and number of files when downloading. When you load 10 Javascripts, and some of them are from external services, this does not affect the frontend very well, because the browser, in my opinion, can support five simultaneous connections (depending on the version), and everything else is blocked. If you, of course, ship synchronously. Unification at some point helps you to avoid this - you have one of 10 files. And naturally, one in 30 Kb will load faster than 30 in 1 Kb. This must be understood.
But here is the next point in terms of minification (especially CSS). When you have a debugging moment, some of them open the development panel on the prod and start changing the numbers, as this has all changed, and they still indicate the line there. So, in the case of compressed files, they will show you the line “1”, only except if you don’t have sourcing mappers on these minifiers. But even so it’s not so simple with them, because sometimes some sour mappers also only have some key to you, the main element shows where it starts. And where exactly in the code can be very difficult. Here, too, you need to very competently apply the approach, because in debugging this can play a trick on you.
Compression. Everything is probably transparent here, because the media content must be precisely compressed and some Full HD picture must not be loaded into a 100 by 100 pixels container. Now there are still cases when it seems that the picture is small, and they drive Full HD there, and the client says: “Why so long?”. This point also needs to be taken into account.
The second group of optimization tools is refactoring your JS-code, because often it is stupid because it is so written. Especially if you use some frameworks that you don’t fully understand, and your DOM consists of several thousand elements, and you also have some kind of jQuery events, etc. In short, everything will actually not work very fast.
Well, DOM optimization is also an important thing. When, if anyone remembers, iPad 1 or 2 came out, then they had a problem when they loaded all sorts of content sites, for example, news portals such as woman.ru or some such. They have historically developed that the DOM was very complex, i.e. a lot of elements, and just the iPad did not digest it. You opened the site, it seemed to render it, render it, render it, but it didn't come to anything special, and then they had to be optimized very much on this topic. It probably took a very long time.
All of these points will simply lead to faster website performance.

And free advice, which is no longer related to clients, but more to the front of your proxy or nginx server - you need to give the static through nginx. Until now, we have come across such cases when the statics go through nignx and it doesn’t affect the disk very well, therefore, if your site is dumb and you think that everything else is fine, check the statics - you have it through nginx given or not?

Let's move on to the more interesting part, these are Application and DB. That part on which the majority of errors actually occurs and which gives you just a testing ground for optimization.

If your pages are slowly being formed, the script is being badly executed, html is being generated, errors of the 500th are often encountered, any ... Any 500th is already a bell. If you are observing any downtime of a site through your monitoring system, then here, if you do not need to sound the alarm, then it’s definitely worth considering if everything is in order with you. If this is some single case, then you can think, see, disassemble it, if this is a series of such cases, then here you definitely need to approach this task in a comprehensive manner.

What are our options when Application or DB slows down? In fact, there are three such key blocks:
- your server has exhausted its resource,
- programmers made some not very high-quality code,
- or something is going wrong in the database.
How to understand this all, in general?
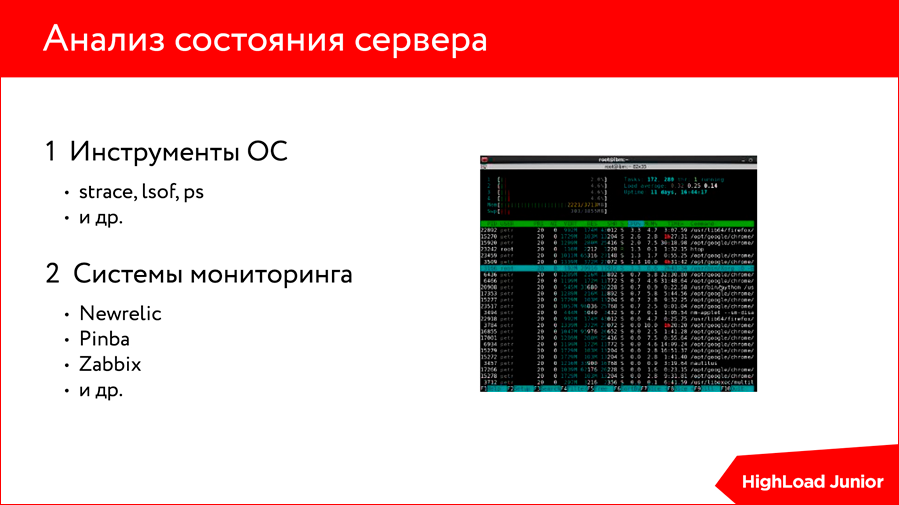
The first thing that comes to mind is not to install any profilers there, not to invent some strange thing, but just go into your terminal and use the usual OS tools.
You have a top command that will help you understand how much memory you have left on the server. There is strace, lsof, etc. All these commands are in the Linux OS, under Windows there are similar commands too, i.e. you don’t do anything like this, you have everything at hand, you just look at the current status of your server. And there is nothing to worry about at all.
We had a case with one retailer. They have such things as directories, maybe, you know, they are pumped into pdf. And it’s interesting that on the day they post them, for some reason, a lot of people start downloading them. I don’t know for what purpose, but there are really 2,000 people there for some reason go to this portal and begin to download directories. And our site arrived a little bit. They started to understand. The system administrator simply stuck the laptop and realized that all files were given through apache via access_logs. But, of course, giving pdf files via apache is not very good. We just switched the config to nginx (again, remember the advice? - the statics through nginx), everything flew. Those. here is a clear example - we spent 5 minutes on it, just stuck the laptop, looked at what was happening with the disks, looked at access_log, that’s it. And everything immediately became clear, corrected.
Even if you have it even cooler - there is a monitoring system, then you don’t even need to go to the OS, you can understand all of them. Those. There are various metrics by which you understand where in what place the server has a small crisis.

The second point is slow logs. Slow logs are almost everywhere, they help you determine the place and time when this or that request occurred, or the script was executed for an unusually long time. The main topic with slow logs, maybe a problem, or not even a problem, but just a reason to argue, talk - this is the time to determine a slow request. Everything here is actually even simpler. You are the owner of your system and you know what time of the script execution request is optimal or acceptable for you. Just configure the slow log so that all critical requests are written to you, and all non-critical requests are not written, i.e. it is important for you to understand what time is critical for you, so as not to count if two requests are executed for more than three seconds, then that’s all. Because there is such a thing as statistics, calculations or reports,

One more tip - it’s better to include slow logs right at the beginning of development. This will save you from unexpected load peaks and subsequent debriefing such as “what happened?”. Because with the same update, when you roll out to the prod, and your load starts to jump very unevenly on the server, then you need to quickly roll back and return the state. And if your slow log was not turned on, it will be very difficult for you to collect any statistics or metrics. If you had it turned on, then you just look at the metrics, then decide everything, maybe do some kind of load testing. That's all.
We also have various logs - this is error_log and access_log, i.e. all server tools that are at our disposal, they can be used without using any additional tools. This is what you have in the OS box, plus monitoring. But monitoring must already be configured.
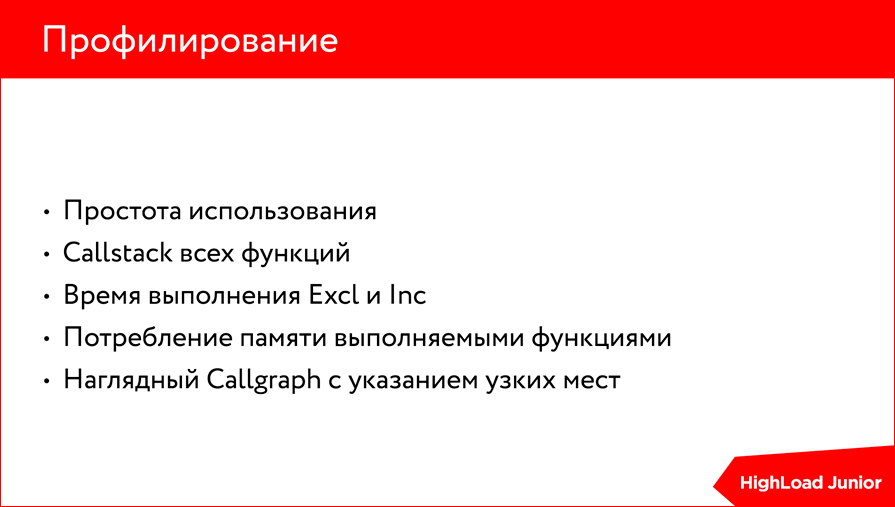
The next step towards a quicker understanding of your application, and if it is not yours, then this is an even more interesting tool for you, is profilers. Profilers are almost for every language, it seems to me that they are for every language. And each self-respecting profiler is marked by certain advantages, which, in principle, are the same for any profiler. This is ease of use, i.e. you just determine at what point you can start, where he needs to finish, write in the settings, what he should write, what behavioral characteristics and that's it. At the output, you get a callstack of all executed functions during profiling, i.e. you see how much function was executed, you have an understanding of how much this function was executed by itself, how many of its nested functions were executed, there is an understanding of how much memory it consumes.
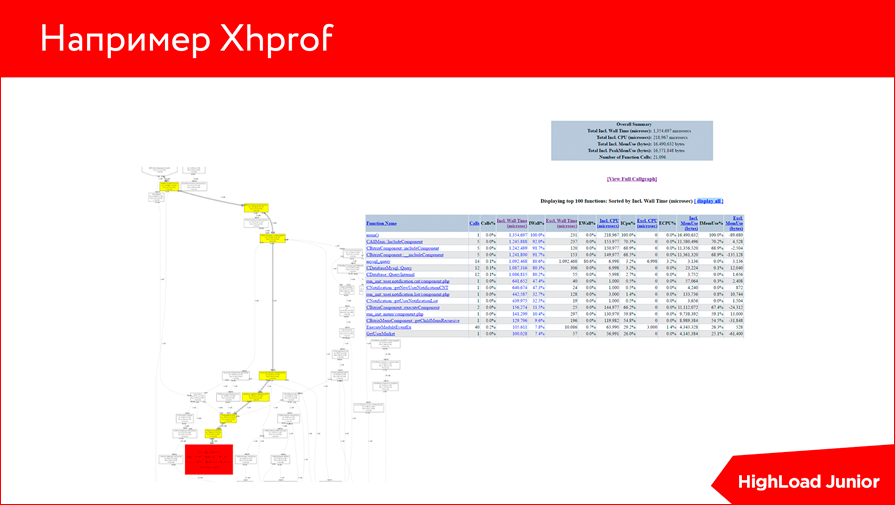
For example, there is Xhprof. We are developing in PHP and we have Xhprof. This is how he looks. It seems to me that many profilers have a similar interface - there is a certain table with callsteck, and there is a certain graph that shows you where some complex query started and where it ended.
There is also a Visual Studio profiler, still different, many profilers are easily googled in many languages.
Further, in order to better understand what we need to do, I propose to consider a small example. Let's start with the symptom.

We suddenly realize that our site is very slow. In this case, the high execution time of the script is on the server, i.e. we realized that we have all the rules at the front, but there are some problems with the formation of the script. All we need is a profiler or slow logs - as you like, who has what, who can configure what.
And such a small thing is the EXPLAIN team. In the future, you will understand why.

We stick in the profiler and see such a thing that we have 14 MySQL_query calls in 1 second. Not a very good indicator.
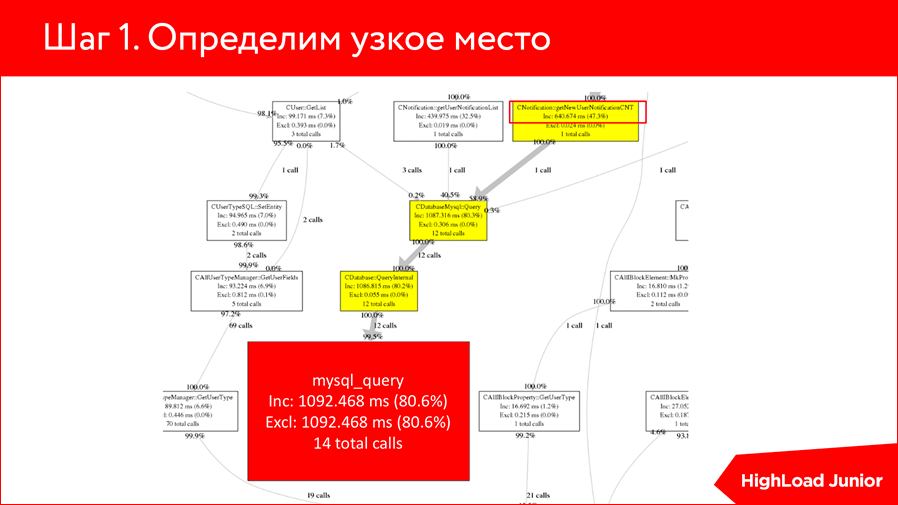
If we follow a little higher, then we understand that some function called getNewUserNotificationCNT is executed only 640 milliseconds and, most likely, of these 640, it 620 performs the request. Those. you can simply assume and understand that the profiler worked here, and this function is our bottleneck. All we need is to go into this function and see what kind of request it performs.

We see that the request is very trivial - this is the choice of the number of new, unread notifications. In fact, here, perhaps, it is immediately clear what the problem is, what is wrong with this query, but to check our fears, we do EXPLAIN of this SELECT:

We understand that this SELECT, which wants the user to select all unread notifications, runs through a table with a million rows. Agree, the situation is not very. I want to select a separate user, God forbid, I have some 10 notifications, and he takes them to me for the whole million. Plus, COUNT (*) is a fairly loaded operation. In short, something is wrong here. And we see from this EXPLAIN that there are no indexes at all on these tables, and in this plan he clearly does not want to use anything.
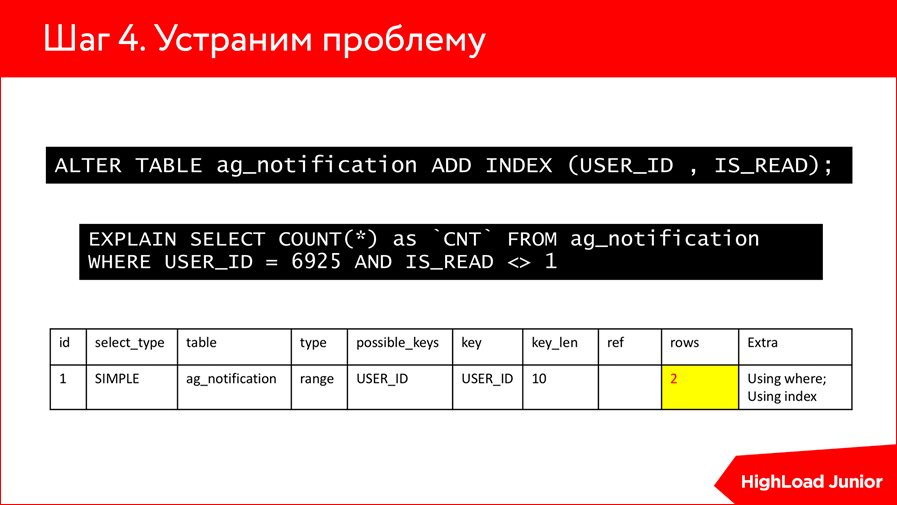
We move on. We make a simple ALTER TABLE, add INDEX by USER_ID and by read. And what do we see? That we have from a million records, the number was reduced to two. It seems to me that the amazing work of indexes from 1 million lines goes over to two.
This example shows that we stuck EXPLAIN, saw that we had an unusually huge number of rows involved, and realized that we needed to roll some kind of indexes.
You also need to be careful with indexes. And with EXPLAIN. Because if you have EXPLAIN working in one version one at a time, then it is not a fact that it will work in the same database, but in a different version, because EXPLAIN involves both planners and optimizers, and planning strategies can change from version to version . Therefore, you also need to be careful with them, and not the fact that the index that you rolled on one DBMS is, as it were, the norm for another. Here is a very trivial example, but in principle it can be skilled for various more complex queries and watch.
If we had any more join'ny or some other tables, EXPLAIN would show a few more rows here and tell you that it would use - where or an index - and how many rows from each table would be involved. An interesting tool that, I think, needs to be used in any query diagnosis, it will help you explain a lot.

As a result, our query execution from 1 s was reduced to 300 ms. It seems to me a good indicator overall. If we talk about page loading, then before this operation with the index of one line of code, it took 2.5 seconds, after this optimization - 700 ms. Those. wow such an optimization, it's without a cache yet.
What problems may still be in our way? Here is some top logical error of programmers:

The first thing that occurs is the execution of queries to the DBMS in a loop. This is when you have a select from some table, and then inside another cycle, when it goes along the lines of that select, another select is made, in principle, of the same type, which could be brought out to the first, through join'y some get additional information. For Bitrix developers, a fairly common problem is because they make their get list, go to get list forych and get some other get list. Not very cool it affects performance.
The second problem is infinite loops in the code, i.e. some kind of logical error, where your while should go up to a certain value, work out five times, and you just sausage it an infinite number of times. This doesn’t have a very good effect on your application, and it just doesn’t produce anything in the end.
There is also such an error (with the help of the profiler it is very well defined) - unnecessary function calls. This is when instead of cramming the value of some function execution into a variable, this function is substituted for the variable, and it is called a wild number of times, especially when working with strings. Such a moment, which in theory can break your system.

What to do about it? Here, it seems to me, there are no options, just do some refactoring, fix errors in the code and do the code review more correctly in the next one.

But in this world, there are other processes that are not a developer’s mistake; rather, they’re an underestimation of your application. When you thought that this process should not affect a large number of resources, but in the end it just sausages millions of lines - this is a surprise for you. There are practices for these things. If you have any process that is not very critical for you to perform in real time, just take it to cron, to the scheduler, or do some step-by-step script, or enter the concept of queues, if you need to do some loaded operation, and then quickly give the content to the user.

Examples of such operations are typical. This is either the import of goods, which obviously should not be carried out on hits, but should be carried out late at night when no one is on the site. Sending mail is also a rather illustrative example, because if you have a large flow of sending messages, this can load your server, it is better to queue for such things. We had such examples when the client needed to generate reports in excel, and there were a lot of lines there, but he needed the report to be shown on click. Here we introduced step-by-step creation or also translated into queues, i.e. he clicked there, they said to him: “Soon you will have a report, come in 5 minutes”, and then this report was formed and given. Such techniques are applicable and quite effective on any platform.

We come to the question that if everything is fine with you, if your code is licked, if the indexes in the database are configured, if you have nothing critical at the front, and you understand that the site should, in principle, work quickly, but it still slows down.

Here horizontal scaling comes to our aid, because any optimization sooner or later comes to a standstill - it is limited by the resources of your server anyway. Those. no matter how much you lick your code, no matter how many different approaches to creating indexes are developed, one way or another you will all once run into server resources.
And here you have two options:
- either you upgrade your server - stick another RAM slot, make the drives faster, or just increase the processor power;
- or you go to horizontal scaling, which basically solves two problems. The first is redundancy, i.e. you always have some kind of reserve in case you have lost the first server, master, and you have some kind of load balance, i.e. Your load is no longer concentrated on one server, but distributed on several, which positively affects the speed of your application.
But here it is important to understand that this is all cool when you have working code. If you have any errors in the application, then it and 10 servers may not save. You just have some kind of crazy load on all these servers, and instead of increasing from 100 users to 1 million, you will reach only 150 from 100. Here it’s important to understand this border too.

To summarize, then, in principle, do not look for universal methods, because there are none, each task is unique. For some kind of optimization - just right here and now stick a RAM slot and you do not need anything else. For the first time, this will give you a delay until you refactoring, it is not very expensive to upgrade your server, buy an additional processor, and memory.
First of all, identify the bottleneck, i.e. Before you do anything, it is better to conduct a diagnosis to know exactly where you really have a bug.
Use simple tools, i.e. no need to invent any mega solutions, there is an operating system, there are its tools, there are various profilers - use them.
Buy RAM - this is also an optimization. Here, too, about the fact that sometimes the question is not in optimizing the code or application, but simply in buying an additional RAM slot, which will solve the lion's share of your problems.
And do not be afraid of the upcoming horizontal scaling. Sooner or later, if you plan that your site will still live, you will come to this one way or another, because the load will increase, some processes on the site will increase, and you will have to scale it horizontally anyway.
Contacts
» [email protected]
This report is a transcript of one of the best presentations at a training conference of developers of highly loaded systems HighLoad ++ Junior . Now we are actively preparing the older brother HighLoad ++ Junior - a conference of developers of high-loaded systems HighLoad ++ 2016 - this year HighLoad ++ will be held in Skolkovo, November 7 and 8.
The difference between conferences is important - Junior is not for children. This is about highload in conditions of limited resources (temporary, monetary, qualifying). HighLoad for design studios - how to withstand high traffic in real conditions, without developing our own modules for nginx :)
Also, some of these materials are used by us in an online training course on developing highly loaded HighLoad.Guide systems- This is a chain of specially selected letters, articles, materials, videos. Already in our textbook more than 30 unique materials. Get connected!