Harness R to the service of business at "1-2-3"
This post is, in fact, a summary summarizing the results of previous “technological” publications [ 1 , 2 , 3 , 4 , 5 ] and the discussions that have arisen. The latter showed that the tasks in which the use of R could be of great help to the business are very, very many. However, even in cases where R is used, the modern capabilities of R. are not always used for this.
The niche for applying R in business is open and very relevant both in the West and in Russia.
Why is this statement especially interesting for Russia?
1. There is an active process of import substitution of software, controlled at the level of ministries and government. Many will prefer to use software from the allowed list rather than come up with justifications and prove the need to purchase foreign software, albeit a little better than their Russian counterparts. And attention to state-owned companies is much closer.
2. Unfortunately, there are no reports that the crisis has ended and the rise is beginning. Tighten your belts - yes. This means that budgets for expensive toys are not very foreseen. At the same time, nobody canceled the solution of tasks; the number and ambitiousness of tasks are only likely to increase.
3. Business quite rightly believes that if IT does not create competitive advantages, at least it should help to quickly prepare an information field for manual or automated decision-making. At the same time, business requests are often very prosaic and unassuming to attract Nobel laureates to solve them.
In fact, for a confident swim in the “digital” sea, business needs only a local “stitching” of the information space and the formation of interactive representations to simplify the decision-making process in the context of a very limited set of issues and processes.
In general, the decision-making situation can be described as follows:
- In any company, every employee makes many important business decisions every day.
- The time for making a decision is small (seconds-hours).
- The question is not always formulated in a clear and unambiguous form.
- Making decisions may require complex mathematical data processing.
Technologically, this process is described by the chain "Collection - Processing - Modeling and Analysis - Visualization / Unloading".
The locality of “cross-linking” leads to the fact that the use of powerful industrial ETL \ BI \ BigData solutions is completely unjustified from both a technical and economic point of view.
In order to plant a bed of carrots, do not plow a dozen hectares of land.
On the other hand, such a context is very comfortable for ecosystem R and is executed at a time. For business, the “1-2-3” approach can be summarized in the following image (a business does like pictures):

When using R, it is technologically almost all the same what kind of data sources and what formats are there, how clean they are, what and how to draw and display. Almost everything is possible. The main thing is to have a formulated business task.
Back to practical example
As a demonstration of the applicability of the above approach, let us once again turn to the topic mentioned earlier in the post “Data Science Tools as an Alternative to the Classic Integration of IT Systems” , namely, the example of the agronomist’s console as part of one of the sub-tasks of the modern direction “Precision Farming”.
The subtask itself sounds very prosaic: “To optimize the irrigation of fields, taking into account the characteristics of the cultivated crop, phenological phases and climatic conditions (past, present, forecast) to improve crop quality and reduce costs .”
Naturally, IT analytics subsystem is only one of the subsystems. The full complex also covers the tasks of choosing the optimal method and direct measurement of physical indicators of soil moisture (which is not easy in itself) and environmental parameters, autonomous operation of sensors and transmitting telemetry via radio channel taking into account the scale of the fields (several tens of kilometers), low cost + compactness + work without changing the battery throughout the season, optimizing the placement of sensors and protecting them from various influences, including the increased interest of local residents, as well as taking into account the water balance in plants (roughly, absorption - evaporation). But all these tasks are beyond the scope of this publication.
So, the console is an agronomist. Everything is done on R + Shiny + DeployR. An example of a working version of the console is shown in the following screenshot:
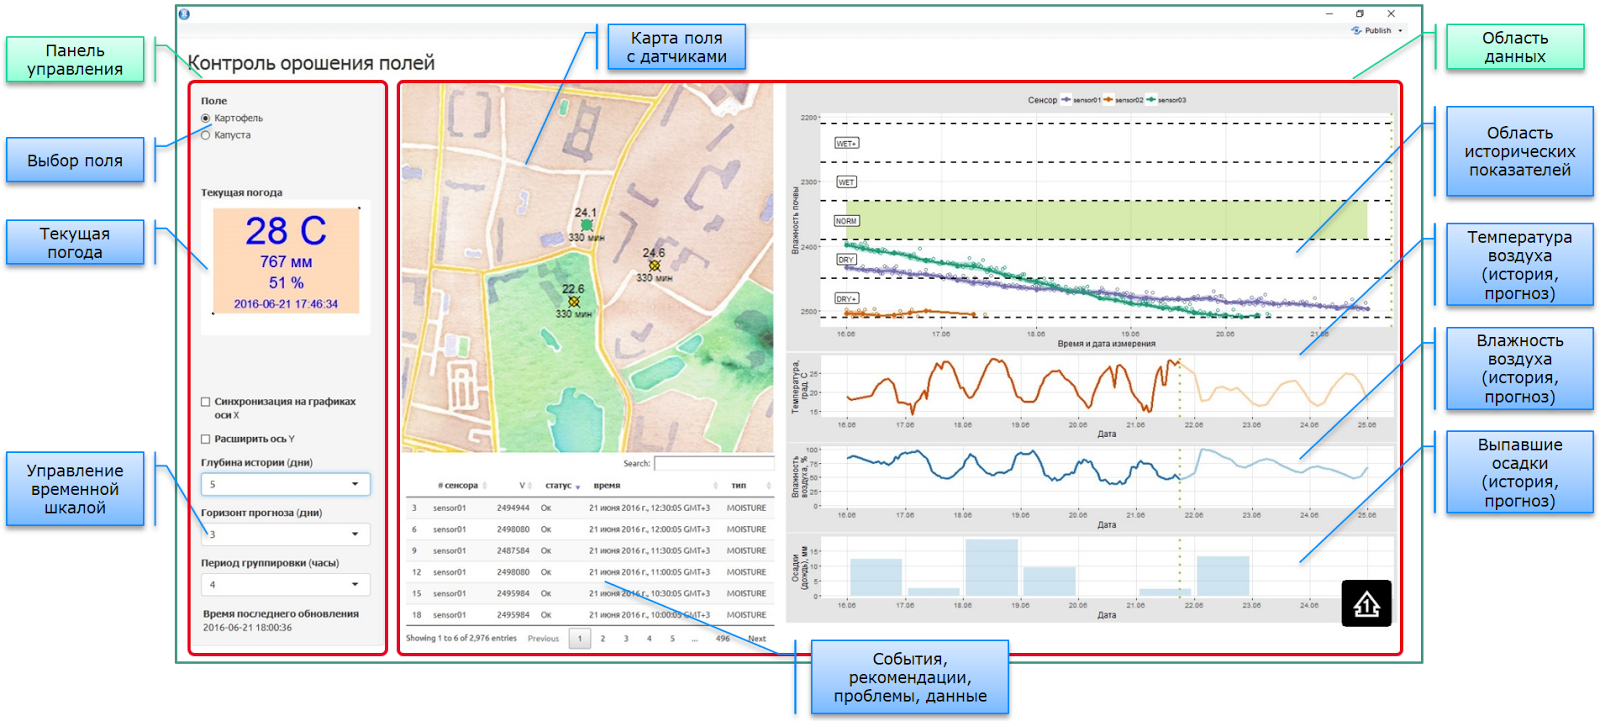
Everything looks simple and trivial evenly until you dive into the details. Namely, the proposed approach to local data stitching is manifested in detail .
1. There is no global repository with a rigid data model containing all-all-all information. On the contrary, there is a set of autonomous or semi-autonomous subsystems containing a subset of information in its own form.
2. Since the agronomist’s console and the information displayed in it are needed when there is someone to watch, the application itself acts as an endless loop for the message manager. The console is dynamic, the need for recounting is checked by timer, the elements are updated automatically, using the reactive elements of the Shiny platform. At the same time, autonomous operational analytics lives on the R server in a console-independent mode.
3. Current weather. Data is taken from several sources, including web sources (REST API) and actual sensor data in the field (log \ csv + git). Since all sensors on the field save batteries and communicate in their own mode, data is sent to the console in asynchronous mode. The git repository was used as a field data warehouse.
4. For operational analysis, the interface contains, among other things, elements that control the displayed slices. All recounting occurs upon a change in settings.
5. GIS-card with installed sensors in the field. A multilayer map (here, as an OpenStreet substrate) with an imposed infrastructure of field sensors, and dynamically recalculated indicators of these sensors, such as: current status, current readings, time of the last readings. Meta-information about sensors is obtained from the cloud-based accounting system for IoT equipment. Due to the rather complex internal logical structure of the IoT platform objects, to obtain sensor data, it is necessary to execute a chain of 3-4 REST API requests with intermediate processing.
6. Tabular presentation for the output of event information: indications, logs, recommendations, problems, forecasts. Each type of information displayed is obtained either from a separate source (connection, collection, parsing, pre-processing), or is the result of the work of the mat. algorithms (e.g. forecasts and recommendations).
7. The data area (right) combines in a single console information received and processed from a dozen different sources:
Data on historical weather indicators. The data from field sensors (txt + git) and weather data from open web sources are used. Due to the fact that free accounts (after preliminary analysis of several web sources) do not have a deep history everywhere, and the idea of paying $ 100-150 per month for accessing weather data of agricultural producers is not happy at all, a separate process of accumulating historical web data based on current monitoring (REST API -> txt + git). And, of course, in case of conflict of data from different sources, it is necessary to resolve it. As one of the main sources, we settled on the Open Weather Map - OWM
The forecast part also raised a number of questions. Different sources give different information with different granularity. Not all sources predict precipitation in mm. If they give, then not everyone gives hourly. Can issue units. They need to be somehow reduced.
In particular, when requesting precipitation, OWM issues a 3-hour aggregate in mm, starting from the moment of fixation. If we talk about the past, then the moment of fixation can also be issued random. Thus, we get an arbitrary time series with 3-hour units and a large number of repetitions, according to which it is necessary to restore the hourly picture.
Data from the sensors comes in through various channels. The sensors themselves "live" in asynchronous mode (battery saving), so the data from them comes in stream mode, without the possibility of forced polling. Non-guaranteed communication channels (everything is in the field, sometimes in a bad coverage area) and various versions of the sensor hardware platforms lead to the fact that for analysis it is necessary to collect data from all potential storages. At the moment, sensor data is being sent to git (structured view and logs) and to the cloud-based platform for managing IoT devices.
- Data from the sensors (and not 2 or 5 on the field) undergo preliminary mathematical processing. Due to the specifics of measuring soil moisture and the impossibility of direct measurements (with a certain caveat for NMR or radiometric methods), the result of indirect measurements strongly depends on the structural properties of the soil. It is necessary to determine the reliability of the readings of each of the sensors, relying both on its private calibration curves, and on historical data, expected indicators, data on irrigation carried out and information from other sensors on the field.
Conclusion
In the West, the R community, as well as the range of tasks to be solved, is developing exponentially. Open-source is actively coming. You can use the R-bloggers aggregator as a launching pad to familiarize yourself with the latest developments in the R part . For example, here’s a very interesting fresh business post: “Using R to detect fraud at 1 million transactions per second” .
In Russia, there are all the prerequisites for using R in business tasks, but so far the community is relatively weak. On the other hand, an active and inquisitive audience of Habr is the best conductor of modern IT technologies in our country.
It's time to try to solve the problems existing in your companies in a new way, using new tools, and begin to share the experience gained. Discussion of issues and incomprehensible points in open discussions will only contribute to this.
PS By the way, now the semantics of the package are also dplyravailable for working with Apach Spark. A package sparklyproviding this transparency has been released.
Previous post: "You do not have enough R speed? We are looking for hidden reserves"
Next post: "Using R for the preparation and transfer of" live "analytics to other business units"