CodeRush for Roslyn: Part 2 - feature review for better code
We are releasing a new product - CodeRush for Roslyn (hereinafter CRR ).
The first part was about Unit Test Runner, and in this article we will talk about CRR features that help improve the quality of the code:
All examples in the article are made in Visual Studio 2015 on the sources of the OpenCover project .
Visual Studio checks the code when typing. For example, for this piece of code in the Error List, the warning The variable'testValiable 'is declared but never used (CS0168) appears .

In Visual Studio 2015, the generation of such errors is implemented in special classes called Roslyn Code Analyzer . Code Analyzer is, simply put, part of the implementation of the Visitor pattern for Roslyn Syntax Tree. But if you look in MSDN for error code CS0168 , there is this article , CS0168 is called “Compiler Warning” in it, and not Analyzer or Diagnostic , as is customary in Roslyn. This is due to the fact that CS0168appeared in those days when Roslyn was not yet used in Visual Studio, and this error was detected at the stage of partial code compilation. We will not go further into details, but it is useful to know that in Visual Studio 2015 almost all messages in the Error List are generated using Roslyn Code Analyzers . Read more about them here . A complete list of standard diagnostics for .NET can be found here . CRR adds the following diagnostics to this set:

This screenshot is made from a standard studio ruleset editor, i.e. if you use a studio code analyzer, just add the CRR diagnostics to your ruleset.
Let's check the OpenCover projectusing standard Visual Studio diagnostics. To do this, open the solution properties and set the settings as shown in the picture.

And, as a result, we get about a thousand messages in the Error List.

A thousand messages is not the limit, because not the largest set of diagnostics was used. However, it is not the number of diagnostics that matters, but their quality. It’s worth attracting the attention of the developer only when it is really needed.
Let's try to analyze OpenCover using our diagnostics. There are three ways to do this:
If the project is large, static analysis in the background may interfere with the normal operation of Visual Studio. This is due to the fact that diagnostics deploy syntax trees and in some situations this leads to significant memory consumption. After checking, full syntax trees become unnecessary, and memory is freed. But this creates memory traffic, and leads to the fact that most of the computing resources will be spent on garbage collection. Manual verification mode will make predictable moments when Visual Studio is slow. To start the static analysis in this mode, you need to click on the Refresh button in the Code Issues window (the Refresh button is the first on the left).

Manual start of diagnostics is also provided.in the Visual Studio interface . But in this case, you will have to add the CRR diagnostics to the ruleset as described here .
Visual Studio has a standard mechanism for performing static code analysis in the background. This mechanism is described here . As already mentioned, a background check on large projects can cause studio friezes. Turn on with caution. For CRR diagnostics to be performed in this mode, you must set the Include CodeRush diagnostics into the VisualStudio background analysis option .

The CRR contains an executable file that can be run from the command line on the developer's machine or on the build server. The file is called DevExpress.StaticCodeAnalysis.exe . You can find it in the plugin directory (you can open it from CodeRush | Support | Extension Folder ... ). The file is a fully standalone console version of CRR diagnostics. No additional files are required for its operation. Thanks to this, it is easily integrated into any assembly system. It is enough to copy DevExpress.StaticCodeAnalysis.exe to the build server and enter a simple call to the build script:
As a result , a report with the results of the verification will be generated in results.txt .
We do not chase the number of diagnostics, but implemented only really useful ones, paying much attention to false positives. The result of checking OpenCover sources is shown below.

There were only a couple of strange places:

In this section of the diagnostic code, we found that CurrentCulture and CurrentUICulture are assigned twice. Diagnostics worked correctly, but apparently, this is done in order to get the text exception in English.
The second strange place was found in tests.

The result variable is assigned two times. Diagnostics worked correctly, although the author of the test wrote in the comments that this was intended. Excellent result - not a single false positive.
In CRR, naming and spell checking are also implemented as Roslyn Code Analyzer . These checks are disabled by default because you need to configure them before using them. For example, if you enable without customization on the OpenCover project , the Error List will contain a huge number of messages about violation of naming rules. There is a page in Options for setting naming rules . In it, you can enable and configure naming checking for types, namespaces, properties, and so on. Spellchecker is

implemented on the DevExpress Spellchecker core . Typos fall into the Error List, and also stand out in the code with a wavy line. In the context menu, spellchecker forms a list of proposed replacements.
In addition to diagnostics, there is another way to improve your code. This is code coverage with tests. In a previous article, there was an overview of the capabilities of our Test Runner , but they did not talk about running tests with coverage analysis. The Test Runner have a test run mode, which made instrumentation code. In this mode, the test run takes longer, so separate buttons are provided to run tests with coverage analysis.

Coverage can be viewed in the Code Coverage Tool Window . This screenshot shows that the else branch of the condition in the second cycle is not covered by tests.

Based on the results of a coverage analysis, new tests are usually written that increase the percentage of coverage. It should be remembered that 100% coverage of the code with tests does not guarantee the absence of problems in it. For example, this piece of code has a high percentage of coverage.

But among the tests there is no one that checks conditional branching when the condition is met.
And if the coverage were considered not by operators, but by branches of conditional operators, then the figure would be different.
CodeRush for Roslyn is a new convenient tool that helps you write the correct code and fix problems in the existing one. You can download a try in the Visual Studio Gallery .
In the next part , we’ll look at the capabilities of CRR for navigating code.
The first part was about Unit Test Runner, and in this article we will talk about CRR features that help improve the quality of the code:
- Static Analysis
- Spell Checker
- Naming Conventions
- Analysis of code coverage by tests (Test Coverage).
All examples in the article are made in Visual Studio 2015 on the sources of the OpenCover project .
Static analysis
Visual Studio checks the code when typing. For example, for this piece of code in the Error List, the warning The variable'testValiable 'is declared but never used (CS0168) appears .
In Visual Studio 2015, the generation of such errors is implemented in special classes called Roslyn Code Analyzer . Code Analyzer is, simply put, part of the implementation of the Visitor pattern for Roslyn Syntax Tree. But if you look in MSDN for error code CS0168 , there is this article , CS0168 is called “Compiler Warning” in it, and not Analyzer or Diagnostic , as is customary in Roslyn. This is due to the fact that CS0168appeared in those days when Roslyn was not yet used in Visual Studio, and this error was detected at the stage of partial code compilation. We will not go further into details, but it is useful to know that in Visual Studio 2015 almost all messages in the Error List are generated using Roslyn Code Analyzers . Read more about them here . A complete list of standard diagnostics for .NET can be found here . CRR adds the following diagnostics to this set:
This screenshot is made from a standard studio ruleset editor, i.e. if you use a studio code analyzer, just add the CRR diagnostics to your ruleset.
Let's check the OpenCover projectusing standard Visual Studio diagnostics. To do this, open the solution properties and set the settings as shown in the picture.
And, as a result, we get about a thousand messages in the Error List.
A thousand messages is not the limit, because not the largest set of diagnostics was used. However, it is not the number of diagnostics that matters, but their quality. It’s worth attracting the attention of the developer only when it is really needed.
Let's try to analyze OpenCover using our diagnostics. There are three ways to do this:
- Run a scan manually.
- Check in the background.
- Verification from the console.
Manual scan start
If the project is large, static analysis in the background may interfere with the normal operation of Visual Studio. This is due to the fact that diagnostics deploy syntax trees and in some situations this leads to significant memory consumption. After checking, full syntax trees become unnecessary, and memory is freed. But this creates memory traffic, and leads to the fact that most of the computing resources will be spent on garbage collection. Manual verification mode will make predictable moments when Visual Studio is slow. To start the static analysis in this mode, you need to click on the Refresh button in the Code Issues window (the Refresh button is the first on the left).
Manual start of diagnostics is also provided.in the Visual Studio interface . But in this case, you will have to add the CRR diagnostics to the ruleset as described here .
Background check
Visual Studio has a standard mechanism for performing static code analysis in the background. This mechanism is described here . As already mentioned, a background check on large projects can cause studio friezes. Turn on with caution. For CRR diagnostics to be performed in this mode, you must set the Include CodeRush diagnostics into the VisualStudio background analysis option .
Validation from the console
The CRR contains an executable file that can be run from the command line on the developer's machine or on the build server. The file is called DevExpress.StaticCodeAnalysis.exe . You can find it in the plugin directory (you can open it from CodeRush | Support | Extension Folder ... ). The file is a fully standalone console version of CRR diagnostics. No additional files are required for its operation. Thanks to this, it is easily integrated into any assembly system. It is enough to copy DevExpress.StaticCodeAnalysis.exe to the build server and enter a simple call to the build script:
DevExpress.StaticCodeAnalysis.exe EditorsDemos\EditorsSamples_CS.sln results.txt As a result , a report with the results of the verification will be generated in results.txt .
Validation Results
We do not chase the number of diagnostics, but implemented only really useful ones, paying much attention to false positives. The result of checking OpenCover sources is shown below.
There were only a couple of strange places:
In this section of the diagnostic code, we found that CurrentCulture and CurrentUICulture are assigned twice. Diagnostics worked correctly, but apparently, this is done in order to get the text exception in English.
The second strange place was found in tests.
The result variable is assigned two times. Diagnostics worked correctly, although the author of the test wrote in the comments that this was intended. Excellent result - not a single false positive.
Check naming and typos in names
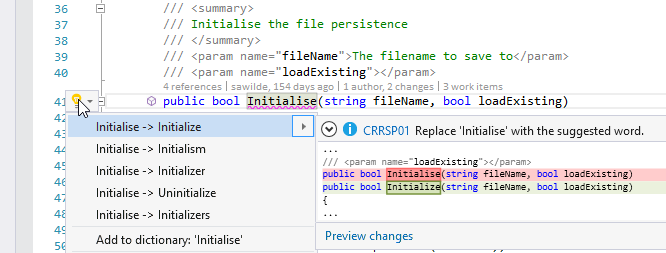
In CRR, naming and spell checking are also implemented as Roslyn Code Analyzer . These checks are disabled by default because you need to configure them before using them. For example, if you enable without customization on the OpenCover project , the Error List will contain a huge number of messages about violation of naming rules. There is a page in Options for setting naming rules . In it, you can enable and configure naming checking for types, namespaces, properties, and so on. Spellchecker is
implemented on the DevExpress Spellchecker core . Typos fall into the Error List, and also stand out in the code with a wavy line. In the context menu, spellchecker forms a list of proposed replacements.
Test code coverage with tests
In addition to diagnostics, there is another way to improve your code. This is code coverage with tests. In a previous article, there was an overview of the capabilities of our Test Runner , but they did not talk about running tests with coverage analysis. The Test Runner have a test run mode, which made instrumentation code. In this mode, the test run takes longer, so separate buttons are provided to run tests with coverage analysis.
Coverage can be viewed in the Code Coverage Tool Window . This screenshot shows that the else branch of the condition in the second cycle is not covered by tests.
Based on the results of a coverage analysis, new tests are usually written that increase the percentage of coverage. It should be remembered that 100% coverage of the code with tests does not guarantee the absence of problems in it. For example, this piece of code has a high percentage of coverage.
But among the tests there is no one that checks conditional branching when the condition is met.
if(_domain == null) return; And if the coverage were considered not by operators, but by branches of conditional operators, then the figure would be different.
CodeRush for Roslyn is a new convenient tool that helps you write the correct code and fix problems in the existing one. You can download a try in the Visual Studio Gallery .
In the next part , we’ll look at the capabilities of CRR for navigating code.