As I understood that I eat a lot of sweets, or the classification of goods by check in the application
Task
In this article, we want to tell how we created a solution for classifying product names from checks in an application for accounting for expenses by check and purchase assistant. We wanted to give users the ability to view purchase statistics collected automatically based on scanned checks, namely, to distribute all products purchased by the user into categories. Because forcing the user to independently group products is already the last century. There are several approaches to solve this problem: you can try to apply clustering algorithms with different methods of vector representation of words or classical classification algorithms. We have not invented anything new and in this article we just want to share a small guide about a possible solution of the problem, examples of how not to do it, analysis of
Clustering
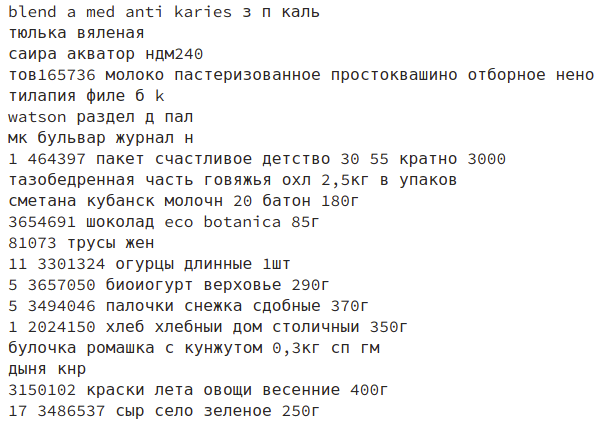
One of the problems was that the names of the goods we receive from checks are not always easy to decipher, even to a person. It is unlikely that you will find out what kind of product with the name “UTRUSTA krnsht” was bought in one of the Russian stores? True connoisseurs of Swedish design will certainly answer us right away: Bracket for the Utrusta oven, but keeping such specialists in the headquarters is quite expensive. In addition, we did not have a ready-made, marked sample suitable for our data, for which we could train the model. Therefore, we first describe how, in the absence of data, we applied clustering algorithms for learning and why we did not like it.
Such algorithms are based on measurements of distances between objects, which requires their vector representation or the use of a metric to measure word similarity (for example, Levenshtein distance). At this step, the complexity lies in the meaningful vector representation of the names. It is problematic to extract from the names properties that will fully and comprehensively describe the product and its relationship with other products.
The simplest option is to use Tf-Idf, but in this case, the dimension of the vector space is quite large, and the space itself is discharged. In addition, this approach does not extract any additional information from the titles. Thus, in one cluster there can be many products from different categories, united by a common word, such as, for example, “potato” or “salad”:

We also cannot control which clusters will be assembled. The only thing that can be designated is the number of clusters (if algorithms are used that are not based on density peaks in space). But if you specify too small an amount, then there will be one huge cluster that will contain all the names that could not fit in other clusters. If you specify a large enough, after the operation of the algorithm, we will have to browse through hundreds of clusters and combine them into semantic categories with our hands.
The tables below provide information on clusters using the KMeans and Tf-Idf algorithm for vector representation. From these tables we see that the distances between the centers of the clusters are smaller than the average distance between the objects and the centers of the clusters to which they belong. Such data can be explained by the fact that there are no apparent density peaks in the space of vectors and the centers of the clusters are located around the circumference, where most of the objects are located outside the boundary of this circle. In addition, a single cluster is formed, which contains most of the vectors. Most likely in this cluster are collected names that contain words that occur more frequently than others among all products from different categories.
| Cluster | C1 | C2 | C3 | C4 | C5 | C6 | C7 | C8 | C9 |
|---|---|---|---|---|---|---|---|---|---|
| C1 | 0.0 | 0.502 | 0.354 | 0.475 | 0.481 | 0.527 | 0.498 | 0.501 | 0.524 |
| C2 | 0.502 | 0.0 | 0.614 | 0.685 | 0.696 | 0.728 | 0.706 | 0.709 | 0.725 |
| C3 | 0.354 | 0.614 | 0.0 | 0.590 | 0.597 | 0.635 | 0.610 | 0.613 | 0.632 |
| C4 | 0.475 | 0.685 | 0.590 | 0.0 | 0.673 | 0.709 | 0.683 | 0.687 | 0.699 |
| C5 | 0.481 | 0.696 | 0.597 | 0.673 | 0.0 | 0.715 | 0.692 | 0.694 | 0.711 |
| C6 | 0.527 | 0.727 | 0.635 | 0.709 | 0.715 | 0.0 | 0.726 | 0.728 | 0.741 |
| C7 | 0.498 | 0.706 | 0.610 | 0.683 | 0.692 | 0.725 | 0.0 | 0.707 | 0.714 |
| C8 | 0.501 | 0.709 | 0.612 | 0.687 | 0.694 | 0.728 | 0.707 | 0.0 | 0.725 |
| C9 | 0.524 | 0.725 | 0.632 | 0.699 | 0.711 | 0.741 | 0.714 | 0.725 | 0.0 |
| Cluster | Number of objects | Average distance | Minimum distance | Max distance |
|---|---|---|---|---|
| C1 | 62530 | 0.999 | 0.041 | 1.001 |
| C2 | 2159 | 0.864 | 0.527 | 0.964 |
| C3 | 1099 | 0.934 | 0.756 | 0.993 |
| C4 | 1292 | 0.879 | 0.733 | 0.980 |
| C5 | 746 | 0.875 | 0.731 | 0.965 |
| C6 | 2451 | 0.847 | 0.719 | 0.994 |
| C7 | 1133 | 0.866 | 0.724 | 0.986 |
| C8 | 876 | 0.863 | 0.704 | 0.999 |
| C9 | 1879 | 0.849 | 0.526 | 0.981 |
But in some places the clusters are quite decent, as, for example, in the image below - there, almost all products belong to cat food.

Doc2Vec is another of the algorithms that allow you to represent texts in a vector format. When using this approach, each name will be described by a vector of smaller dimension than when using Tf-Idf. In the resulting vector space, similar texts will be close to each other, and various texts will be far away.
This approach can solve the problem of high dimensionality and space dilution, which is obtained by the Tf-Idf method. For this algorithm, we used the simplest version of tokenization: we divided the name into separate words and took their initial forms. He was trained on the data in this way:
max_epochs = 100
vec_size = 20
alpha = 0.025
model = doc2vec.Doc2Vec(vector_size=vec_size,
                alpha=alpha,
                min_alpha=0.00025,
                min_count=1,
                dm =1)
model.build_vocab(train_corpus)
for epoch in range(max_epochs):
    print('iteration {0}'.format(epoch))
    model.train(train_corpus,
                total_examples=model.corpus_count,
                epochs=model.iter)
    # decrease the learning rate
    model.alpha -= 0.0002# fix the learning rate, no decay
    model.min_alpha = model.epochs
But with this approach, we obtained vectors that do not carry information about the name - with the same success, random values can be used. Here is one example of the operation of the algorithm: in the image, goods similar to the opinion of the algorithm are represented by “Borodino bread forms in the pack 0.45k”.

Perhaps the problem is in the length and context of the names: the pass in the name "__ club. Banana 200ml" can be either yogurt, juice or a big can of cream. You can achieve a better result by using a different approach to tokenization of names. We had no experience using this method and by the time the first attempts failed, we had already found a couple of marked sets with product names, so we decided to leave this method for a while and go to the classification algorithms.
Classification
Data preprocessing
The names of goods from checks come to us in a not always clear form: Latin and Cyrillic words are mixed in words. For example, the letter “a” can be replaced by “a” Latin, and this increases the number of unique names - for example, the words “milk” and “milk” will be considered different. The names also contain many other misprints and abbreviations.
We studied our database and found common mistakes in the names. At this stage, we were treated with regular expressions, with the help of which we cleaned up the names and led them to a certain general form. When using this approach, the result is increased by approximately 7%. In conjunction with a simple version of the SGD Classifier based on the Huber loss function with twisted parameters, we obtained an accuracy of 81% for F1 (average accuracy for all categories of products).
sgd_model = SGDClassifier()
parameters_sgd = {
    'max_iter':[100],
    'loss':['modified_huber'],
    'class_weight':['balanced'],
    'penalty':['l2'],
    'alpha':[0.0001]
}
sgd_cv = GridSearchCV(sgd_model, parameters_sgd,n_jobs=-1)
sgd_cv.fit(tf_idf_data, prod_cat)
sgd_cv.best_score_, sgd_cv.best_params_
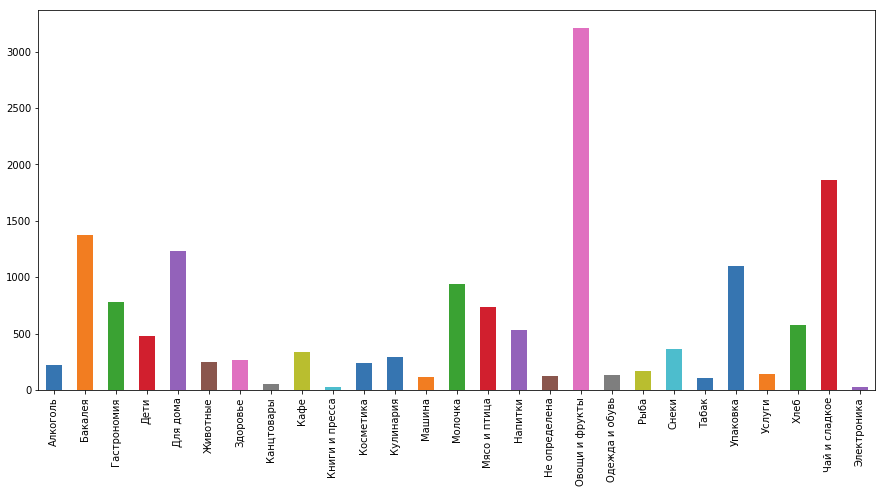
Also, do not forget that some categories of people buy more often than others: for example, “Tea and sweets” and “Vegetables and fruits” are much more popular than “Services” and “Cosmetics”. With such a distribution of data, it is better to use algorithms that allow you to specify weights (degree of importance) for each class. Class weight can be determined inversely with the value equal to the ratio of the number of products in the class to the total number of products. But you can not think about it, because in the implementation of these algorithms, it is possible to automatically determine the weight of categories.

Getting new data for training
For our application, we needed slightly different categories than those used in the competition, and the names of the products from our database were significantly different from those presented in the contest. Therefore, we needed to mark the goods from our checks. We tried to do it on our own, but realized that even if we connected our entire team, it would take a lot of time. Therefore, we decided to use “Toloka” of Yandex.
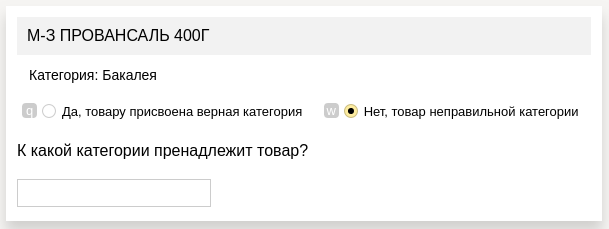
There we used the following assignment form:
- in each cell we had a product, the category of which you need to define
- its presumptive category, defined by one of our previous models
- answer field (if the proposed category was incorrect)
We created a detailed instruction with examples that explained the features of each category, and also used quality control methods: a set with reference answers that were shown along with the usual tasks (we implemented the reference answers ourselves, marking out several hundred products). According to the results of the answers to these tasks, users who were incorrectly marking the data were eliminated. However, for the entire project we banned only three users from 600+.

With the new data, we received a model that better suited our data, and the accuracy increased slightly (by ~ 11%) and received 92% already.
Final model
We began the classification process with a combination of data from several datasets with Kaggle - 74%, after which we improved the preprocessing - 81%, collected a new data set - 92% and finally improved the classification process itself: initially using logistic regression, we obtain preliminary probabilities of goods belonging to categories, based on the names of the goods, SGD gave greater accuracy in percent, but still had great values on the loss functions, which had a bad effect on the results of the final classifier. Next, we combine the data with other data on the product (the price of the product, the store in which it was purchased, statistics on the store, check and other meta-information), and XGBoost learns all this data volume, which gave an accuracy of 98% (increase another 6%).
Run on server
In order to speed up the deployment, we raised a simple server on Flask to Docker. There was one method that took goods from the server, which were to be categorized, and already returned goods with categories. Thus, we easily integrated into the existing system, the center of which was Tomcat, and we did not have to make changes to the architecture - we just added one more block to it.
Release
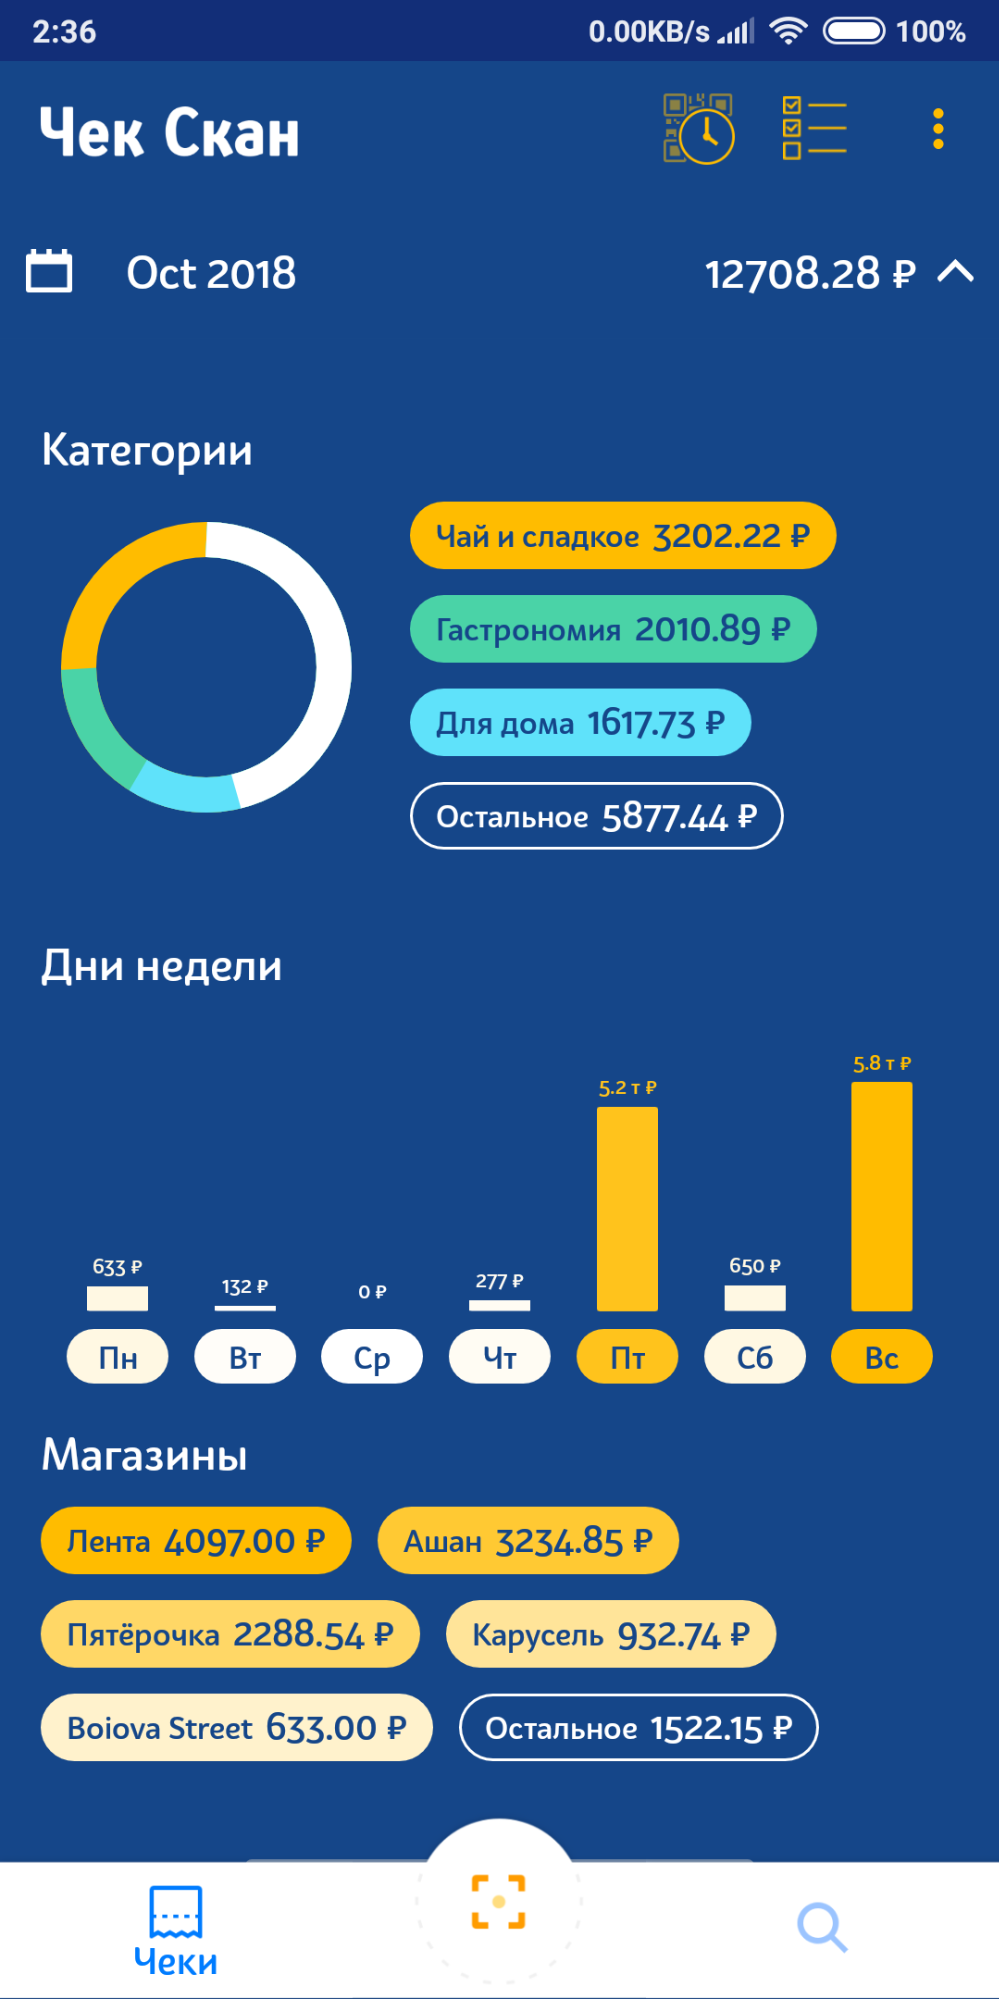
A few weeks ago, we posted a release categorized on Google Play (it will appear on the App Store after some time). It turned out like this:

In the next releases we plan to add the possibility of correcting categories, which will allow us to quickly collect categorization errors and retrain the categorization model (as long as we do it ourselves).
Mentioned competitions on Kaggle:
www.kaggle.com/c/receipt-categorisation
www.kaggle.com/c/market-basket-analysis
www.kaggle.com/c/prod-price-prediction
