“Scope”: how to monitor billions of kilowatt hours

There is such a power station - “Three Gorges” . They spent 10 years and $ 26 billion on it. Two cities went under water, resettled 1.3 million people. It generates 100 billion kWh per year, but it covers ... 1.7% of China's needs.
There are 192 nuclear power plants in the world with 444 power units with a total electric capacity of about 386,276 MW. (The capacity of the “Three Gorges” is 22,500 MW).
When I played C&C, RedAlert and Total Annihilation, it was nice to break through and destroy / capture a couple of enemy power plants, thereby slowing down the development of the enemy. It’s not surprising that now the energy infrastructure is a tidbit for hackers: “Hacking the electric grid: from a separate substation to blackout” , “Details on an unprecedented hacking of the Ukrainian electric network”.
Who writes software for systems of this scale and how?
The developers of the company EDISON told how they wrote the electrical system monitoring and visualization of events. A total of 14,984 man-hours were spent on the project, from April 2010 to August 2011.
Introduction
The energy sector ensures the livelihoods of all sectors of the economy. Economic growth inevitably entails an increase in demand for energy resources and requires solving the accumulated problems of equipment aging.
For the long-term stable provision of the economy and the population of the region with energy resources, a sound electricity policy is necessary, based on the strict control and monitoring of processes in the power grids.
To increase the response of the power grid monitoring system to events occurring in network nodes, the Sphere program is called in to replace obsolete event visualization software. “Sphere” is intended for displaying power grid diagrams on a screen with high resolution and size in the center for monitoring power grids. An important parameter that was required from the program was real-time operation with local image update at the event point. For this, the WPF library was used. Tools were developed for displaying and editing circuit elements in real time. For event management, the Pascal scripting engine was used. The graphic part is developed on WPF / C #, the logic of events is through Delphi / ScriptPascal. Delphi could not be avoided due to backward compatibility requirements with a number of old applications.
Main components
Modular architecture
Subsystem Delphi.
- DB graphic representation.
- Scripting module (scripts).
C # / WPF Subsystem.
- Visualization of a diagram of a graphical representation.
- Editing a graphical representation scheme.
Graphics core
The system graphics module is designed to visualize circuits based on CIM model data . Display of calculated values and telemetry data - both real time and for a given time. Graphics uses a high-performance Windows Presentation Foundation (WPF) library for visualization, which can render both programmatically and using hardware acceleration of modern video cards.
Graphics schemes automatically update data when data changes in the CIM model. The graphical presentation can be customized using a scripting language, which allows you to flexibly implement business logic. Scripting scripts perform calculations and can fully determine the behavior of graphical presentation objects.
The appearance of the visual representation is similar to a graph whose vertices are nodes and equipment objects, and edges are branches and communication objects. In addition to nodes and branches, on the visual representation there are data output blocks that display some values from the storage, and graphic primitives for designing the circuit.
Nodes can be represented as:
- circle;
- horizontal tire;
- vertical tire.
The node has attachment points that are used to connect additional equipment and nodes. They are located around the perimeter of the node with a specific step that can be configured. The connection of additional equipment is controlled by scenarios that, according to custom logic, enable or disable the display of signs of additional equipment:
- generator;
- synchronous compensator;
- load;
- reactor;
- static capacitor bank;
- active shunt.
Branches connect nodes. The branch is represented by a broken line, the ends of which are attached to the connection points of the start and end nodes. The solid line indicates the enabled branch, the dashed line indicates the disabled branch. On the branch there may be a sign whose display is controlled by scripts:
- transformer;
- longitudinal compensation device;
- cable line;
- current limiting reactor;
- switching device.
The display of the sign and state of the line depends on the parameters of the entity with which the branch is associated.
A view contains many layers, and any view object can be assigned to one or more layers. If at least one of the layers to which the object belongs is turned on, then the object is visible. If the object is not assigned to any layer, then it is always visible.
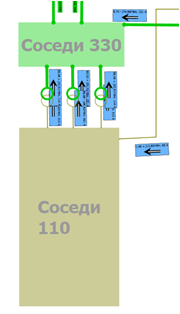
The nodes in the view can be combined into groups to replace at a certain scale with the image of the group. For example, the nodes that make up a substation can be combined into a “substation” group, and substations can be combined into a “station” group. By setting different scales for replacing the display of nodes with a group, it is possible to achieve that when approaching (zooming in) the image of the station is detailed to images of substations, with further approximation, individual nodes of substations will be shown.
Equipment objects and communication objects combine nodes and branches. As in the case of groups, the movement of objects leads to the movement of the branches and nodes included in the composition.
To display terrain maps or other graphical information, a graphical representation allows you to display raster and vector images. Images are always displayed under objects.
At the graphical level, WPF worked with such elements as Visual, DrawingVisual, Drawing, XAML; a quad tree was used to work with large volumes of graphic primitives, which optimized VisualCollection and Canvas objects.
Additional graphics optimization in which the quad tree was usedthere was a mode which in itself is not peculiar to the WPF system, but was added by us through the WinApi functions. This mode used WinApi functions, which performed moving a fragment of the image visible on the screen pixel by pixel depending on the direction of scrolling, while WPF had to update only a small fragment that remained after the image was shifted. Here the quad tree was turned on and transferred to the WPF engine working with VisualCollection and getVisualChild, only a set of objects included in the update area. When the program is launched in the monitoring center on a large monitor composed of many conventional monitors (about 20-30 pieces), when displaying events, the use of the quad tree significantly relieved the load from WPF and ensured high graphics performance.
Development Challenges and Optimization
Hit Test Optimization
When working with the hit test in the WPF system, performance problems were identified for some types of primitives. It was decided to replace the displayed type with an equivalent one, but not having these problems during the hit test operation.
Since we manage the hit test bypassing the enumeration of objects by the WPF system, we transfer information about the real visual element for which the hit test is performed on the hit handlers, and not about the element that WPF returns. In the main function of processing the hit test, we optimized it for using a quad tree. The hit test system in WPF is not implemented efficiently enough and not flexible enough for our tasks. Thus, in order to implement optimization for the quad tree, we had to simulate the hit-test “micro-views” for each object individually by taking the displacement vector and transformation matrix from Drawing objects to DrawingVisual objects.
Inside the hit test function itself, the algorithm is as follows.
- We make the region in the form of a very short line and check it for intersection.
- We create a stub of "micro-representation" - an analogue of Canvas.
- A special visual element is placed on the "micro-representation" and encapsulates vector graphics from each visual element in turn.
- We transfer information about the transformation to the visual destination element from the source and cancel the corresponding transformation of vector graphics.
var t = VisualTreeHelper.GetTransform(v); var o = VisualTreeHelper.GetOffset(v); destVisual.Transform = t; destVisual.Offset = o; if (drw.IsFrozen) drw = (DrawingGroup)drw.Clone(); drw.Transform = Transform.Identity; - In a special way, we form an element for the hit test of the power flow, which, when rendered, prepares a set of visual elements that correctly replace the low-level transformation operations for the hit test.
- We restore the transformation of vector graphics. The operation of canceling and restoring the transformation is associated with the incorrect operation of the hit test system with the transformation of objects inside the Drawing, while rendering to a bitmap, converting to EMF, etc. requires assembly of vector graphics at a low level (Drawing), taking into account the transformation of visual elements transferred inside this graphic.
Optimization of rendering of vector objects
By default, WPF uses a vector model to draw all objects, which reduces performance. For correction, a system of bitmap caches on top of Visual vector objects was implemented. Caches were redrawn when zooming or updating cached Visual content.
The caching system was built in such a way that for each visual element of type Visual it was necessary to create a separate bitmap object through interaction with Windows and receiving a handle for the bitmap, and since the number of available handles for the process is limited, it was necessary to take these limits into account. Accordingly, if a large number of objects were visible in the frame, then when this limit was exceeded, some of the objects had to be left without caches, but such cases did not happen often, and part of the cached images that worked all the same quite well increased the performance. The following approach is used to calculate limits.
RegistryKey hklm = Registry.LocalMachine;
hklm = hklm.OpenSubKey("SOFTWARE\\Microsoft\\Windows NT\\CurrentVersion\\Windows");
GDIResourcesMax = (int)hklm.GetValue("GDIProcessHandleQuota");
double GDIUsageLimit = 0.7;
double GDISafeResourcesLimit = GDIUsageLimit * GDIResourcesMax;
public static int GetGuiResourcesGDICount()
{
    return GetGuiResources(Process.GetCurrentProcess().Handle, 0);
}- GDIUsageLimit - coefficient that shows how many handles we can safely reserve for normal software operation;
- GDISafeResourcesLimit - accordingly, the number of objects taking into account the coefficient;
- GetGuiResourcesGDICount is a function that allows you to determine how many handles are allocated by the current process.
Based on these parameters, at the start of the application, bitmap handles were reserved in an array, from which they were subsequently extracted by the caching system as needed.
Each bitmap object is reserved with the following code:
var bm = new BitmapCacheBrush();
bitmapCacheFree.Add(bm);
Database
The graphical representation file is a backup of the Firebird database and stores information about how the graph is rendered. The visual presentation is created by the user and is located in a file with the extension “* .GVIEW”. A file may contain several diagrams.
The main table is BASE_ENTITY, it stores all the basic properties of the view objects. For each particular type there is a table in which the remaining fields are stored. For example, for nodes it is BUS_ENTITY, for branches it is BRANCH_ENTITY. These granular tables have a one-to-one relationship with the BASE_ENTITY table. Data integrity is mainly controlled by referential integrity between tables. For example, deleting a view from a Gview table automatically deletes all objects belonging to it from the BASE_ENTITY table, and then details from tables of specific types are cascaded.
Block templates have a structure similar to views and are also stored in the GView table with the HIDDEN flag set. The internal objects of blocks are not saved in the file, they are completely constructed when created based on templates. Therefore, the settings of the internal objects of the block made by the scripts are lost when saving and loading.
Scenarios
Scenarios (scripts) control equipment signs and other elements of the circuit depending on the events coming from real equipment to the monitoring center. Depending on the events, scripts control visibility, flicker, color highlighting, output of data to additional information elements that are anchored to equipment signs, visibility of groups, individual elements, etc.
Scenarios are needed to fine-tune the visualization of CIM objects and to calculate the data displayed by fields and output blocks. The script module allows in real time to perform arbitrary calculations on graphical representation objects and entities associated with them, based on the received data to control the appearance and display the calculated data and telemetry data.
Thanks to scripts, it is possible to visualize different attributes of a graphic representation object in different ways, such as text, font, color, size and angle, and to arbitrarily control the visibility of representations.
Before placing an object on a graphical representation or when changing the properties of an entity associated with an object, the script module calls the script and passes the context of the object and its environment into it. The essence of the script is to set the visibility, configure the properties of the object transferred to processing or calculate the data displayed for the object. For example, based on the reliability of the data, you can change the color of the object or determine which additional fields should be shown, and then hide or show the fields or data blocks attached to the object.
Script execution
Script execution takes place in the context of the main thread of the application.
In order to improve performance, "lazy" execution is used, i.e. execution of the script is always delayed until the moment when its data is really needed. For example, the execution of scripts used to obtain text and other parameters of output fields is delayed until visualization. This means that if the view is attached to an invisible layer, or the value of the invisibility scale does not allow it to be seen, then the script that calculates the field will not be executed until the view becomes visible.
When changing entity data, all views bound to it are automatically updated; for this, scripts that depend on the entity data are re-executed. Those. if the script accesses the Entity context variable, then it is considered that the script depends on the entity, and it will be recounted.
When a user clicks or double-clicks the corresponding scripts from the current script profile are launched immediately.
In the process of executing the script, erroneous situations can occur that lead to the throwing of exceptions. Unhandled exceptions are displayed by the notification module in the form of pop-up notifications, and are also saved in the local user directory.
Common Modules
General modules are used to determine the code of program modules that are reusable by scripts of graphical representation.
In the "Modules" section of the "General Script Modules" dialog box, you can add, modify or delete script modules by clicking the appropriate buttons. When defining a general module, you must specify its name, by which it will be available from the script. In the right part of the dialog box, in the “Module” section, the source code of the module is set using the script editor. The created modules can be reused when defining the code of various scripts.
To use the code of common modules in scripts, you should use the following form of writing the script, and in the script header, using the definition of uses, list the plug-ins separated by commas.
{$MANUAL}
// Подключение общих модулей
uses 'common', 'math';
// Определение функции скрипта
function __f__: Variant;
begin
  // Вызов функции A() модуля ‘common’
  Result := A();
end;
Begin
end.
Script profiles
Script profiles allow you to create multiple sets of scripts that are called when the following graphical presentation events occur:
- changing entity data;
- single or double click on the graphic object;
- zooming in on a graphic representation.
When changing these entities, the text of the output fields and blocks associated with these entities is updated. To do this, the scripts contained in the data output fields are executed, which calculate the displayed text and specify the formatting.
With a single or double click on a graphic object, it may be useful to display some pop-up dialog containing details on the selected graphic object.
When you change the scale of the graphical representation, it may be useful to slightly increase or decrease the scale of the objects in the graphical representation, or hide unnecessary objects so as not to clutter up the screen.
The essence of presentation script profiles is to provide the ability to handle the events listed above in different ways, depending on the profile selected by the user. So you can create profiles that will adjust the colors of objects in different ways or calculate output data in different ways. In the ribbon menu of the graphical representation, the user can select the active script profile, on which the current behavior of the graphical representation will depend. When changing the profile, all entities of the graphical representation are processed by the script "Change Entities"; if the scenario is complex and there are many objects, then this may take some time.
You can select the active script profile using the drop-down list.
Script profile in the ribbon menu.
To add a new script profile, you need to click the "Add" button located under the list of profiles in the "Set up script profiles" dialog box and specify the name and description of the profile. After that, using the script editor, you can enter the profile code in the tabs:
- changing entity data;
- mouse click;
- double click of the mouse;
- zooming out.
Additional program features
Editing branches and primitives
The function of editing branches includes the ability to create break nodes on a branch and delete nodes. An orthogonal mode is also supported in which the branches are respectively aligned along the coordinate axes at right angles. Functionality for integrating equipment signs onto a branch and moving them along the branch is supported.
When editing primitives, you can draw arbitrary elements, such as broken poly-lines, circles, sectors, text blocks, etc.

Work with equipment signs
In the case of equipment signs, if placed on a branch, the function of reflecting the sign on the branch relative to the axis of the branch is included. The ability to change the sign of the equipment and change the script managing the sign. Both for ordinary characters and for characters on a branch, the anchor functions of additional controls are available, which can be controlled by a script and display additional information.
Object groups
Objects can be grouped and controlled by the visibility of groups from scripts. The appearance of the groups is determined by the specification of the CIM models. Groups can be nested within each other and automatically expand depending on the visible / invisible nested subgroups.
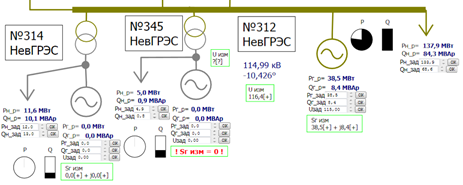
Data output unit
The “Data output block” tab allows you to configure a specific instance of the data output block, its position, the name of the block for use in scripts, and the coordinates relative to the object to which the output block is attached.
Block editing form

Example of outputting blocks in a diagram
Using layers
The layer mechanism allows you to optimize the number of visible objects depending on the scale, either on the script logic or manually.
Copying to the clipboard
The clipboard is multi-format and supports copying both in vector data format and in bitmap.
Printing
Both color printing and black and white are available. You can print any arbitrary area of the scheme.
Export to various formats
Export is available in various formats, both raster and vector (WMF, EMF, SVG).
Search
The function allows you to find the location of objects in the diagram using a fragment of text, with automatic positioning of the viewing area.
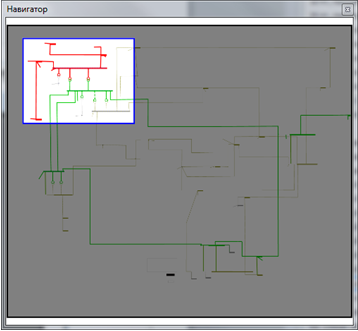
Navigator
The navigator window allows you to see a sketch of the entire scheme in a simplified form with the current viewing area displayed.
The equipment on which the software worked
The video card was specialized, which issued a resolution of 8192x3072, it did not have any accelerations, it supported everything only programmatically, to pull a large resolution on the screen in the monitoring center.
The objects in the frame are about 100 thousand.
FPS in area 1.
Description of the installation in the control center.
The large screen in the control center consists of 24 sections, 8 in width and 3 in height. Each section is a separate small screen with a resolution of 1024x1024 pixels. 24 projectors are installed on the back side, each shines on its own square.
On-screen scaling video fragment

More projects:
How to create software for the
SDK microtomograph for 5233 man-hours to implement support for e-books in the FB2 format
Managing access to electronic documents. From DefView to Vivaldi We
integrate two video surveillance systems: Axxon Next and SureView.
More about the development of software for X-ray tomograph
“Sphere”: how to monitor billions of kilowatt hours.
Developing a simple plug-in for JIRA to work with the database.
To help DevOps: firmware builder for network devices on Debian for 1008 hours
Auto-update Windows service through AWS for the poor