Measuring performance with BenchmarkDotNet
 Good afternoon. A week ago, for the third time, I used the library to create / launch the .NET BenchmarkDotNet benchmarks . The library turned out to be quite convenient, but practically not lit on the hub, which I will correct now.
By benchmark, I mean measuring the execution time of the method (s). First, imagine the process of writing a benchmark with your hands. We create a test method, select the Release build, create a “measuring” method, collect garbage in it, put StopWatch at the beginning and at the end, start warm-up, start the test method. If the test method is faster than one StopWatch tick, run the test method many times (let it be a million), divide the total time by a million, and get the result (remember to subtract the idle cycle time per million operations from the total time) .
As you can see, there are already a lot of details, and if you can still live with them, then with measurements the performance for different architectures (x86 \ x64) and different compilers, everything becomes really bad (about creating benchmarksand the details of microoptimization are described in detail by one of the authors of the library - Andrei DreamWalker Akinshin). As you might guess, BenchmarkDotNet takes care of these details.
Installation
Nuget package, no dependencies; at the time of publication of the article, version v0.9.1.
Simplest example
First of all, I checked the library for lice.
    public class TheEasiestBenchmark
    {
        [Benchmark(Description = "Summ100")]
        public int Test100()
        {
            return Enumerable.Range(1, 100).Sum();
        }
        [Benchmark(Description = "Summ200")]
        public int Test200()
        {
            return Enumerable.Range(1, 200).Sum();
        }
    }
    [TestClass]
    public class UnitTest1
    {
        [TestMethod]
        public void TestMethod1()
        {
            BenchmarkRunner.Run();
        }
    }
As you can see, for a simple start, it is enough to hang the [Benchmark (Description = "TestName")] attribute on the tested methods and run the code in the console or in the unit test. The requirements for the method are small: it must be public (otherwise there will be no measurements) and not accept arguments (otherwise we get an exception). After the benchmark is completed, a detailed test report will appear in the console, with a summary table at the end.
| Method | Median | Stddev |
|---|---|---|
| Summ100 | 1.0282 us | 0.1071 us |
| Summ200 | 1.9573 us | 0.0648 us |
By default, it indicates the method name, median, standard deviation. If you do not set the Description property in the [Benchmark] attribute in the Method column, the method name will be displayed. By the way, table rows are sorted according to the values of the Description property (method names). It is also worth noting that the exception uncaught in the method stops the measurement (specifically of this method).
To measure the performance of methods with arguments, you can create an additional “measuring” method:
private double SomeBusinessLogic(int arg){ ... }
[Benchmark(Description = "Summ100")]
public void MeasurmentMethod()
{
    SomeBusinessLogic(42);
}
Benchmark settings
Benchmarks are configured using the Config attribute. The possibilities are considerable: environment \ platform \ jitter settings, number of starts, output settings, loggers, analyzers ... Examples of settings can be found on the library page on github .
The easiest configuration option: we hang the Config attribute on the class containing Benchmark methods, and in the constructor we pass the line with the settings. So, if you want to see the maximum start time in the final table, we use the following code:
[Config("columns=Max")]
public class TheEasiestBenchmark
{
    [Benchmark(Description = "Summ100")]
    public int Test100()
    {
         return Enumerable.Range(1, 100).Sum();
    }
}
| Method | Median | Stddev | Max |
|---|---|---|---|
| Summ100 | 1.0069 us | 0.0124 us | 1.0441 us |
Another option is to create a derived class from ManualConfig, and pass its type to the Config attribute constructor.
[Config(typeof(HabrExampleConfig))]
public class TheEasiestBenchmark
{
    private class HabrExampleConfig : ManualConfig
    {
        public HabrExampleConfig()
        {
            Add(StatisticColumn.Max); // Добавляем необходимую колонку
        }
    }
    [Benchmark(Description = "Summ100")]
    public int Test100()
    {
        return Enumerable.Range(1, 100).Sum();
    }
}
| Method | Median | Stddev | Max |
|---|---|---|---|
| Summ100 | 1.0114 us | 0.0041 us | 1.0201 us |
On the one hand, more code, on the other hand, when creating a class, autocompletion works: it’s easier to configure, more difficult to make mistakes.
A little bit about the settings
There are a lot of settings, and they are divided by type.
The first type of settings is Job. As follows from the documentation, you need to configure the environment: the expected platform (x64 \ x86), jitter, runtime. In addition, if you are not satisfied with the test run time (the library tries to select the accuracy / start time that is optimal according to the criteria), you can configure the number of warm-up and target runs, or simply specify the desired run time. In addition, you need to be careful with the environment settings: if the class is in a project oriented to .NET 4.6, and the config is configured to .NET 4.5, we will get an error during the startup process (which, in general, is logical).
The following type of settings: the already familiar Columns. Allows you to configure the displayed information. A complete list of available columns is available in the Columns -> default section of the documentation.. Mostly used columns like PropertyColumn. * (E.g. PropertyColumn.Runtime), StatisticColumn. * (E.g. StatisticColumn.Median).
Another setting item: Exporters. Indicates which additional results files to generate. Possible files: html, txt, csv, R plots, markdown markup for SO, github. So, to create R charts and a csv document, add Add (RPlotExporter.Default, CsvExporter.Default) to the MyConfig constructor;
A class with all these settings might look like this:
internal class HabrExampleConfig : ManualConfig
{
	public HabrExampleConfig ()
	{
		Add(new Job {IterationTime = 1,WarmupCount = 1,TargetCount = 1});
		Add(StatisticColumn.Max);
		Add(RPlotExporter.Default, CsvExporter.Default);
	}
}
[Config(typeof(HabrExampleConfig ))]
public class TheEasiestBenchmark{...}
Almost also the result of another configuration method looks like creating your own configuration attribute.
    [MyConfigSource]
    public class TheEasiestBenchmark
    {
        private class MyConfigSourceAttribute : Attribute, IConfigSource
        {
            public IConfig Config { get; private set; }
            public MyConfigSourceAttribute()
            {
                Config = ManualConfig.CreateEmpty()
                    .With(StatisticColumn.Max)
                    .With(new Job {Platform = Platform.X64})
                    .With(RPlotExporter.Default);
            }
        }
        [Benchmark(Description = "Summ100")]
        public int Test100()
        {
            return Enumerable.Range(1, 100).Sum();
        }
    }
It should be noted that all three configuration methods only add something to the basic configuration. So, the three base columns Method \ Median \ StdDev will always be displayed on the console.
If you want to limit the output (and the generation of the resulting files), you can use the UnionRule property.
    [Config(typeof(HabrExampleConfig))]
    public class TheEasiestBenchmark
    {
        private class HabrExampleConfig : ManualConfig
        {
            public HabrExampleConfig()
            {
    	        Add(PropertyColumn.Method, StatisticColumn.Max); // Выводим лишь имя и максимальное время
                Add(ConsoleLogger.Default); // Добавляем вывод на консоль
                UnionRule = ConfigUnionRule.AlwaysUseLocal; // Отказываемся от стандартного конфига
            }
        }
        [Benchmark(Description = "Summ100")]
        public int Test100()
        {
            return Enumerable.Range(1, 100).Sum();
        }
    }
| Method | Max |
|---|---|
| Summ100 | 1.0308 us |
This approach is useful for those who want to configure the launch of benchmarks in the CI process, because additional generated files with the results are likely to be superfluous.
Additional features
Parameterized Tests
If you want to experimentally verify the complexity of the algorithm, or just have an idea of the speed of the method with various arguments, you can use the Params attribute.
So, we can measure the speed of counting the inclusions of the character 'a' in various lines:
        [Params("habrahabr", "geektimes", "toster", "megamozg")]
        public string arg;
        [Benchmark(Description = "Test")]
        public int CountLetterAIncludings()
        {
            int res = 0;
            for (int i = 0; i < arg.Length; i++)
            {
                if (arg[i] == 'a'){res++;}
            }
            return res;
        }
| Method | Median | Stddev | arg |
|---|---|---|---|
| Test | 112.4087 ns | 1.1556 ns | geektimes |
| Test | 113.0916 ns | 1.4137 ns | habrahabr |
| Test | 104.3207 ns | 4.2854 ns | megamozg |
| Test | 80.3665 ns | 0.4564 ns | toster |
Relative start time
Suppose we want to know not only the absolute times of the test methods, but also the relative. To do this, select a method whose time is considered “normal” and change its Benchmark attribute by setting BaseLine to true.
        [Benchmark(Description = "Summ100")]
        public int Test100()
        {
            return Enumerable.Range(1, 100).Sum();
        }
        [Benchmark(Description = "Summ200", Baseline = true)]
        public int Test200()
        {
            return Enumerable.Range(1, 200).Sum();
        }
| Method | Median | Stddev | Scaled |
|---|---|---|---|
| Summ100 | 1.0113 us | 0.0055 us | 0.52 |
| Summ200 | 1.9516 us | 0.0120 us | 1.00 |
Results Processing
If there is a desire / need to somehow distort statistics, or if you want to write your Exporter, the Summary class is at your service. Run the test in a unit test
Summary result = BenchmarkRunner.Run();
and use all the information about each benchmark
result.Benchmarks [index] contains information about Job'e and parameters, result.Reports [index] stores data about the time of the test run and its type (warm-up / battle).
In addition, as I wrote above, the library allows you to save test results in html, csv, txt formats, and also supports saving in markdown markup and formed in R png-images. So, all the test results in this article are copied from the generated html files.
Sample Pictures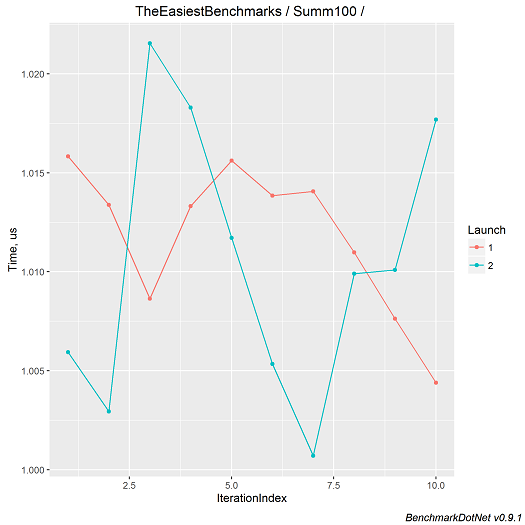
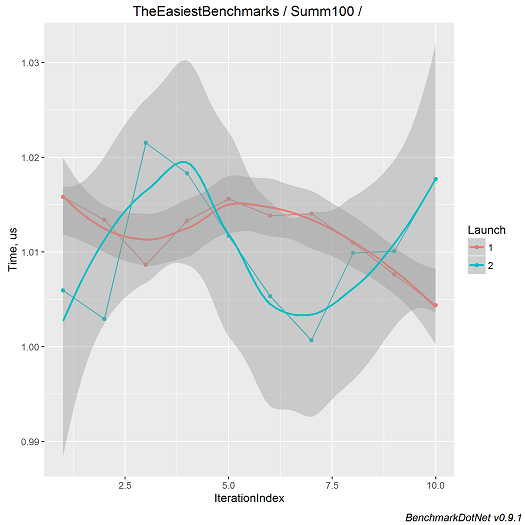
To summarize the above, BenchmarkDotNet takes upon itself the routine of compiling benchmarks and provides decent formatting results with minimal effort. So, if you want to quickly measure the speed of a method, get accurate results for methods with a short lead time, or get a beautiful schedule for management - you already know what to do. :)