September 16, 2015 at 12:17
Using QCustomPlot to Create Animated Charts

When solving various analytical problems, real-time graphing may be required, where the function depends on time. In this article I will share my experience in solving the problem of animating graphs in Qt using QCustomPlot.
Used tools
- Qt Creator 5.5.0
- QCustomPlot 1.3.1
Briefly about QCustomPlot
The graphs are drawn after calling the replot () method (manually, or when the event is triggered). For rendering, this widget requires 2 data arrays containing the value of the argument (x) and the value of the function at this point (y).
Chart creation
See more in the official. tutorial on the QCustomPlot website
To illustrate this, create a graph whose argument is the time in ms.
QVector x(100), y(100);
for(int i = 0; i < 100; i++)
{
   x[i] = 100*i
   y[i] = x[i];
}
Create a graph that we will animate later:
customplot->addGraph();
And we will give it vectors with input data:
customplot->graph(0)->setData(x,y);
Set the visible part of the graph equal to (0; 10000) in x, and (0; 10000) in y, so that the entire graph is visible:
customplot->xAxis->setRange(0, 10000);
customplot->yAxis->setRange(0, 10000);
It remains to call replot:
customplot->replot();
This should look like our schedule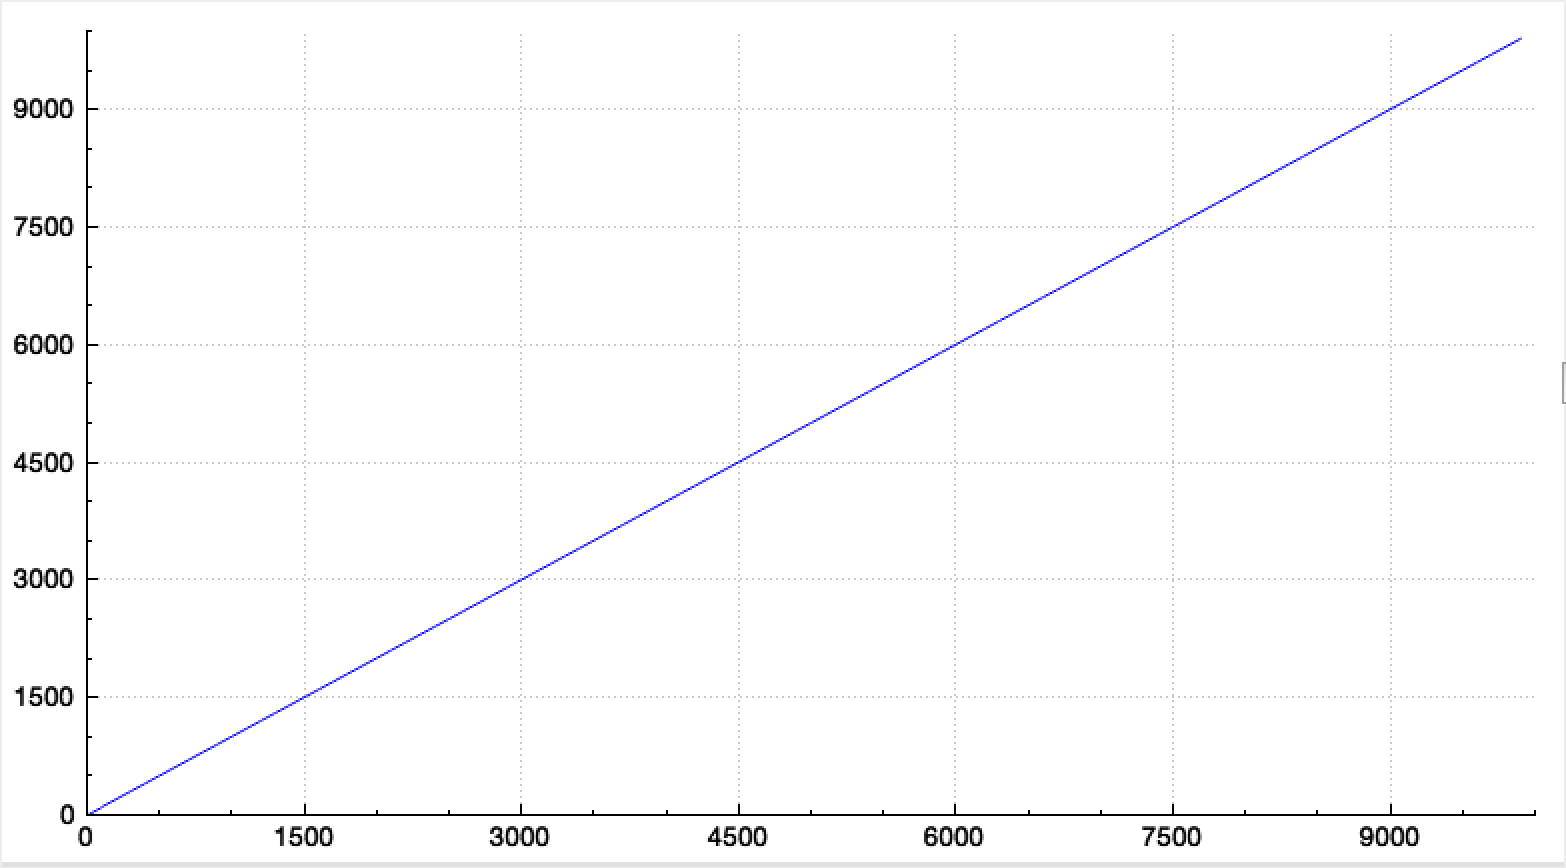
Done! It remains only to directly make him consistently "draw".
Animation
For animation, we will create a QTimer that will signal timeout () and call a function to draw the next value.
We also need a global variable that will store data about the elapsed time since the start of rendering, as well as 2 additional arrays for storing x, y, the purpose of which will be shown below.
int TimeElapsed = 0;
QVector x2, y2;
...
QTimer* playBackTimer = new QTimer(this); //создание экземпляра таймера
connect(playBackTimer, SIGNAL(timeout()), this, SLOT(PlaybackStep())); //привязка события к функции PlaybackStep()
QTimer works in such a way that after calling QTimer-> start (int d) after d milliseconds, it signals timeout (), after which it starts again until it is stopped by QTimer-> stop (). To get a fairly smooth picture, set d = 50 (20 fps).
playBackTimer->start(50);
And now we will pass directly to the implementation of the event processing function from the timer:
void PlaybackStep()
{
    TimeElapsed+=50; // 50 - частота срабатывания таймера (в мс)
    for(int i = 0; i < x.size(); i++)
    {
            if(TimeElapsed >= x[i])
            {
                x2.push_back(x[i]);
                y2.push_back(y[i]);
                x.pop_front();
                y.pop_front();
                i = 0; // если во временном промежутке несколько подходящих "точек", то после pop_front() мы можем
                // упустить одну. i = 0 запускает заново цикл, чтобы ничего "не потерять"
            }
    }
    customplot->graph(0)->setData(x2, y2);
    //end of playback check
    if(x.size() == 0) playBackTimer->stop();
    //
    customplot->replot();
}
The animation mechanism is such that on each signal from the timer we take elements smaller or equal in value of the variable that stores the number of elapsed milliseconds.
Also, in order not to run through the entire array of input data each time, after adding them to the new x2, y2 arrays, we delete them using pop_front ().
On each “frame” we update the graph data by calling setData (x2, y2), and also request a qcustomplot redraw.
Ready animation example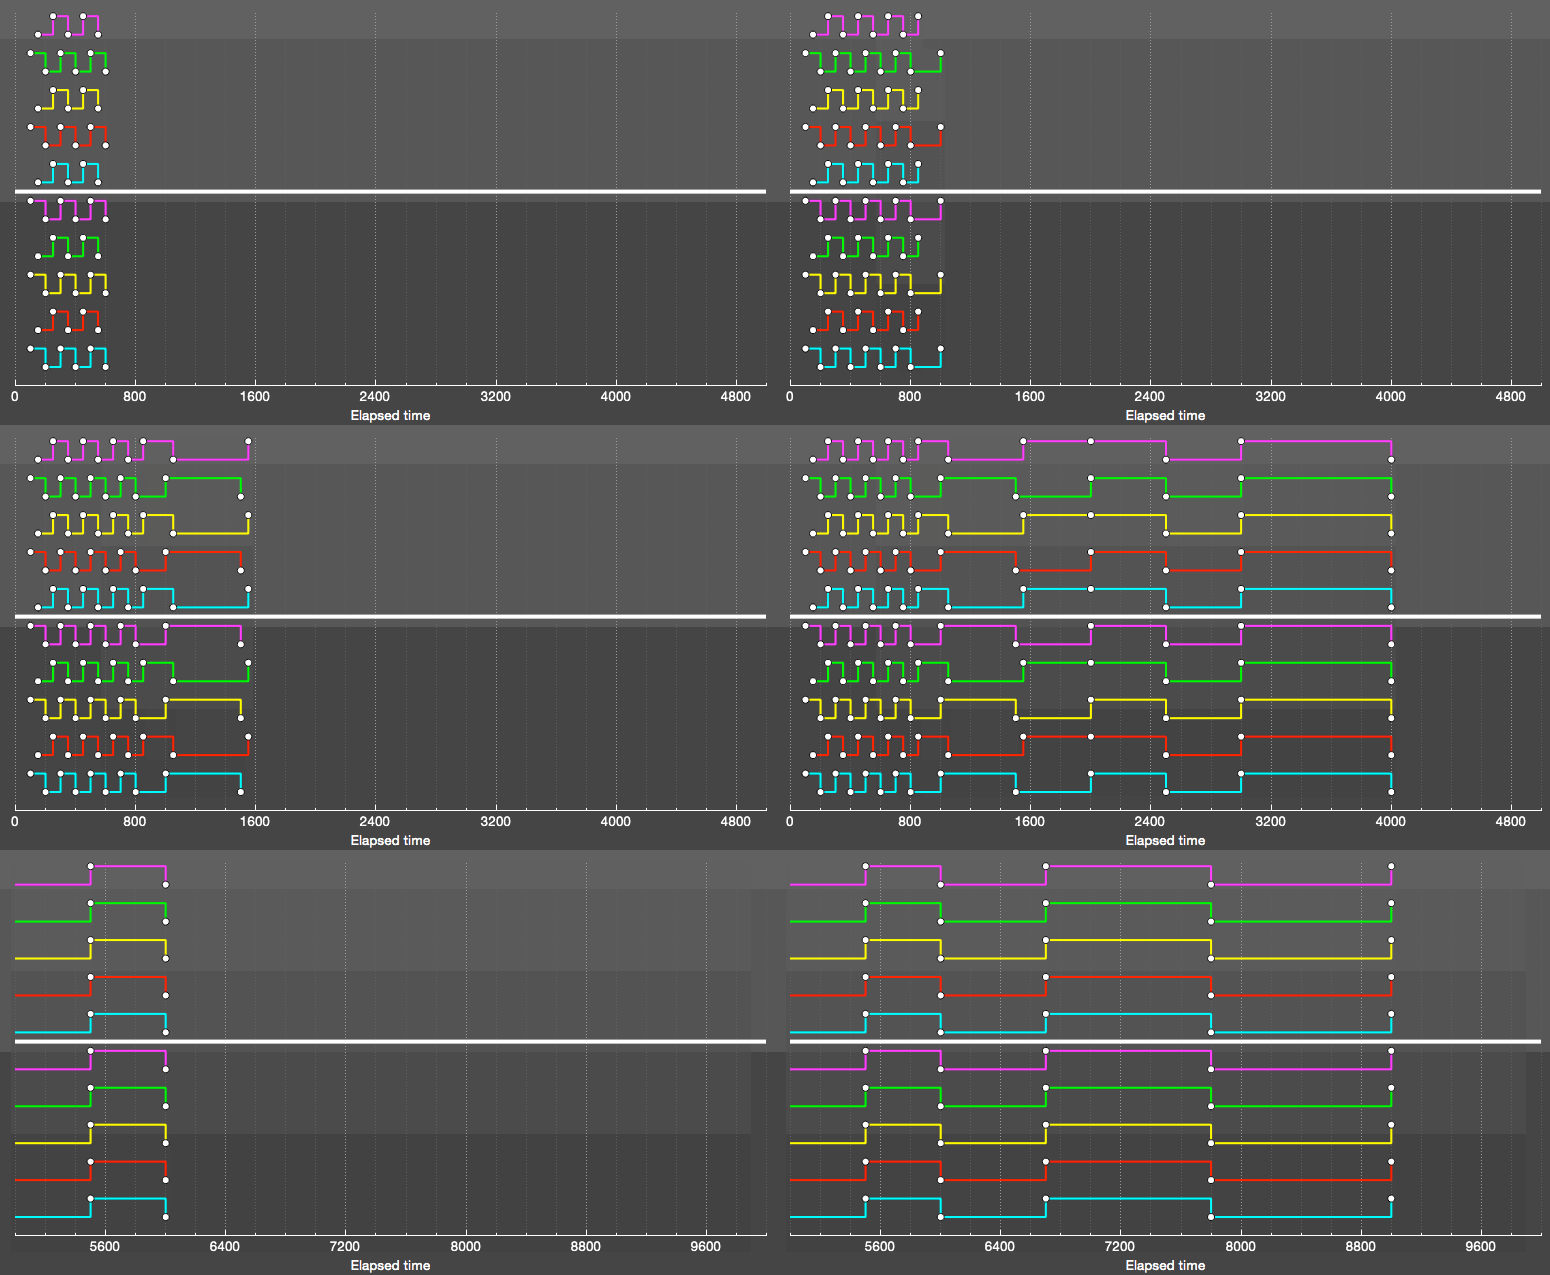
This example is taken from a project under development.
This example is taken from a project under development.
I would like to add that, although it might seem, replot () is an expensive enough function to call it 20+ times per second, I measured the plot rendering speed. If there are 10 schedules, 20-30 values of which are on the screen, the execution time of replot () did not exceed 1 ms, and the time spent on the entire PlaybackStep function was less than 10 ms, which theoretically allows updating the schedule with a frequency of ~ 100 fps.
PS This example is suitable for realtime rendering, where the argument to the graph function is the time. However, the same mechanism can be adapted for rendering any other graphs, where there is no time dependence.
UPD Added example of animated graphs (gif).