MPI + OpenMP Hybrid Cluster Profiling

Libraries implementing the MPI standard (Message Passing Interface) are the most popular mechanism for organizing computations on a cluster. MPI allows you to transfer messages between nodes (servers), but no one bothers to run several MPI processes on one node, realizing the potential of several cores. So often HPC applications are written, it's easier. And while the number of cores on one node was small, there were no problems with a “clean MPI” approach. But today, the number of cores goes to tens, or even hundreds, for Intel Xeon-Phi co-processors. And in such a situation, running dozens of processes on one machine becomes not entirely effective.
The fact is that MPI processes communicate through a network interface (albeit implemented through shared memory on one machine). This entails redundant copying of data across multiple buffers and increased memory consumption.
For parallel computing within the same machine with shared memory, threads and the distribution of tasks between them are much better suited. Here, the most popular in the world of HPC is the OpenMP standard.
It would seem - well, we use OpenMP inside the node, and MPI for inter-node communications. But not so simple. Using two frameworks (MPI and OpenMP) instead of one not only brings additional programming complexity, but also does not always give the desired performance boost - at least not immediately. It is still necessary to decide how to distribute computing between MPI and OpenMP, and, possibly, to solve problems specific to each level.
In this article I will not describe the creation of hybrid applications - information is not difficult to find. We will look at how you can analyze hybrid applications using the Intel Parallel Studio tools, choosing the optimal configuration and eliminating bottlenecks at different levels.
For tests we will use NASA Parallel Benchmark:
- CPU: Intel Xeon processor E5-2697 v2 @ 2.70GHz, 2 sockets, 12 cores in each.
- OS: RHEL 7.0 x64
- Intel Parallel Studio XE 2016 Cluster Edition
- Compiler: Intel Compiler 16.0
- MPI: Intel MPI library 5.1.1.109
- Workload: NPB 3.3.1, “CG - Conjugate Gradient, irregular memory access and communication” module, class B
The benchmark is already implemented as a hybrid and allows you to configure the number of MPI processes and OpenMP streams. It is clear that there is no alternative to MPI for inter-node communications (as part of our application). The intrigue is that running on a single node - MPI or OpenMP.
MPI Performance Snapshot
We have 24 cores at our disposal. Let's start with the traditional approach - only MPI. 24 MPI process, 1 thread each. To analyze the program, we will use the new tool released in the latest version of Intel Parallel Studio - MPI Performance Snapshot. Just add the “-mps” switch to the mpirun launch line:
source /opt/intel/vtune_amplifier_xe/amplxe-vars.sh
source /opt/intel/itac/9.1.1.017/intel64/bin/mpsvars.sh --vtune
mpirun -mps –n 24 ./bt-mz.B.24
mps -g stats.txt app_stat.txt _mps
The first two lines set the desired environment, the third starts the program with MPS profiling. The last line generates a report in html format. Without -g, the report will be displayed on the console - it’s convenient to view it directly on the cluster, but it’s more beautiful in HTML:

MPS gives a top-level performance rating. The overhead of running it is extremely small, you can quickly evaluate the application even on a large scale (32,000 processes tested).
To get started, look at the shares of MPI time and Computation time. We spend 32% of the time on MPI, almost all because of the imbalance of the load - some processes are waiting for others to consider. In the blocks on the right there is an estimate - MPI time is marked HIGH - too much wasted on communication. There is also a reference to another tool - Intel Trace Analyzer and Collector (ITAC), for a detailed analysis of MPI problems. About OpenMP, no problems were highlighted, which is not surprising, because we actually turned it off.
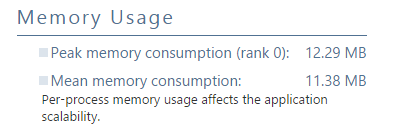
MPS also considers hardware performance metrics: GFPLOS, CPI, and the “Memory Bound” metric — an overall assessment of memory performance. And also memory consumption (for one MPI process) - maximum and average.
Intel Trace Analyzer and Collector
MPS showed that the main problem is the “24x1” configuration in MPI. To find out the reasons, we collect the ITAC profile:
source /opt/intel/itac/9.1.1.017/intel64/bin/itacvars.sh
mpirun -trace -n 24 ./bt-mz.B.24
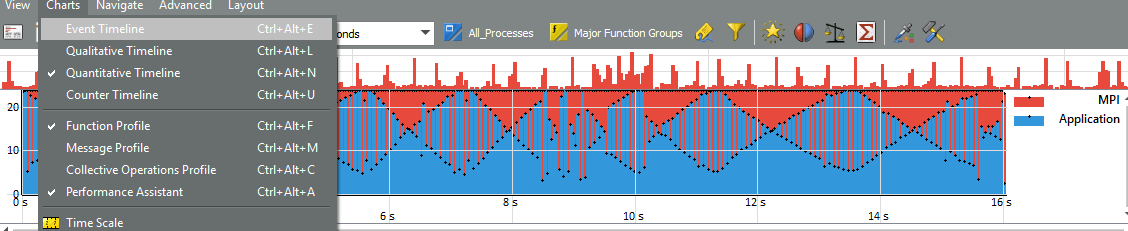
We open the track in the ITAC GUI - I used the Windows version. The Quantitative Timeline graph clearly shows that the proportion of MPI is large, and communications are distributed with some cyclicality. The topmost graph shows the periodic bursts of MPI activity:
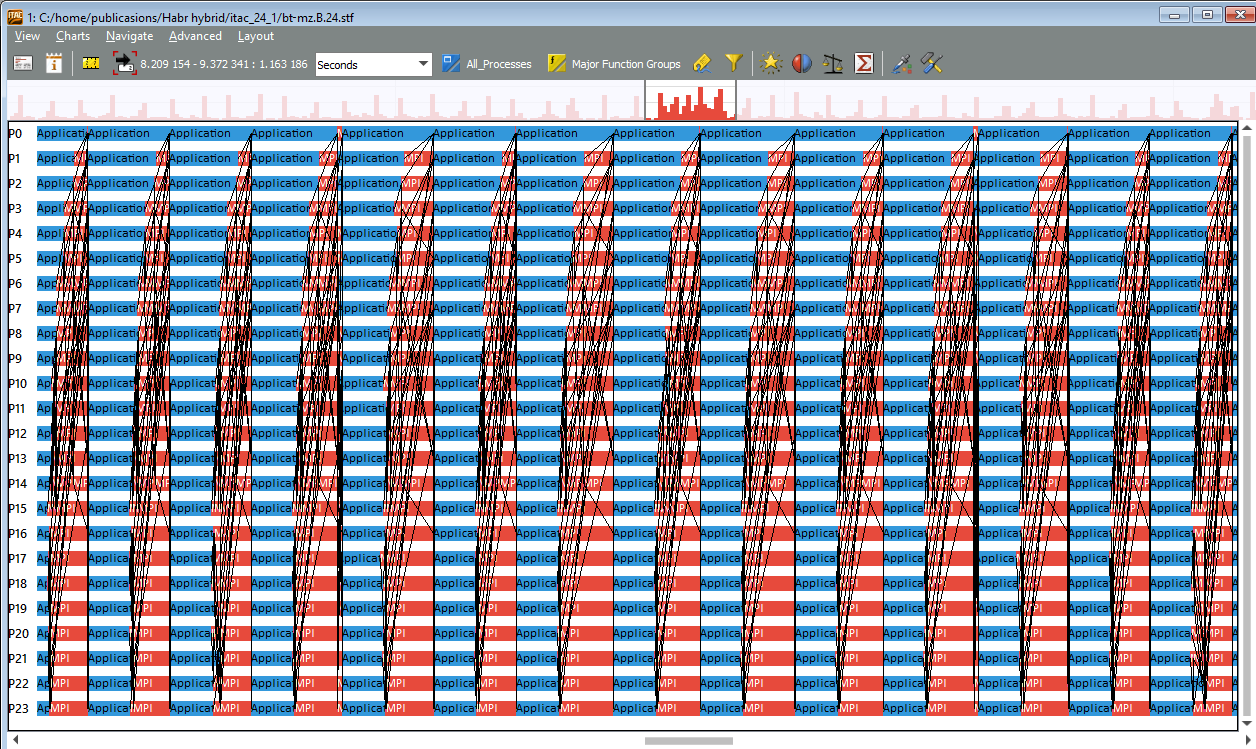
If you select several of these bursts on the Event Timeline, you can see that the communications are not evenly distributed. Processes with ranks 0-4 count more, and with ranks 15-23 more are expected. The load imbalance is evident:
On the Message Profile graph, you can evaluate which processes are exchanging messages and where the communication is the longest:
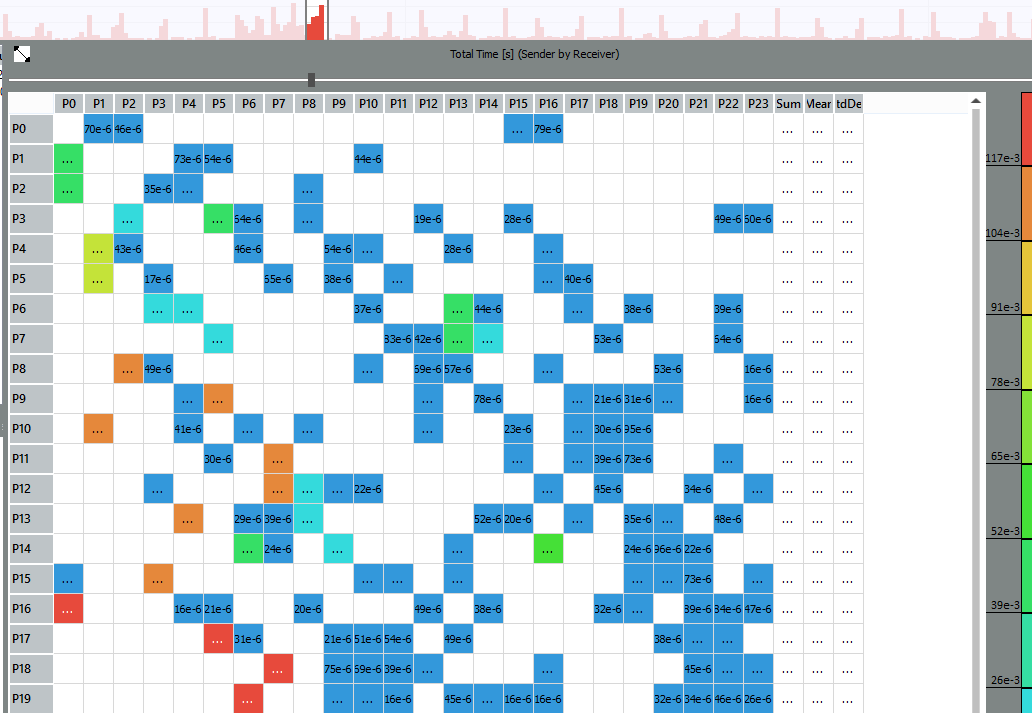
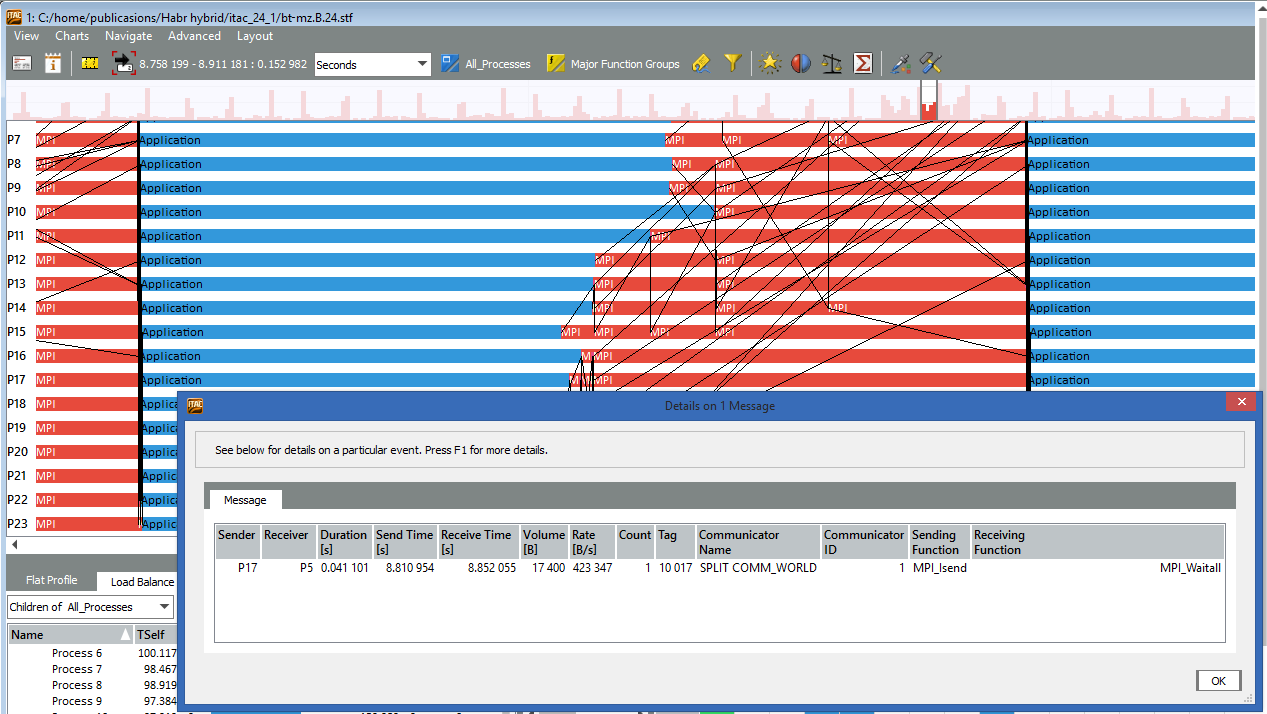
For example, messages between processes with ranks 17 and 5, 16 and 0, 18 and 7, etc. last longer than others. Having increased the Event Timeline even more strongly, you can click on the black line at rank 17 and see the details of forwarding - from whom to whom, message size, send and receive calls:
The Performance Assistant panel describes specific problems found by the tool in the selected region. For example, “late sending”: The
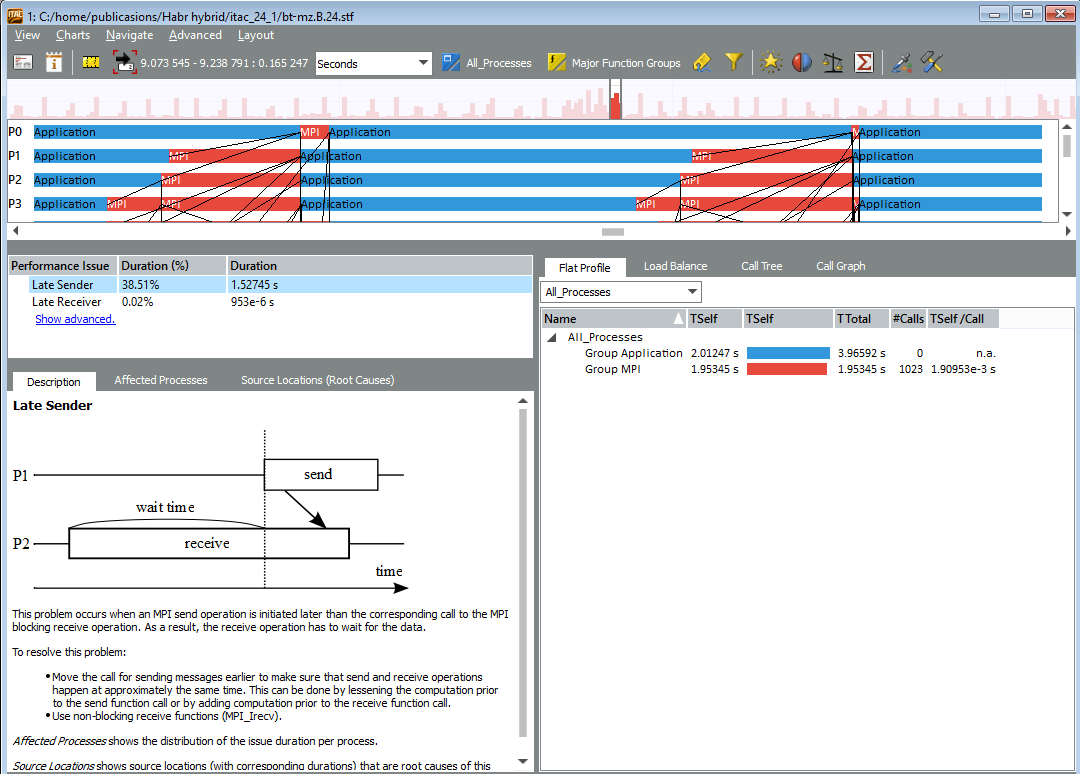
imbalance in MPI can be caused not only by flaws in the communication scheme, but also by problems in useful calculations - when some processes are considered slower than others. If we are interested in what this application is wasting time inside of one of the processes, and what could be the problem, ITAC can generate a command line to launch Intel VTune Amplifier for this rank (for example, on the 2nd):

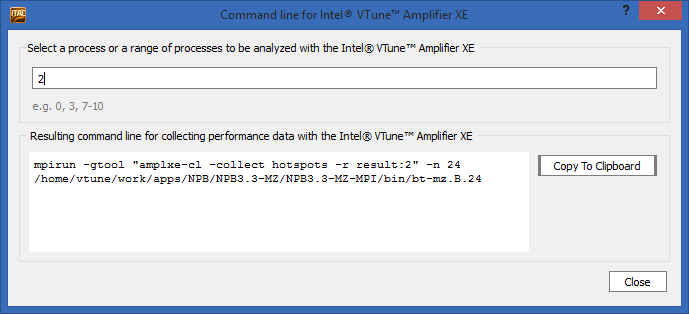
But we will return to VTune Amplifier later. Anyway, ITAC provides a lot of opportunities for a detailed study of MPI communications, but our task now is to choose the optimal balance between OpenMP and MPI. And for this, it is not necessary to immediately correct MPI communications at 24 ranks - you can try other options first.
Other options
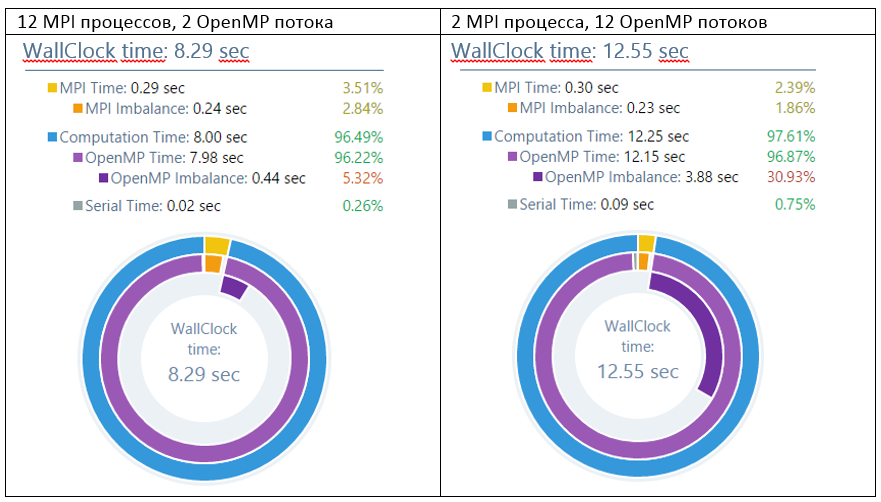

So, empirically, it turned out that the 12x4 and 6x4 distributions work better than others. Even 2 OpenMP streams per process are significantly faster than 2 MPI processes. However, with an increase in the number of threads, the operating time begins to grow again: 2x12 is even worse than “pure MPI”, and 1x24 does not even make sense. And the fault is the imbalance of work, which is poorly distributed over a large number of OpenMP streams. Option 2x12 has as much as 30% imbalance.
Here we may well stop, because the compromise reached 12x4 or 6x4 is quite acceptable. But you can dig deeper - to investigate what the problem is with OpenMP scaling.
VTune Amplifier
For a detailed analysis of OpenMP problems, Intel VTune Amplifier XE is perfect, which we already wrote about in detail.
source /opt/intel/vtune_amplifier_xe/amplxe-vars.sh
mpirun -gtool "amplxe-cl -c advanced_hotspots -r my_result:1" -n 24 ./bt-mz.B.24
To run analyzers such as VTune Amplifier and Intel Advisor XE, it became very convenient to use the gtool option syntax (only in Intel MPI). It is embedded in the launch line of the MPI application, allowing you to run analysis only on selected processes — in our example, only for rank 1.
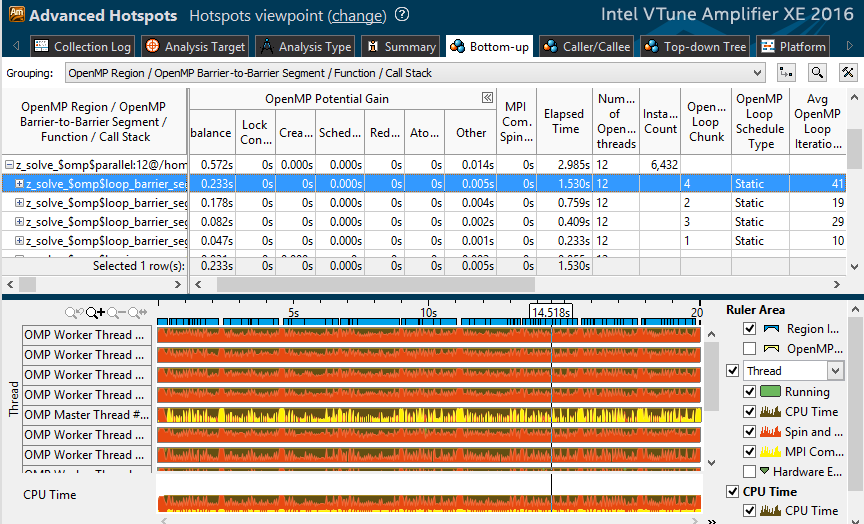
Let's look at the profile of the option “2 MPI processes, 12 OpenMP streams”. In one of the most expensive parallel loops, 0.23 seconds out of 1.5 goes into imbalance. Further in the table it can be seen that the type of scheduling is static, redistribution of work does not occur. In addition, there are 41 iterations in the loop, and 10-20 iterations in adjacent loops. Those. with 12 threads, each will get only 3-4 iterations. Apparently, this is not enough for an effective load balance.
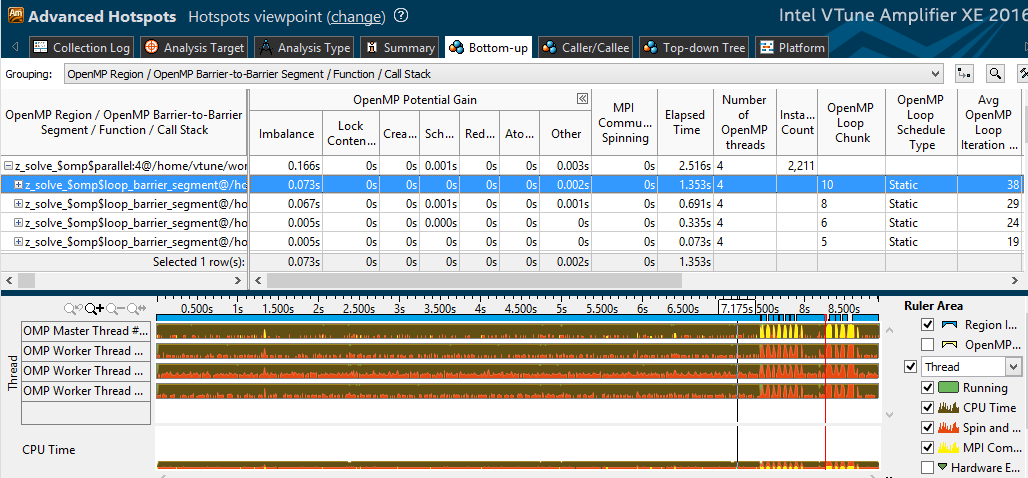
With 2-4 threads, each of them gets more work, and the relative time of active waiting caused by an imbalance is reduced. This is confirmed by the “6x4” profile - imbalance is much lower:
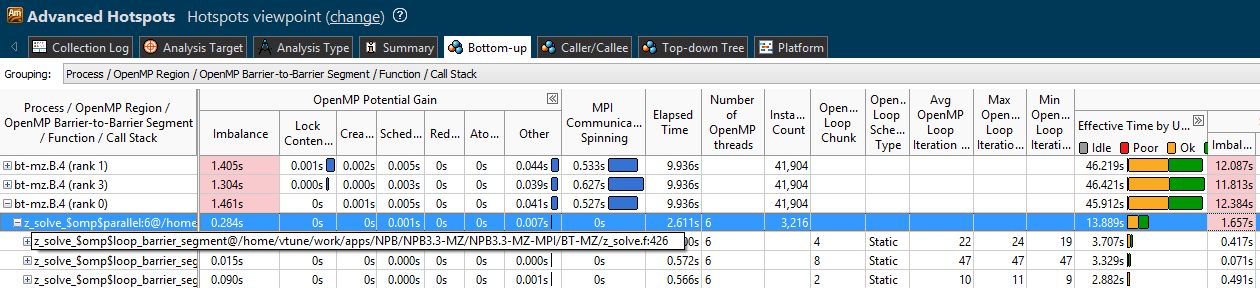
In addition, in the Intel VTune Amplifier 2016, MPI time appeared - the “MPI Communication Spinning” column and yellow markings on the timeline. You can run the VTune profile for several processes on one node at once, and observe MPI spinning along with OpenMP metrics in each of them:

Intel Advisor XE
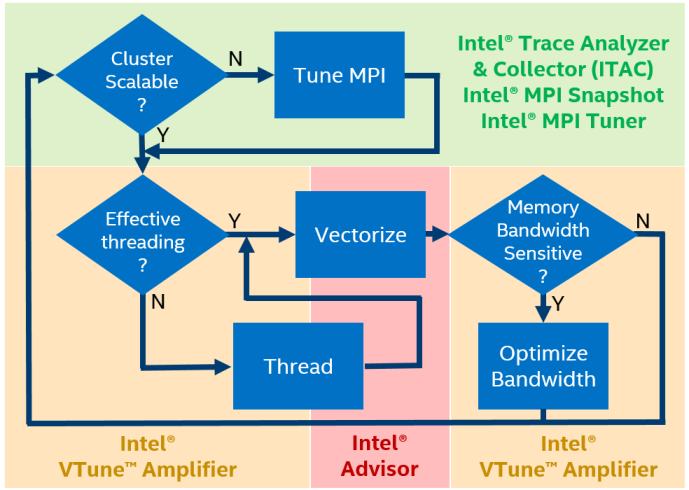
Going down the levels of parallelism, from the cluster scale (MPI), to the flows of one node (OpenMP), we get to parallelism according to the data inside the same flow - vectorization based on SIMD instructions. Here, too, there can be serious potential for optimization, however, it was not in vain that we got to it last - we first need to solve problems at the MPI and OpenMP levels, because there could potentially be more to win. There were two posts about Advisor not so long ago ( first and second ), so here I will limit myself to the launch line:
source /opt/intel/advisor_xe/advixe-vars.sh
mpirun -gtool "advixe-cl -collect survey --project-dir ./my_proj:1" -n 2 ./bt-mz.2
Next, we analyze the vectorization of the code, as we wrote earlier. Advisor is an important part of the ecosystem analysis cluster MPI programs. In addition to deeply exploring code vectorization, Advisor helps prototype multi-threaded execution and validates memory access patterns.
Summary
Intel Parallel Studio offers four tools for analyzing the performance of hybrid HPC applications:
- MPI Performance Snapshot (cluster level) - quick performance assessment, minimal overhead, profiling up to 32000 MPI processes, quick assessment of the imbalance of MPI and OpenMP, general performance assessment (GFLOPS, CPI).
- Intel Trace Analyzer and Collector (cluster level) - a detailed study of MPI, identification of communication patterns, localization of specific bottlenecks.
- Intel VTune Amplifier XE (single-node level) - a detailed profile with source code and stacks, imbalances and other problems of OpenMP, analysis of cache and memory usage and much more.
- Intel Advisor XE (single-node level) - analysis of the use of vector instructions and identifying the reasons for their inefficiency, prototyping multi-threaded execution, analysis of memory access patterns.