August 3, 2015 at 20:08
Familiarity with the internal device. NET Framework. Let's see how the CLR creates objects
- Transfer
The attention of readers of “Habrahabr” is a translation of an article by Khan Kommalapati and Tom Christian about the internal structure of .NET. There is an alternative translation option on the Microsoft website .
The article discusses:
Used technologies: .NET Framework, C #
The common runtime (CLR) is becoming (or has already become) the main infrastructure for building applications on Windows, so having a deep understanding of its internal structure will help to create efficient industrial-grade applications.
In this article, we will explore the internal structure of the CLR, including the layout of the object instance, the layout of the method table, the distribution of methods, front-end distribution, and various data structures.
We will use very simple fragments of C # code, any implicit use of the syntax of a programming language implies C #. Some of the data structures and algorithms discussed will be changed in future versions of the Microsoft® .NET Framework, but the conceptual framework will remain the same. We will use the Visual Studio® .NET 2003 debugger and the Son of Strike (SOS) debugging extension to view the data structures discussed in this article. SOS downloads internal CLR data, and allows you to view, save information of interest. See the procedure for loading SOS.dll into the debugger process at the appropriate sources.
See the "Son of Strike" sidebar for loading SOS.dll into the Visual Studio .NET 2003 debugger process.
In this article, we will describe classes corresponding to implementations in the Shared Source CLI (SSCLI).
The table in Figure 1 will help in examining the megabytes of code in SSCLI while searching for the necessary structures.
A moment that we should pay attention to before we go further - the information provided in this article is valid only for the .NET Framework 1.1 (it also mostly corresponds to Shared Source CLI 1.0, taking into account a number of notable exceptions present in various interaction scenarios) when performance on the x86 platform. The information is changed in future versions of the .NET Framework, so please do not build your applications with absolute links to these internal structures.
Before starting the first line of managed code, three application domains are created. Two of them are not available in managed code and are not even visible to the CLR host. They can only be created by loading the CLR provided by the mscoree.dll and mscorwks.dll buses (or mscorsvr.dll for multiprocessor systems). As you can see in Figure 2, this is a system domain and a shared (common) domain; they can exist in only one instance. The third domain is default, only an instance of this application domain has a name. For a simple CLR host, such as a console application, the default application domain name contains the name of the executable image. Additional domains can be created from managed code using the AppDomain.CreateDomain method or from an unmanaged code host using the ICORRuntimeHost interface.
Complex hosts such as ASP.NET create the required number of domains, in accordance with the number of applications running in the served Web site.
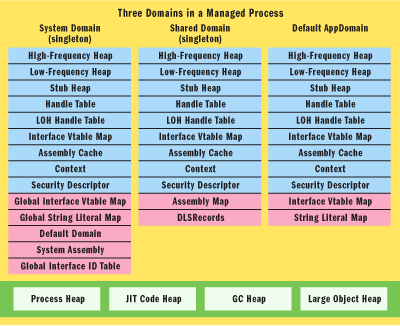
Figure 2. Domains created by the CLR loader
The system domain creates and initializes the shared domain (SharedDomain) and the default domain (Default). It also downloads the mscorlib.dll system library to the shared domain.
The system domain also contains string constants available within the process boundaries, interned explicitly or implicitly.
String interning is an optimization feature that is a bit totalitarian in the .NET Framework 1.1, since the CLR does not allow assemblies to optimize this functionality. At the same time, memory is used to store only one string instance for all string literals in all application domains.
The system domain also serves to generate interface identifiers within the process boundaries that are used to create the interface map (InterfaceVtableMaps) in each application domain (AppDomain).
The system domain traces all domains in the process and provides functionality for loading and unloading application domains.
All domain-neutral code is uploaded to the shared domain. Mscorlib, a system library, is required for user code in all application domains (AppDomains). This library is automatically uploaded to the shared domain. Basic types from the System namespace, such as Object, ValueType, Array, Enum, String and Delegate, are preloaded into this domain during the CLR bootloader loading process. User code can also be uploaded to this domain by setting the LoaderOptimization attributes by the application host CLR during a call to CorBindToRuntimeEx. The console application can upload code to the shared domain by adding the System.LoaderOptimizationAttribute attribute to the application’s Main method. The shared domain also manages the assembly map, indexed relative to the base address, the map acts as a reference table for managing the general dependencies of assemblies loaded in the default domain and other application domains created in managed code. The default domain is used only for downloading the user's private code, which should not be accessible to other applications.
The default domain is an instance of the application domain, where the application code is usually executed. While some applications require additional application domains to be created at runtime (such as have a plugin architecture or applications that generate a significant amount of code at runtime), most applications create one domain at runtime. All code running in this domain is contextually restricted at the domain level. If several application domains are created in the application, any cross-domain access will occur through the .NET Remoting proxy. Additional intra-domain boundaries can be created using types inherited from System.ContextBoundObject.
Each application domain has its own SecurityDescriptor, SecurityContext and DefaultContext, as well as its own heap loader (High-Frequency Heap, Low-Frequency Heap, and Stub Heap),
Handle Table, Large Object Heap Handle Table, Vtable and assembly cache.
LoaderHeaps are designed to load various CLR runtime artifacts and optimization artifacts that have existed over the entire lifetime of the domain. These heaps are increased by predictable fragments to minimize fragmentation. The loader heap differs from the garbage collector (GC) heap (or heap set in the case of symmetrical SMP multiprocessors) in that the garbage collector heap contains object instances, and the loader heap contains system types. Frequently requested structures such as method tables, method descriptors (MethodDescs), field descriptors (FieldDescs), and an interface map are located in the heap of frequent access (HighFrequencyHeap). Structures to which calls are more rare, such as EEClass and the class loader (ClassLoader), as well as their service tables, are located in a heap with a low hit rate (LowFrequencyHeap). The service heap (StubHeap) contains blocks that provide support for access security in code code access security (CAS), the shell COM calls and P / Invoke calls. Having examined the domains and heaps of the bootloaders at a high level, now let's look at their physical organization more closely in the context of the simple application in Figure 3. We will stop the program execution on “mc.Method1 ();” and create a domain dump using the extended DumpDomain SOS debugger command. Below is the result: Now let's look at their physical organization more closely in the context of the simple application in Figure 3. Stop the program execution on “mc.Method1 ();” and create a domain dump using the extended DumpDomain SOS debugger command. Below is the result: Now let's look at their physical organization more closely in the context of the simple application in Figure 3. Stop the program execution on “mc.Method1 ();” and create a domain dump using the extended DumpDomain SOS debugger command. Below is the result:
Our console application, Sample1.exe, is uploaded to the application domain (AppDomain), which has the name “Sample1.exe”. Mscorlib.dll is loaded into the shared domain (SharedDomain), but also appears in the system domain (SystemDomain) as the kernel system library. A high-frequency access heap (HighFrequencyHeap), a low-frequency access heap (LowFrequencyHeap), and a stub heap (StubHeap) are located in each domain. The system domain and the shared domain use the same class loader (ClassLoader), while the default domain (Default AppDomain) uses its own.
The result of the command does not display the reserved and used size of the loader heaps. The high-frequency access heap initially reserves 32Kb and uses 4Kb.
The low-frequency access heap stub heaps initially reserve 8Kb and occupy 4Kb.
Also, a heap of an interface map is not shown (InterfaceVtableMap, hereinafter IVMap) Each domain has an interface map, which is created on its own loader heap during the domain initialization phase. A bunch of interface cards (IVMap) reserves 4KB and takes up 4KB initially. We will discuss the significance of the interface map when we examine the type layout in the following sections.
Figure 2 shows the default process heap, the runtime compiler heap (JIT Code), the garbage collector (GC) heap for small objects (SOH), and the large heap (LOH) (for objects with a size of 85,000 bytes or more ) to illustrate the semantic difference between them and the loader heaps. The JIT or runtime compiler generates instructions for the x86 architecture and stores them on the heap for JIT code. The garbage collector and large objects are heaps that are handled by the garbage collector, and managed objects are created on these heaps.
Type is a fundamental element of programming in .NET. In C #, a type can be declared using the following keywords: class, struct, and interface. Most types are explicitly created by the programmer, however, in special cases of interaction and in scripts for calling remote objects (.NET Remoting), the .NET CLR generates types implicitly. These generated types include COM and Runtime Callable Wrappers and Transparent Proxies.
We explore .NET fundamental types, starting with the structure of the stack that contains references to the object (as a rule, the stack is one of the places from which the instance of the object begins its existence).
The code in Figure 4 contains a simple program with a console entry point where the static method is called.
Method1 creates an instance of type SmallClass, which contains an array of bytes used to demonstrate the creation of an instance of an object in a heap of large LOH objects. The code is trivial, but will be involved in our discussion.
Figure 5 shows a snapshot of a typical fastcall call stack stopped at a breakpoint on the line “return smallObj;” in the Create method. (Fastcall is a .NET call convention that determines that arguments are passed to functions in registers when possible, with the rest of the arguments passed through the stack from right to left and then popped from the stack by the called function. A
local variable of significant type or value type objSize is placed right in stack variables of a reference type, such as smallObj, are stored with a fixed occupied size (4-bit doubleword DWORD) on the stack and contain the address of instances of objects placed in a regular garbage collector heap.
In traditional C ++, this is a pointer to an object; in the controlled world of programming, this is a reference or object reference. However, it does contain the address of the instance of the object. We will use the term Object Instance for a data structure located at the address specified in the link to the object.

Figure 5. SimpleProgram stack and heaps
A smallObj object instance on a regular garbage collector heap contains Byte [] pointing to _largeObj whose size is 85,000 bytes (note that the figure shows 85016 bytes, which is the actual size of the occupied area). The CLR handles objects larger than or equal to 85,000 bytes in a different way, unlike smaller objects. Large objects are located on the large object heap (LOH), while small objects are created on a regular garbage collector heap, which optimizes object placement and garbage collection. LOH is not compressed, while a regular heap is compressed at each garbage collection. Moreover, LOH is cleaned only when the garbage collection is complete.
The smallObj instance contains a type descriptor pointing to a method table (MethodTable) of the corresponding type. There will be one method table for each declared one and all instances of objects of the same type will point to the same method table. Also, the descriptor will contain information about the type type (interface, abstract class, concrete class, COM wrapper, proxy), the number of implemented interfaces, an interface map for distributing methods, the number of slots in the method table and the table of slots indicating the implementation.
One important data structure points to EEClass. The CLR class loader creates an EEClass from metadata before the method table is created. In Figure 4, the SmallClass method table points to its EEClass. These structures indicate their modules and assemblies. The method table and EEClass are usually located in domain-specific loader heaps. Byte [] is a special case; The method table and EEClass are in heaps of the shared domain loader. Loader heaps belong to a specific domain (domain-specific) and any data structures mentioned earlier, once loaded, will not go anywhere until the domain is unloaded. Also, the default domain cannot be unloaded and therefore the code exists until the CLR stops.
As we noticed, all instances of value types are either embedded on the stream stack or embedded on the garbage collector heap. All reference types are created on the heap of the garbage collector or the heap of large objects (LOH). Figure 6 shows a typical layout of an instance of an object. The object can be referenced by a local variable created on the stack of descriptor tables in situations of external interaction and P / Invoke scripts, from registers (this can be this-specify the method arguments during the execution of the method) or from the finalizer queue for objects with finalizer methods OBJECTREF does not indicate the beginning of an instance of an object, but indicates an offset of 4 bytes (DWORD) from the beginning. The DWORD is called the object header and contains the index (number of the synblk synchronization block starting with one) in the SyncTableEntry table. Since distribution occurs through the index, the CLR can move the table in memory when an increase in size is necessary. The SyncTableEntry serves soft links back to the object, so that ownership of the synchronization block can be traced to the CLR. Soft links allow the garbage collector to clean up when other hard links no longer exist. SyncTableEntry also stores a pointer to a SyncBlock containing useful information, but less necessary for all instances of the object. This information includes object locks, its hash code, any conversion data, and domain index (AppDomainIndex). For most instances of objects, there will be no space allocated for the synchronization block (SyncBlock) and the syncblock number will be zero. This will change when the running thread stumbles upon the expression lock (obj) or obj.GetHashCode,
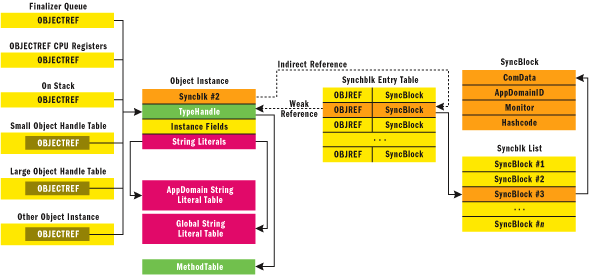
Figure 6. Representation of an instance of an object
In this code, smallObj will use zero (no syncblk) as its number in the synchronization block table (Syncblk Entry Table). The lock statement forces the CLR to create a syncblock record and write the corresponding number in the header. Because the lock keyword in C # is expanded into a try-catch block using the Monitor class, a Monitor object is created in SyncBlock for synchronization. Calling the GetHashCode () method fills the Hashcode field with the hash code of the object in SyncBlock.
SyncBlock contains other fields used in conjunction with COM and marshaling delegates into unmanaged code, but not related to the typical use of objects.
A handler of type (TypeHandle) follows the syncblk number in the instance of the object. In order to maintain continuity of reasoning, I will discuss the type handler after clarifying the instances of the variables. A variable list of instance fields follows a type handler. By default, instance fields are placed in such a way that memory usage is efficient and alignment gaps are minimal. The code in Figure 7 contains a simple SimpleClass class that has a set of instance variables contained in it, with different sizes.
Figure 8 contains an example of an instance of the SimpleClass object displayed in the memory window of the Visual Studio debugger. We set a breakpoint on the return statement, Figure 7, and used the simpleObj address contained in the ECX register to display an instance of the object in the memory view. The first 4-byte block is the syncblk number. We do not use the instance in any code requiring synchronization (and do not use the HashCode method), therefore this field is set to 0. The reference to the object is stored in the stack variable, points to 4 bytes located at offset 4. Byte variables b1, b2, b3 and b4 are located side by side with each other. The byte variables b1, b2, b3, and b4 are all arranged in a row, next to each other. Both variables of type short s1 and s2 are also placed side by side. The string variable str is a 4-byte ODJECTREF pointing to the current instance of the string located in the garbage collector heap. String is a special type, all instances containing the same text will point to the same instance in the global table of strings - this is done during the assembly loading process. This process is called string interning and is designed to optimize memory usage. As we noted earlier in the .NET Framework 1.1, the assembly cannot turn off the interning process; perhaps in future versions of the CLR runtime, this will be provided. This process is called string interning and is designed to optimize memory usage. As we noted earlier in the .NET Framework 1.1, the assembly cannot turn off the interning process; perhaps in future versions of the CLR runtime, this will be provided. This process is called string interning and is designed to optimize memory usage. As we noted earlier in the .NET Framework 1.1, the assembly cannot turn off the interning process; perhaps in future versions of the CLR runtime, this will be provided.
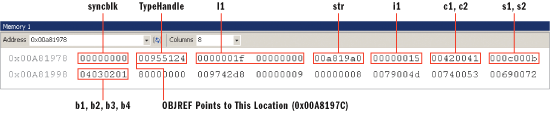
Figure 8. Debug window displaying an instance of an object in memory
Therefore, the lexical sequence of variable members in the source code is not supported in memory by default. In external interaction scenarios where the lexical sequence is to be transferred to memory, the StructLayoutAttribute attribute can be used, which takes the value of the LayoutKind enum as an argument. LayoutKind.Sequential will provide lexical consistency for marshaled data. In the .NET Framework, this will not affect the managed layout (in the .NET Framework 2.0, using the attribute will have an effect). In external interaction scenarios where you really need to have extra offset and explicit control over the sequence of fields, LayoutKind.Explicit can be used in conjunction with the FieldOffset attribute at the field level. Having looked at the immediate contents of the memory, let's use the SOS debugger to look at the contents of the object instance. One useful command is DumpHeap, which allows you to display the entire contents of the heap and all instances of a specific type. Instead of using registers, DumpHeap can show the address of the object we just created:
The total size of the object is 36 bytes. It doesn't matter how big the row is, instances of SimpleClass contain only DWORD OBJECTREF. SimpleClass instance variables occupy only 28 bytes. The remaining 8 bytes include the TypeHandle type handler (4 bytes) and the syncblk synchronization block number (4 bytes). Having received the address of the simpleObj instance, let's dump the contents of this instance using the DumpObj command, as shown here:
As noted, the default layout layout generated for classes by the C # compiler is LayoutType.Auto (LayoutType.Sequential is used for structures); thus, the class loader reorders the instance fields to minimize offsets. We can use ObjSize to get the graph including the space occupied by the instance, str. Here's the output
:! ObjSize 0x00a8197c
sizeof (00a8197c) = 72 (0x48) bytes (SimpleClass)
Son of Strike
The SOS debug extension used to display the contents of CLR data structures in this article. This is part of the .NET Framework installation package and is located on the% windir% \ Microsoft.NET \ Framework \ v1.1.4322 path. Before loading SOS into the process, enable managed debugging in the project properties in Visual Studio .NET. Add the directory where the SOS.dll is located in the PATH environment variable. To load SOS when stopping at a breakpoint, open Debug | Windows | Immediate In the immediate window, run .load sos.dll. Use! Help to get a list of debugger commands. See the msdn Bugslayer column documentation for more details on SOS .
If you subtract the size of the SimpleClass instance (36 bytes) from the entire size of the object graph (72 bytes), you get the str size, which is 36 bytes. Let's check this by dumping the str instance. Below is the output of the command:
If you add the size of the str string instance (36 bytes) to the size of the SimpleClass instance (36 bytes), you get a total size of 72 bytes, which corresponds to the output of the ObjSize command. Note that ObjSize will not include the memory occupied by the syncblk infrastructure. Also, in the .NET Framework 1.1, the CLR is not aware of memory occupied by any unmanaged resources, such as GDI objects, COM objects, file handlers, and so on; therefore, they will not be reflected by this command.
A handler of type (TypeHandle), a pointer to a method table (MethodTable), is located right after the syncblk number. Before creating an instance of the object, the CLR looks at the loaded types and loads the type information if the type is not found, obtains the address of the method table, creates an instance of the object, and writes the value to the TypeHandle of the object instance. Code compiled by the JIT compiler uses a TypeHandle type handler to find the MethodTable table of methods for distributing methods. The code compiled by the JIT compiler uses a type handler (TypeHandle) to position the method table (MethodTable) to distribute method calls. The CLR uses a type handler (TypeHandle) when it is necessary to find a loaded type through the MethodTable method table.
Each class and interface, when loaded into the application domain, will be represented in memory by the MethodTable data structure. This is the result of loading classes before creating the very first instance of the object. While an instance of an ObjectInstance object stores state, MethodTable stores behavior information. MethodTable associates an object instance with in-memory metadata structures generated by the language compiler using EEClass. Information in the MethodTable method table and data structures attached to it can be accessed from managed code through System.Type. A pointer to a method table can also be obtained even in managed code through the Type.RuntimeTypeHandle property. A handler of type TypeHandle contained in ObjectInstance indicates an offset from the beginning of the method table.
Figure 9 shows a typical representation of a method table. We will show some important fields of a type handler, but for a more complete list, use the figure. Let's start with the Base Instance Size, as it has a direct correlation with the runtime memory profile.
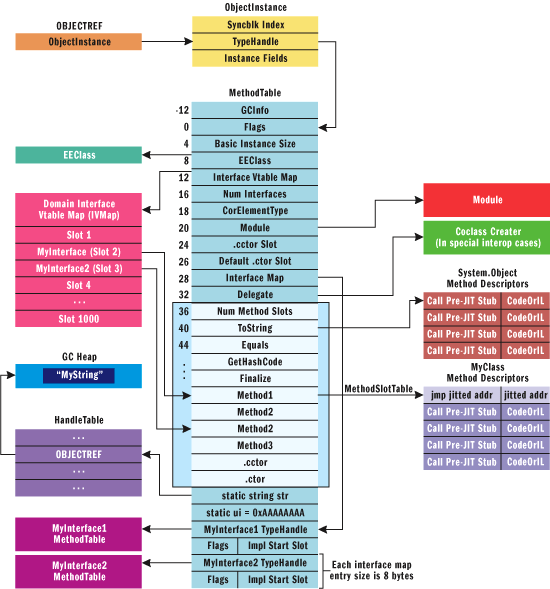
Figure 9 Presentation of the method table
The base instance size is the size of the object, calculated by the class loader, based on the declarations of the fields in the code. As discussed earlier, the current garbage collector implementation requires an object instance size of at least 12 bytes. If the class does not have any declared instance fields, this will result in 4 byte redundancy.
The remaining 8 bytes will be occupied by the header (Object Header) (which may contain the syncblk synchronization block number) and the type handler (TypeHandle). Again, the size of the object may be affected by StructLayoutAttribute.
Let's look at a snapshot (a memory window in Visual Studio .NET 2003) of the method table for MyClass from Figure 3 (MyClass with two interfaces) and compare this with the output generated using SOS. In Figure 9, the size of the object is located at a 4-byte offset and has a value of 12 (0x0000000C) bytes. The following is the output of DumpHeap from SOS:
The slot table built into the method table points to the corresponding method descriptors (MethodDesc) that provide type behavior. The table of method slots is created on the basis of a linear list of method declarations in the following order: inherited virtual methods, declared virtual methods, instance methods, static methods. The class loader goes through the metadata of the current class, parent class and interfaces and creates a table of methods. In the process of formation, overridden virtual methods are replaced, hidden methods of the parent class are replaced, new slots are created and slots are duplicated as necessary. Duplication of slots is necessary to create the illusion that each interface has its own mini vtable. However, duplicate slots indicate the same physical implementation. MyClass has three instance methods, a class constructor (.cctor) and an object constructor (.ctor). The object constructor is automatically generated by the C # compiler for all objects that do not have explicit constructors. The class constructor is generated by the compiler when we have static variables defined and initialized. Figure 10 shows a view of the method table for MyClass. The view shows 10 methods because there is duplication of the Method2 slot for IVMap, which will be considered as follows. Figure 11 shows the editable SOS dump of the method table of the MyClass class. The class constructor is generated by the compiler when we have static variables defined and initialized. Figure 10 shows a view of the method table for MyClass. The view shows 10 methods because there is duplication of the Method2 slot for IVMap, which will be considered as follows. Figure 11 shows the editable SOS dump of the method table of the MyClass class. The class constructor is generated by the compiler when we have static variables defined and initialized. Figure 10 shows a view of the method table for MyClass. The view shows 10 methods because there is duplication of the Method2 slot for IVMap, which will be considered as follows. Figure 11 shows the editable SOS dump of the method table of the MyClass class.
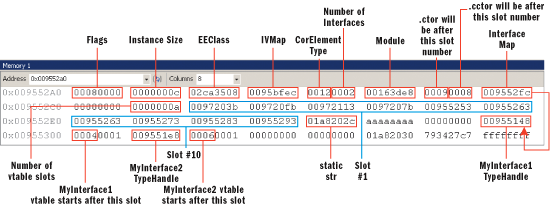
Figure 10 Presentation of the MyClass Method Table
The first 4 methods of any type will always be ToString, Equals, GetHashCode and Finalize. These methods are virtual inherited from System.Object. The Method2 slot has a duplicate, but both point to the same method handle. Explicitly encoded .cctor and .ctor will be grouped with static and instance methods respectively.
A method descriptor (MethodDesc) is an encapsulation of a method implementation as understood by the CLR. There are many types of method descriptors that support calls to various implementations of external interactions, in addition to managed implementations. In this article, we will only consider MethodDesc-driven code in the context of Figure A as shown in Figure 3. MethodDesc is generated as part of the class loading process and initially points to an intermediate language (IL). Each method descriptor of the MethodDesc method is filled with PreJitStub content, which is responsible for enabling JIT compilation. Figure 12 shows a typical view. The entry in the method table slot actually points to a stub instead of the actual MethodDesc data structure. This record is located at a negative offset of 5 bytes from the real MethodDesc and is part of the 8 byte pad inherited by each method. These 5 bytes contain instructions for calling the PreJitStub routine. This 5-byte offset can be seen from the output of DumpMT (for MyClass in Figure 11) of SOS, since MethodDesc is always 5 bytes after the location of the method slot table specified in the entry. Before the first call, the compilation JIT routine is called. After compilation, 5 bytes containing the call instruction will be overwritten by the unconditional jump command to the compiled code in the x86 architecture. since MethodDesc is always 5 bytes after the location of the method slot specified in the table entry. Before the first call, the compilation JIT routine is called. After compilation, 5 bytes containing the call instruction will be overwritten by the unconditional jump command to the compiled code in the x86 architecture. since MethodDesc is always 5 bytes after the location of the method slot specified in the table entry. Before the first call, the compilation JIT routine is called. After compilation, 5 bytes containing the call instruction will be overwritten by the unconditional jump command to the compiled code in the x86 architecture.

Figure 12 The method descriptor The
code disassembly pointed to by the entry in the table of method slots in Figure 12 will show a call to PreJitStub. Here's the abbreviated disassembly output to JIT compilation for Method2:
Now let's run the method and disassemble the same address:
Only the first 5 bytes at this address are code; the rest contains data from the Method2 method of the method descriptor. The "! U" command is not aware of this and generates meaningless code, that is, you can ignore everything after the first 5 bytes.
CodeOrIL before JIT compilation contains the relative virtual address (RVA) of the method implementation in the intermediate language (IL). This field is set to indicate that this is intermediate code, the CLR updates this field with the address of the JIT-compiled code after compilation on demand.Let's select the method from those that are output and remove the MethodDesc dump using the DumpMT command before and after the JIT compilation:
After compilation, MethodDesc looks like this:
The flag field in the method descriptor is encoded to store information about the type of method, such as a static, instance, interface method, or COM implementation.
Let's look at another complex aspect of the method table: implementing interfaces. It is made to look simply at a controlled environment, understanding all the difficulties in the presentation process. Next, we will look at how interfaces are placed and how the distribution of interface methods really works.
At offset 12 in the method table is an important pointer, IVMap. As shown in Figure 9, IVMap points to the application domain level mapping table, which is indexed using the process level interface identifier. Each interface implementation will have an entry in IVMap. If MyInterface1 is implemented by two classes, then there will be two entries in the IVMap table. The record will point back to the beginning of the subordinate table built into the MyClass table of methods (MethodTable), as shown in Figure 9. This is the reference by which the interface method is distributed. IVMap is created based on the interface map information embedded in the method table. The interface map is created on the basis of class metadata during the construction of the method table. Once the type load is completed, only IVMap is used in the distribution method. The mixing field 28 in the method tables (Interface Map) points to the InterfaceInfo record embedded inside the method table. In our case, there are two entries for each of the two interfaces implemented by the MyClass class. The first 4 bytes of the first InterfaceInfo record point to a handler of the type (TypeHandle) of the MyInterface1 interface (see Figure 9 and Figure 10). The next word (2 bytes) is occupied by flags (where 0 is inherited from the parent class and 1 is implemented in the current class). The next word immediately after the flags is the initial slot, which is used by the class loader to place the subordinate table of the interface implementation. For MyInterface1, the value is 4, which means that slots 5 and 6 indicate implementation. For the MyInterface2 interface, the value is 6, that is, slots 7 and 8 indicate implementation. The classloader dualins the slots if necessary to create the illusion that each interface gets its own implementation, although it is physically mapped to the same method descriptor. In the MyClass class, the MyInterface1.Method2 method and the MyInterface2.Method2 method will point to the same implementation.
Distribution of the interface method is performed through IVMap, while direct methods are distributed via the MethodDesc address stored in the corresponding slot. As noted earlier, the .NET Framework uses the fastcall calling convention. The first two arguments are usually passed through the ECX and EDX registers, if possible. The first argument to the instance method is always the "this" pointer, which is passed through the ECX register, as shown by the instruction "mov ecx, esi":
This disassembled code demonstrates that direct calls to MyClass instance methods do not use offset. The JIT compiler writes the address of the method descriptor directly in the code. Interface-based distribution occurs through IVMap and requires slightly more instructions than direct distribution. One of the instructions is used to get the IVMap address, and the other to get the initial implementation slot in the method slot table. Also, casting an instance of an object to an interface is simply copying this pointer to the target variable. In Figure 2, “mi1 = mc;” uses a single instruction to copy OBJECTREF from mc to mi1.
Let's take a look at virtual distribution now and compare it with direct and interface-based distribution. Here's the disassembly for invoking the MyClass.Method3 virtual method from Figure 3:
Virtual distribution always occurs through a fixed slot number, regardless of the pointer in the method table in the received hierarchy of the class (type) implementation. During the construction of the method table, the class loader replaces the parent implementation with an overridden child implementation. As a result, method calls are encoded against the parent object distributed to the implementation of the child object. Disassembly demonstrates that distribution occurs through slot number 8 in the debugger memory window (as seen in Figure 10) as well as in the DumpMT output.
Static variables are an important part of the data structure of a method table. They are located as part of the method table immediately after the array of method table slots. All primitive static types are embeddable, while static value objects such as structures and reference types are addressed through the OBJECTREF created in the handler tables. The OBJECTREF in the method table indicates an instance of the object created on the heap. Once created, OBJECTREF in the handler table will keep the instance of the object on the heap unscathed until the application domain is unloaded. In Figure 9, the static string variable str, points to OBJECTREF in the handler table, which points to MyString in the garbage collector heap.
EEClass appears before the creation of the method table and, in combination with the method table, is the CLR version of the type declaration. In fact, the EEClass and the method table are logically the same data structure (together they represent the same type) and were separated based on the frequency of use. Fields used are often located in the method table, and fields used are not often found in EEClass. So the information (such as names, fields and offsets) necessary for JIT compilation of functions appears in EEClass, however, the data necessary at runtime (such as vtable slots and garbage collector information) is located in the method table.
For each type of application loaded into the domain, one EEClass will be created. This includes interfaces, classes, abstract classes, arrays, and structures. Each EEClass is a tree node tracked by the execution engine. The CLR uses this network to navigate through EEClass structures for such purposes as loading a class, building a method table, type checking, and type casting. The relationship of the child with the parent between EEClass is established on the basis of the inheritance hierarchy, in turn, the relationship of the parent with the child is established on the basis of the combination of the inheritance hierarchy and the sequence of loading classes. New EEClass nodes are added, relationships between nodes are superimposed, and new relationships are established during the execution of managed code. There are also horizontal connections with the EEClass twins on the network. EEClass has three fields for managing node relationships between loaded types: the ParentClass parent class, the SiblingChain twin chain, and the ChildrenChain child chain. See Figure 13 for a schematic representation of an EEClass in the context of the MyClass class from Figure 4.
Figure 13 shows only a few fields related to this discussion. Because we missed some fields in the view, we did not show offsets in this figure. EEClass has circular references to the method table. EEClass also points to method descriptor data blocks located in the default access domain's heap of frequent access. The reference to the list of field descriptor objects located on the heap of the process provides information about the placement of fields during the construction of the method table. EEClass is located on a heap with a low access frequency of the application domain, so that the operating system can manage memory pages more efficiently, and as a result, the workspace is reduced.
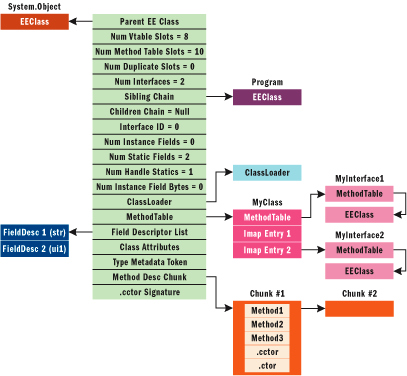
Figure 13 EEClass View
Other fields shown in Figure 13 are secondary and require no explanation in the context of MyClass (Figure 3). Let's look at the actual physical memory by dumping the EEClass using SOS. Run the program from Figure 3 after setting the breakpoint on the line mc.Method1. First, get the EEClass address for MyClass using the Name2EE command:
The first argument to the Name2EE command is the name of the module, which can be obtained from the DumpDomain command. Now we know the address of the EEClass, and we get a dump of the EEClass class itself:
Figure 13 and the output of the DumpClass look basically the same. The metadata token (mdToken) represents the MyClass index in the memory mapping metadata tables of the PE module of the file, the parent class points to System.Object. The twin chain (Figure 13) demonstrates that it is loaded as a result of loading the Program class.
MyClass has eight vtable slots (methods that can be distributed virtually). Despite the fact that Method1 Method2 methods are not virtual, they will be considered as virtual methods when performing distribution via interfaces and therefore are added to the list. Add .cctor and .ctor to the list, and you get only 10 (0xA) methods. The class has two static fields listed at the end. MyClass has no instance fields. The remaining fields require no explanation.
Our tour of some of the most important internal components of the CLR has ended. Obviously, there is much more left to be considered, and what should be considered more deeply, but we hope this will give you some impression of how it works. A lot of the information presented here will probably be changed in future releases of the CLR and the .NET Framework. But still, if the data structures discussed in this article are subject to change, the concepts will remain unchanged.
The article discusses:
- System Domain (SystemDomain), Shared Domain (SharedDomain), and Default Domain (DefaultDomain)
- Representation of an object and other features of memory organization
- Method table view
- Method Distribution
Used technologies: .NET Framework, C #
Content
- Domains created by the bootloader
- System domain
- Shared Domain (Shared)
- Default domain
- Heap loader
- Type Basics
- Object instance
- Method table
- Base Instance Size
- Method Slot Table
- Method descriptor
- Table of virtual interface method tables and interface map
- Virtual distribution
- Static Variables
- Eeclass
- Conclusion
The common runtime (CLR) is becoming (or has already become) the main infrastructure for building applications on Windows, so having a deep understanding of its internal structure will help to create efficient industrial-grade applications.
In this article, we will explore the internal structure of the CLR, including the layout of the object instance, the layout of the method table, the distribution of methods, front-end distribution, and various data structures.
We will use very simple fragments of C # code, any implicit use of the syntax of a programming language implies C #. Some of the data structures and algorithms discussed will be changed in future versions of the Microsoft® .NET Framework, but the conceptual framework will remain the same. We will use the Visual Studio® .NET 2003 debugger and the Son of Strike (SOS) debugging extension to view the data structures discussed in this article. SOS downloads internal CLR data, and allows you to view, save information of interest. See the procedure for loading SOS.dll into the debugger process at the appropriate sources.
See the "Son of Strike" sidebar for loading SOS.dll into the Visual Studio .NET 2003 debugger process.
In this article, we will describe classes corresponding to implementations in the Shared Source CLI (SSCLI).
The table in Figure 1 will help in examining the megabytes of code in SSCLI while searching for the necessary structures.
Figure 1 SSCLI Links
| Component | SSCLI Path |
|---|---|
| Appdomain | /sscli/clr/src/vm/appdomain.hpp |
| AppDomainStringLiteralMap | /sscli/clr/src/vm/stringliteralmap.h |
| Basedomain | /sscli/clr/src/vm/appdomain.hpp |
| Classloader | /sscli/clr/src/vm/clsload.hpp |
| Eeclass | /sscli/clr/src/vm/class.h |
| Fielddesk | /sscli/clr/src/vm/field.h |
| Gcheap | /sscli/clr/src/vm/gc.h |
| GlobalStringLiteralMap | /sscli/clr/src/vm/stringliteralmap.h |
| Handletable | /sscli/clr/src/vm/handletable.h |
| InterfaceVTableMapMgr | /sscli/clr/src/vm/appdomain.hpp |
| Large Object Heap | /sscli/clr/src/vm/gc.h |
| Layoutkind | /sscli/clr/src/bcl/system/runtime/interopservices/layoutkind.cs |
| Loaderheaps | /sscli/clr/src/inc/utilcode.h |
| MethodDescs | /sscli/clr/src/vm/method.hpp |
| Methodtables | /sscli/clr/src/vm/class.h |
| OBJECTREF | /sscli/clr/src/vm/typehandle.h |
| Securitycontext | /sscli/clr/src/vm/security.h |
| SecurityDescriptor | /sscli/clr/src/vm/security.h |
| Shareddomain | /sscli/clr/src/vm/appdomain.hpp |
| StructLayoutAttribute | /sscli/clr/src/bcl/system/runtime/interopservices/attributes.cs |
| Syncableablentry | /sscli/clr/src/vm/syncblk.h |
| System namespace | / sscli / clr / src / bcl / system |
| Systemdomain | /sscli/clr/src/vm/appdomain.hpp |
| Typehandle | /sscli/clr/src/vm/typehandle.h |
A moment that we should pay attention to before we go further - the information provided in this article is valid only for the .NET Framework 1.1 (it also mostly corresponds to Shared Source CLI 1.0, taking into account a number of notable exceptions present in various interaction scenarios) when performance on the x86 platform. The information is changed in future versions of the .NET Framework, so please do not build your applications with absolute links to these internal structures.
Domains created by the CLR bootloader
Before starting the first line of managed code, three application domains are created. Two of them are not available in managed code and are not even visible to the CLR host. They can only be created by loading the CLR provided by the mscoree.dll and mscorwks.dll buses (or mscorsvr.dll for multiprocessor systems). As you can see in Figure 2, this is a system domain and a shared (common) domain; they can exist in only one instance. The third domain is default, only an instance of this application domain has a name. For a simple CLR host, such as a console application, the default application domain name contains the name of the executable image. Additional domains can be created from managed code using the AppDomain.CreateDomain method or from an unmanaged code host using the ICORRuntimeHost interface.
Complex hosts such as ASP.NET create the required number of domains, in accordance with the number of applications running in the served Web site.
Figure 2. Domains created by the CLR loader
System domain
The system domain creates and initializes the shared domain (SharedDomain) and the default domain (Default). It also downloads the mscorlib.dll system library to the shared domain.
The system domain also contains string constants available within the process boundaries, interned explicitly or implicitly.
String interning is an optimization feature that is a bit totalitarian in the .NET Framework 1.1, since the CLR does not allow assemblies to optimize this functionality. At the same time, memory is used to store only one string instance for all string literals in all application domains.
The system domain also serves to generate interface identifiers within the process boundaries that are used to create the interface map (InterfaceVtableMaps) in each application domain (AppDomain).
The system domain traces all domains in the process and provides functionality for loading and unloading application domains.
Shared Domain (SharedDomain)
All domain-neutral code is uploaded to the shared domain. Mscorlib, a system library, is required for user code in all application domains (AppDomains). This library is automatically uploaded to the shared domain. Basic types from the System namespace, such as Object, ValueType, Array, Enum, String and Delegate, are preloaded into this domain during the CLR bootloader loading process. User code can also be uploaded to this domain by setting the LoaderOptimization attributes by the application host CLR during a call to CorBindToRuntimeEx. The console application can upload code to the shared domain by adding the System.LoaderOptimizationAttribute attribute to the application’s Main method. The shared domain also manages the assembly map, indexed relative to the base address, the map acts as a reference table for managing the general dependencies of assemblies loaded in the default domain and other application domains created in managed code. The default domain is used only for downloading the user's private code, which should not be accessible to other applications.
Default domain
The default domain is an instance of the application domain, where the application code is usually executed. While some applications require additional application domains to be created at runtime (such as have a plugin architecture or applications that generate a significant amount of code at runtime), most applications create one domain at runtime. All code running in this domain is contextually restricted at the domain level. If several application domains are created in the application, any cross-domain access will occur through the .NET Remoting proxy. Additional intra-domain boundaries can be created using types inherited from System.ContextBoundObject.
Each application domain has its own SecurityDescriptor, SecurityContext and DefaultContext, as well as its own heap loader (High-Frequency Heap, Low-Frequency Heap, and Stub Heap),
Handle Table, Large Object Heap Handle Table, Vtable and assembly cache.
Loader heaps
LoaderHeaps are designed to load various CLR runtime artifacts and optimization artifacts that have existed over the entire lifetime of the domain. These heaps are increased by predictable fragments to minimize fragmentation. The loader heap differs from the garbage collector (GC) heap (or heap set in the case of symmetrical SMP multiprocessors) in that the garbage collector heap contains object instances, and the loader heap contains system types. Frequently requested structures such as method tables, method descriptors (MethodDescs), field descriptors (FieldDescs), and an interface map are located in the heap of frequent access (HighFrequencyHeap). Structures to which calls are more rare, such as EEClass and the class loader (ClassLoader), as well as their service tables, are located in a heap with a low hit rate (LowFrequencyHeap). The service heap (StubHeap) contains blocks that provide support for access security in code code access security (CAS), the shell COM calls and P / Invoke calls. Having examined the domains and heaps of the bootloaders at a high level, now let's look at their physical organization more closely in the context of the simple application in Figure 3. We will stop the program execution on “mc.Method1 ();” and create a domain dump using the extended DumpDomain SOS debugger command. Below is the result: Now let's look at their physical organization more closely in the context of the simple application in Figure 3. Stop the program execution on “mc.Method1 ();” and create a domain dump using the extended DumpDomain SOS debugger command. Below is the result: Now let's look at their physical organization more closely in the context of the simple application in Figure 3. Stop the program execution on “mc.Method1 ();” and create a domain dump using the extended DumpDomain SOS debugger command. Below is the result:
!DumpDomain
System Domain: 793e9d58, LowFrequencyHeap: 793e9dbc,
HighFrequencyHeap: 793e9e14, StubHeap: 793e9e6c,
Assembly: 0015aa68 [mscorlib], ClassLoader: 0015ab40


Shared Domain: 793eb278, LowFrequencyHeap: 793eb2dc,
HighFrequencyHeap: 793eb334, StubHeap: 793eb38c,
Assembly: 0015aa68 [mscorlib], ClassLoader: 0015ab40


Domain 1: 149100, LowFrequencyHeap: 00149164,
HighFrequencyHeap: 001491bc, StubHeap: 00149214,
Name: Sample1.exe, Assembly: 00164938 [Sample1],
ClassLoader: 00164a78
Figure 3 Sample1.exe
using System;
public interface MyInterface1
{
    void Method1();
    void Method2();
}
public interface MyInterface2
{
    void Method2();
    void Method3();
}
class MyClass : MyInterface1, MyInterface2
{
    public static string str = "MyString";
    public static uint   ui = 0xAAAAAAAA;
    public void Method1() { Console.WriteLine("Method1"); }
    public void Method2() { Console.WriteLine("Method2"); }
    public virtual void Method3() { Console.WriteLine("Method3"); }
}
class Program
{
    static void Main()
    {
        MyClass mc = new MyClass();
        MyInterface1 mi1 = mc;
        MyInterface2 mi2 = mc;
        int i = MyClass.str.Length;
        uint j = MyClass.ui;
        mc.Method1();
        mi1.Method1();
        mi1.Method2();
        mi2.Method2();
        mi2.Method3();
        mc.Method3();
    }
}
Our console application, Sample1.exe, is uploaded to the application domain (AppDomain), which has the name “Sample1.exe”. Mscorlib.dll is loaded into the shared domain (SharedDomain), but also appears in the system domain (SystemDomain) as the kernel system library. A high-frequency access heap (HighFrequencyHeap), a low-frequency access heap (LowFrequencyHeap), and a stub heap (StubHeap) are located in each domain. The system domain and the shared domain use the same class loader (ClassLoader), while the default domain (Default AppDomain) uses its own.
The result of the command does not display the reserved and used size of the loader heaps. The high-frequency access heap initially reserves 32Kb and uses 4Kb.
The low-frequency access heap stub heaps initially reserve 8Kb and occupy 4Kb.
Also, a heap of an interface map is not shown (InterfaceVtableMap, hereinafter IVMap) Each domain has an interface map, which is created on its own loader heap during the domain initialization phase. A bunch of interface cards (IVMap) reserves 4KB and takes up 4KB initially. We will discuss the significance of the interface map when we examine the type layout in the following sections.
Figure 2 shows the default process heap, the runtime compiler heap (JIT Code), the garbage collector (GC) heap for small objects (SOH), and the large heap (LOH) (for objects with a size of 85,000 bytes or more ) to illustrate the semantic difference between them and the loader heaps. The JIT or runtime compiler generates instructions for the x86 architecture and stores them on the heap for JIT code. The garbage collector and large objects are heaps that are handled by the garbage collector, and managed objects are created on these heaps.
Type Basics
Type is a fundamental element of programming in .NET. In C #, a type can be declared using the following keywords: class, struct, and interface. Most types are explicitly created by the programmer, however, in special cases of interaction and in scripts for calling remote objects (.NET Remoting), the .NET CLR generates types implicitly. These generated types include COM and Runtime Callable Wrappers and Transparent Proxies.
We explore .NET fundamental types, starting with the structure of the stack that contains references to the object (as a rule, the stack is one of the places from which the instance of the object begins its existence).
The code in Figure 4 contains a simple program with a console entry point where the static method is called.
Method1 creates an instance of type SmallClass, which contains an array of bytes used to demonstrate the creation of an instance of an object in a heap of large LOH objects. The code is trivial, but will be involved in our discussion.
Figure 4 Large and small objects
using System;
class SmallClass
{
    private byte[] _largeObj;
    public SmallClass(int size)
    {
        _largeObj = new byte[size];
        _largeObj[0] = 0xAA;
        _largeObj[1] = 0xBB;
        _largeObj[2] = 0xCC;
    }
    public byte[] LargeObj
    {
        get { return this._largeObj; }
    }
}
class SimpleProgram
{
    static void Main(string[] args)
    {
        SmallClass smallObj = SimpleProgram.Create(84930,10,15,20,25);
        return;
    }
    static SmallClass Create(int size1, int size2, int size3,
        int size4, int size5)
    {
        int objSize = size1 + size2 + size3 + size4 + size5;
        SmallClass smallObj = new SmallClass(objSize);
        return smallObj;
    }
}
Figure 5 shows a snapshot of a typical fastcall call stack stopped at a breakpoint on the line “return smallObj;” in the Create method. (Fastcall is a .NET call convention that determines that arguments are passed to functions in registers when possible, with the rest of the arguments passed through the stack from right to left and then popped from the stack by the called function. A
local variable of significant type or value type objSize is placed right in stack variables of a reference type, such as smallObj, are stored with a fixed occupied size (4-bit doubleword DWORD) on the stack and contain the address of instances of objects placed in a regular garbage collector heap.
In traditional C ++, this is a pointer to an object; in the controlled world of programming, this is a reference or object reference. However, it does contain the address of the instance of the object. We will use the term Object Instance for a data structure located at the address specified in the link to the object.
Figure 5. SimpleProgram stack and heaps
A smallObj object instance on a regular garbage collector heap contains Byte [] pointing to _largeObj whose size is 85,000 bytes (note that the figure shows 85016 bytes, which is the actual size of the occupied area). The CLR handles objects larger than or equal to 85,000 bytes in a different way, unlike smaller objects. Large objects are located on the large object heap (LOH), while small objects are created on a regular garbage collector heap, which optimizes object placement and garbage collection. LOH is not compressed, while a regular heap is compressed at each garbage collection. Moreover, LOH is cleaned only when the garbage collection is complete.
The smallObj instance contains a type descriptor pointing to a method table (MethodTable) of the corresponding type. There will be one method table for each declared one and all instances of objects of the same type will point to the same method table. Also, the descriptor will contain information about the type type (interface, abstract class, concrete class, COM wrapper, proxy), the number of implemented interfaces, an interface map for distributing methods, the number of slots in the method table and the table of slots indicating the implementation.
One important data structure points to EEClass. The CLR class loader creates an EEClass from metadata before the method table is created. In Figure 4, the SmallClass method table points to its EEClass. These structures indicate their modules and assemblies. The method table and EEClass are usually located in domain-specific loader heaps. Byte [] is a special case; The method table and EEClass are in heaps of the shared domain loader. Loader heaps belong to a specific domain (domain-specific) and any data structures mentioned earlier, once loaded, will not go anywhere until the domain is unloaded. Also, the default domain cannot be unloaded and therefore the code exists until the CLR stops.
Object instance
As we noticed, all instances of value types are either embedded on the stream stack or embedded on the garbage collector heap. All reference types are created on the heap of the garbage collector or the heap of large objects (LOH). Figure 6 shows a typical layout of an instance of an object. The object can be referenced by a local variable created on the stack of descriptor tables in situations of external interaction and P / Invoke scripts, from registers (this can be this-specify the method arguments during the execution of the method) or from the finalizer queue for objects with finalizer methods OBJECTREF does not indicate the beginning of an instance of an object, but indicates an offset of 4 bytes (DWORD) from the beginning. The DWORD is called the object header and contains the index (number of the synblk synchronization block starting with one) in the SyncTableEntry table. Since distribution occurs through the index, the CLR can move the table in memory when an increase in size is necessary. The SyncTableEntry serves soft links back to the object, so that ownership of the synchronization block can be traced to the CLR. Soft links allow the garbage collector to clean up when other hard links no longer exist. SyncTableEntry also stores a pointer to a SyncBlock containing useful information, but less necessary for all instances of the object. This information includes object locks, its hash code, any conversion data, and domain index (AppDomainIndex). For most instances of objects, there will be no space allocated for the synchronization block (SyncBlock) and the syncblock number will be zero. This will change when the running thread stumbles upon the expression lock (obj) or obj.GetHashCode,
SmallClass obj = new SmallClass() // Do some work here
lock(obj) { /* Do some synchronized work here */ }
obj.GetHashCode();
Figure 6. Representation of an instance of an object
In this code, smallObj will use zero (no syncblk) as its number in the synchronization block table (Syncblk Entry Table). The lock statement forces the CLR to create a syncblock record and write the corresponding number in the header. Because the lock keyword in C # is expanded into a try-catch block using the Monitor class, a Monitor object is created in SyncBlock for synchronization. Calling the GetHashCode () method fills the Hashcode field with the hash code of the object in SyncBlock.
SyncBlock contains other fields used in conjunction with COM and marshaling delegates into unmanaged code, but not related to the typical use of objects.
A handler of type (TypeHandle) follows the syncblk number in the instance of the object. In order to maintain continuity of reasoning, I will discuss the type handler after clarifying the instances of the variables. A variable list of instance fields follows a type handler. By default, instance fields are placed in such a way that memory usage is efficient and alignment gaps are minimal. The code in Figure 7 contains a simple SimpleClass class that has a set of instance variables contained in it, with different sizes.
Figure 7 SimpleClass with instance variables
class SimpleClass
{
    private byte b1 = 1;                // 1 byte
    private byte b2 = 2;                // 1 byte
    private byte b3 = 3;                // 1 byte
    private byte b4 = 4;                // 1 byte
    private char c1 = 'A';              // 2 bytes
    private char c2 = 'B';              // 2 bytes
    private short s1 = 11;              // 2 bytes
    private short s2 = 12;              // 2 bytes
    private int i1 = 21;                // 4 bytes
    private long l1 = 31;               // 8 bytes
    private string str = "MyString"; // 4 bytes (only OBJECTREF)
    //Total instance variable size = 28 bytes
    static void Main()
    {
        SimpleClass simpleObj = new SimpleClass();
        return;
    }
}
Figure 8 contains an example of an instance of the SimpleClass object displayed in the memory window of the Visual Studio debugger. We set a breakpoint on the return statement, Figure 7, and used the simpleObj address contained in the ECX register to display an instance of the object in the memory view. The first 4-byte block is the syncblk number. We do not use the instance in any code requiring synchronization (and do not use the HashCode method), therefore this field is set to 0. The reference to the object is stored in the stack variable, points to 4 bytes located at offset 4. Byte variables b1, b2, b3 and b4 are located side by side with each other. The byte variables b1, b2, b3, and b4 are all arranged in a row, next to each other. Both variables of type short s1 and s2 are also placed side by side. The string variable str is a 4-byte ODJECTREF pointing to the current instance of the string located in the garbage collector heap. String is a special type, all instances containing the same text will point to the same instance in the global table of strings - this is done during the assembly loading process. This process is called string interning and is designed to optimize memory usage. As we noted earlier in the .NET Framework 1.1, the assembly cannot turn off the interning process; perhaps in future versions of the CLR runtime, this will be provided. This process is called string interning and is designed to optimize memory usage. As we noted earlier in the .NET Framework 1.1, the assembly cannot turn off the interning process; perhaps in future versions of the CLR runtime, this will be provided. This process is called string interning and is designed to optimize memory usage. As we noted earlier in the .NET Framework 1.1, the assembly cannot turn off the interning process; perhaps in future versions of the CLR runtime, this will be provided.
Figure 8. Debug window displaying an instance of an object in memory
Therefore, the lexical sequence of variable members in the source code is not supported in memory by default. In external interaction scenarios where the lexical sequence is to be transferred to memory, the StructLayoutAttribute attribute can be used, which takes the value of the LayoutKind enum as an argument. LayoutKind.Sequential will provide lexical consistency for marshaled data. In the .NET Framework, this will not affect the managed layout (in the .NET Framework 2.0, using the attribute will have an effect). In external interaction scenarios where you really need to have extra offset and explicit control over the sequence of fields, LayoutKind.Explicit can be used in conjunction with the FieldOffset attribute at the field level. Having looked at the immediate contents of the memory, let's use the SOS debugger to look at the contents of the object instance. One useful command is DumpHeap, which allows you to display the entire contents of the heap and all instances of a specific type. Instead of using registers, DumpHeap can show the address of the object we just created:
!DumpHeap -type SimpleClass
Loaded Son of Strike data table version 5 from
"C:/WINDOWS/Microsoft.NET/Framework/v1.1.4322/mscorwks.dll"
 Address       MT     Size
00a8197c 00955124       36
Last good object: 00a819a0
total 1 objects
Statistics:
      MT    Count TotalSize Class Name
  955124        1        36 SimpleClass
The total size of the object is 36 bytes. It doesn't matter how big the row is, instances of SimpleClass contain only DWORD OBJECTREF. SimpleClass instance variables occupy only 28 bytes. The remaining 8 bytes include the TypeHandle type handler (4 bytes) and the syncblk synchronization block number (4 bytes). Having received the address of the simpleObj instance, let's dump the contents of this instance using the DumpObj command, as shown here:
!DumpObj 0x00a8197c
Name: SimpleClass
MethodTable 0x00955124
EEClass 0x02ca33b0
Size 36(0x24) bytes
FieldDesc*: 00955064
      MT    Field   Offset                 Type       Attr    Value Name
00955124  400000a        4         System.Int64   instance      31 l1
00955124  400000b        c                CLASS   instance 00a819a0 str
    << some fields omitted from the display for brevity >>
00955124  4000003       1e          System.Byte   instance        3 b3
00955124  4000004       1f          System.Byte   instance        4 b4
As noted, the default layout layout generated for classes by the C # compiler is LayoutType.Auto (LayoutType.Sequential is used for structures); thus, the class loader reorders the instance fields to minimize offsets. We can use ObjSize to get the graph including the space occupied by the instance, str. Here's the output
:! ObjSize 0x00a8197c
sizeof (00a8197c) = 72 (0x48) bytes (SimpleClass)
Son of Strike
The SOS debug extension used to display the contents of CLR data structures in this article. This is part of the .NET Framework installation package and is located on the% windir% \ Microsoft.NET \ Framework \ v1.1.4322 path. Before loading SOS into the process, enable managed debugging in the project properties in Visual Studio .NET. Add the directory where the SOS.dll is located in the PATH environment variable. To load SOS when stopping at a breakpoint, open Debug | Windows | Immediate In the immediate window, run .load sos.dll. Use! Help to get a list of debugger commands. See the msdn Bugslayer column documentation for more details on SOS .
If you subtract the size of the SimpleClass instance (36 bytes) from the entire size of the object graph (72 bytes), you get the str size, which is 36 bytes. Let's check this by dumping the str instance. Below is the output of the command:
!DumpObj 0x00a819a0
Name: System.String
MethodTable 0x009742d8
EEClass 0x02c4c6c4
Size 36(0x24) bytes
If you add the size of the str string instance (36 bytes) to the size of the SimpleClass instance (36 bytes), you get a total size of 72 bytes, which corresponds to the output of the ObjSize command. Note that ObjSize will not include the memory occupied by the syncblk infrastructure. Also, in the .NET Framework 1.1, the CLR is not aware of memory occupied by any unmanaged resources, such as GDI objects, COM objects, file handlers, and so on; therefore, they will not be reflected by this command.
A handler of type (TypeHandle), a pointer to a method table (MethodTable), is located right after the syncblk number. Before creating an instance of the object, the CLR looks at the loaded types and loads the type information if the type is not found, obtains the address of the method table, creates an instance of the object, and writes the value to the TypeHandle of the object instance. Code compiled by the JIT compiler uses a TypeHandle type handler to find the MethodTable table of methods for distributing methods. The code compiled by the JIT compiler uses a type handler (TypeHandle) to position the method table (MethodTable) to distribute method calls. The CLR uses a type handler (TypeHandle) when it is necessary to find a loaded type through the MethodTable method table.
MethodTable Table
Each class and interface, when loaded into the application domain, will be represented in memory by the MethodTable data structure. This is the result of loading classes before creating the very first instance of the object. While an instance of an ObjectInstance object stores state, MethodTable stores behavior information. MethodTable associates an object instance with in-memory metadata structures generated by the language compiler using EEClass. Information in the MethodTable method table and data structures attached to it can be accessed from managed code through System.Type. A pointer to a method table can also be obtained even in managed code through the Type.RuntimeTypeHandle property. A handler of type TypeHandle contained in ObjectInstance indicates an offset from the beginning of the method table.
Figure 9 shows a typical representation of a method table. We will show some important fields of a type handler, but for a more complete list, use the figure. Let's start with the Base Instance Size, as it has a direct correlation with the runtime memory profile.
Figure 9 Presentation of the method table
Base Instance Size
The base instance size is the size of the object, calculated by the class loader, based on the declarations of the fields in the code. As discussed earlier, the current garbage collector implementation requires an object instance size of at least 12 bytes. If the class does not have any declared instance fields, this will result in 4 byte redundancy.
The remaining 8 bytes will be occupied by the header (Object Header) (which may contain the syncblk synchronization block number) and the type handler (TypeHandle). Again, the size of the object may be affected by StructLayoutAttribute.
Let's look at a snapshot (a memory window in Visual Studio .NET 2003) of the method table for MyClass from Figure 3 (MyClass with two interfaces) and compare this with the output generated using SOS. In Figure 9, the size of the object is located at a 4-byte offset and has a value of 12 (0x0000000C) bytes. The following is the output of DumpHeap from SOS:
!DumpHeap -type MyClass
 Address       MT     Size
00a819ac 009552a0       12
total 1 objects
Statistics:
    MT  Count TotalSize Class Name
9552a0      1        12    MyClass
Method Slot Table
The slot table built into the method table points to the corresponding method descriptors (MethodDesc) that provide type behavior. The table of method slots is created on the basis of a linear list of method declarations in the following order: inherited virtual methods, declared virtual methods, instance methods, static methods. The class loader goes through the metadata of the current class, parent class and interfaces and creates a table of methods. In the process of formation, overridden virtual methods are replaced, hidden methods of the parent class are replaced, new slots are created and slots are duplicated as necessary. Duplication of slots is necessary to create the illusion that each interface has its own mini vtable. However, duplicate slots indicate the same physical implementation. MyClass has three instance methods, a class constructor (.cctor) and an object constructor (.ctor). The object constructor is automatically generated by the C # compiler for all objects that do not have explicit constructors. The class constructor is generated by the compiler when we have static variables defined and initialized. Figure 10 shows a view of the method table for MyClass. The view shows 10 methods because there is duplication of the Method2 slot for IVMap, which will be considered as follows. Figure 11 shows the editable SOS dump of the method table of the MyClass class. The class constructor is generated by the compiler when we have static variables defined and initialized. Figure 10 shows a view of the method table for MyClass. The view shows 10 methods because there is duplication of the Method2 slot for IVMap, which will be considered as follows. Figure 11 shows the editable SOS dump of the method table of the MyClass class. The class constructor is generated by the compiler when we have static variables defined and initialized. Figure 10 shows a view of the method table for MyClass. The view shows 10 methods because there is duplication of the Method2 slot for IVMap, which will be considered as follows. Figure 11 shows the editable SOS dump of the method table of the MyClass class.
Figure 10 Presentation of the MyClass Method Table
Figure 11 SOS dump method table for MyClass
!DumpMT -MD 0x9552a0
  Entry  MethodDesc  Return Type       Name
0097203b 00972040    String            System.Object.ToString()
009720fb 00972100    Boolean           System.Object.Equals(Object)
00972113 00972118    I4                System.Object.GetHashCode()
0097207b 00972080    Void              System.Object.Finalize()
00955253 00955258    Void              MyClass.Method1()
00955263 00955268    Void              MyClass.Method2()
00955263 00955268    Void              MyClass.Method2()
00955273 00955278    Void              MyClass.Method3()
00955283 00955288    Void              MyClass..cctor()
00955293 00955298    Void              MyClass..ctor()
The first 4 methods of any type will always be ToString, Equals, GetHashCode and Finalize. These methods are virtual inherited from System.Object. The Method2 slot has a duplicate, but both point to the same method handle. Explicitly encoded .cctor and .ctor will be grouped with static and instance methods respectively.
Method descriptor
A method descriptor (MethodDesc) is an encapsulation of a method implementation as understood by the CLR. There are many types of method descriptors that support calls to various implementations of external interactions, in addition to managed implementations. In this article, we will only consider MethodDesc-driven code in the context of Figure A as shown in Figure 3. MethodDesc is generated as part of the class loading process and initially points to an intermediate language (IL). Each method descriptor of the MethodDesc method is filled with PreJitStub content, which is responsible for enabling JIT compilation. Figure 12 shows a typical view. The entry in the method table slot actually points to a stub instead of the actual MethodDesc data structure. This record is located at a negative offset of 5 bytes from the real MethodDesc and is part of the 8 byte pad inherited by each method. These 5 bytes contain instructions for calling the PreJitStub routine. This 5-byte offset can be seen from the output of DumpMT (for MyClass in Figure 11) of SOS, since MethodDesc is always 5 bytes after the location of the method slot table specified in the entry. Before the first call, the compilation JIT routine is called. After compilation, 5 bytes containing the call instruction will be overwritten by the unconditional jump command to the compiled code in the x86 architecture. since MethodDesc is always 5 bytes after the location of the method slot specified in the table entry. Before the first call, the compilation JIT routine is called. After compilation, 5 bytes containing the call instruction will be overwritten by the unconditional jump command to the compiled code in the x86 architecture. since MethodDesc is always 5 bytes after the location of the method slot specified in the table entry. Before the first call, the compilation JIT routine is called. After compilation, 5 bytes containing the call instruction will be overwritten by the unconditional jump command to the compiled code in the x86 architecture.
Figure 12 The method descriptor The
code disassembly pointed to by the entry in the table of method slots in Figure 12 will show a call to PreJitStub. Here's the abbreviated disassembly output to JIT compilation for Method2:
!u 0x00955263
Unmanaged code
00955263 call        003C3538        ;call to the jitted Method2()
00955268 add         eax,68040000h   ;ignore this and the rest
                                     ;as !u thinks it as code
Now let's run the method and disassemble the same address:
!u 0x00955263
Unmanaged code
00955263 jmp     02C633E8        ;call to the jitted Method2()
00955268 add     eax,0E8040000h  ;ignore this and the rest
                                 ;as !u thinks it as code
Only the first 5 bytes at this address are code; the rest contains data from the Method2 method of the method descriptor. The "! U" command is not aware of this and generates meaningless code, that is, you can ignore everything after the first 5 bytes.
CodeOrIL before JIT compilation contains the relative virtual address (RVA) of the method implementation in the intermediate language (IL). This field is set to indicate that this is intermediate code, the CLR updates this field with the address of the JIT-compiled code after compilation on demand.Let's select the method from those that are output and remove the MethodDesc dump using the DumpMT command before and after the JIT compilation:
!DumpMD 0x00955268
Method Name : [DEFAULT] [hasThis] Void MyClass.Method2()
MethodTable 9552a0
Module: 164008
mdToken: 06000006
Flags : 400
IL RVA : 00002068
After compilation, MethodDesc looks like this:
!DumpMD 0x00955268
Method Name : [DEFAULT] [hasThis] Void MyClass.Method2()
MethodTable 9552a0
Module: 164008
mdToken: 06000006
Flags : 400
Method VA : 02c633e8
The flag field in the method descriptor is encoded to store information about the type of method, such as a static, instance, interface method, or COM implementation.
Let's look at another complex aspect of the method table: implementing interfaces. It is made to look simply at a controlled environment, understanding all the difficulties in the presentation process. Next, we will look at how interfaces are placed and how the distribution of interface methods really works.
IVMap and Interface Map
At offset 12 in the method table is an important pointer, IVMap. As shown in Figure 9, IVMap points to the application domain level mapping table, which is indexed using the process level interface identifier. Each interface implementation will have an entry in IVMap. If MyInterface1 is implemented by two classes, then there will be two entries in the IVMap table. The record will point back to the beginning of the subordinate table built into the MyClass table of methods (MethodTable), as shown in Figure 9. This is the reference by which the interface method is distributed. IVMap is created based on the interface map information embedded in the method table. The interface map is created on the basis of class metadata during the construction of the method table. Once the type load is completed, only IVMap is used in the distribution method. The mixing field 28 in the method tables (Interface Map) points to the InterfaceInfo record embedded inside the method table. In our case, there are two entries for each of the two interfaces implemented by the MyClass class. The first 4 bytes of the first InterfaceInfo record point to a handler of the type (TypeHandle) of the MyInterface1 interface (see Figure 9 and Figure 10). The next word (2 bytes) is occupied by flags (where 0 is inherited from the parent class and 1 is implemented in the current class). The next word immediately after the flags is the initial slot, which is used by the class loader to place the subordinate table of the interface implementation. For MyInterface1, the value is 4, which means that slots 5 and 6 indicate implementation. For the MyInterface2 interface, the value is 6, that is, slots 7 and 8 indicate implementation. The classloader dualins the slots if necessary to create the illusion that each interface gets its own implementation, although it is physically mapped to the same method descriptor. In the MyClass class, the MyInterface1.Method2 method and the MyInterface2.Method2 method will point to the same implementation.
Distribution of the interface method is performed through IVMap, while direct methods are distributed via the MethodDesc address stored in the corresponding slot. As noted earlier, the .NET Framework uses the fastcall calling convention. The first two arguments are usually passed through the ECX and EDX registers, if possible. The first argument to the instance method is always the "this" pointer, which is passed through the ECX register, as shown by the instruction "mov ecx, esi":
mi1.Method1();
mov    ecx,edi                 ;move "this" pointer into ecx
mov    eax,dword ptr [ecx]     ;move "TypeHandle" into eax
mov    eax,dword ptr [eax+0Ch] ;move IVMap address into eax at offset 12
mov    eax,dword ptr [eax+30h] ;move the ifc impl start slot into eax
call   dword ptr [eax]         ;call Method1
mc.Method1();
mov    ecx,esi                 ;move "this" pointer into ecx
cmp    dword ptr [ecx],ecx     ;compare and set flags
call   dword ptr ds:[009552D8h];directly call Method1
This disassembled code demonstrates that direct calls to MyClass instance methods do not use offset. The JIT compiler writes the address of the method descriptor directly in the code. Interface-based distribution occurs through IVMap and requires slightly more instructions than direct distribution. One of the instructions is used to get the IVMap address, and the other to get the initial implementation slot in the method slot table. Also, casting an instance of an object to an interface is simply copying this pointer to the target variable. In Figure 2, “mi1 = mc;” uses a single instruction to copy OBJECTREF from mc to mi1.
Virtual distribution
Let's take a look at virtual distribution now and compare it with direct and interface-based distribution. Here's the disassembly for invoking the MyClass.Method3 virtual method from Figure 3:
mc.Method3();
Mov    ecx,esi               ;move "this" pointer into ecx
Mov    eax,dword ptr [ecx]   ;acquire the MethodTable address
Call   dword ptr [eax+44h]   ;dispatch to the method at offset 0x44
Virtual distribution always occurs through a fixed slot number, regardless of the pointer in the method table in the received hierarchy of the class (type) implementation. During the construction of the method table, the class loader replaces the parent implementation with an overridden child implementation. As a result, method calls are encoded against the parent object distributed to the implementation of the child object. Disassembly demonstrates that distribution occurs through slot number 8 in the debugger memory window (as seen in Figure 10) as well as in the DumpMT output.
Static Variables
Static variables are an important part of the data structure of a method table. They are located as part of the method table immediately after the array of method table slots. All primitive static types are embeddable, while static value objects such as structures and reference types are addressed through the OBJECTREF created in the handler tables. The OBJECTREF in the method table indicates an instance of the object created on the heap. Once created, OBJECTREF in the handler table will keep the instance of the object on the heap unscathed until the application domain is unloaded. In Figure 9, the static string variable str, points to OBJECTREF in the handler table, which points to MyString in the garbage collector heap.
Eeclass
EEClass appears before the creation of the method table and, in combination with the method table, is the CLR version of the type declaration. In fact, the EEClass and the method table are logically the same data structure (together they represent the same type) and were separated based on the frequency of use. Fields used are often located in the method table, and fields used are not often found in EEClass. So the information (such as names, fields and offsets) necessary for JIT compilation of functions appears in EEClass, however, the data necessary at runtime (such as vtable slots and garbage collector information) is located in the method table.
For each type of application loaded into the domain, one EEClass will be created. This includes interfaces, classes, abstract classes, arrays, and structures. Each EEClass is a tree node tracked by the execution engine. The CLR uses this network to navigate through EEClass structures for such purposes as loading a class, building a method table, type checking, and type casting. The relationship of the child with the parent between EEClass is established on the basis of the inheritance hierarchy, in turn, the relationship of the parent with the child is established on the basis of the combination of the inheritance hierarchy and the sequence of loading classes. New EEClass nodes are added, relationships between nodes are superimposed, and new relationships are established during the execution of managed code. There are also horizontal connections with the EEClass twins on the network. EEClass has three fields for managing node relationships between loaded types: the ParentClass parent class, the SiblingChain twin chain, and the ChildrenChain child chain. See Figure 13 for a schematic representation of an EEClass in the context of the MyClass class from Figure 4.
Figure 13 shows only a few fields related to this discussion. Because we missed some fields in the view, we did not show offsets in this figure. EEClass has circular references to the method table. EEClass also points to method descriptor data blocks located in the default access domain's heap of frequent access. The reference to the list of field descriptor objects located on the heap of the process provides information about the placement of fields during the construction of the method table. EEClass is located on a heap with a low access frequency of the application domain, so that the operating system can manage memory pages more efficiently, and as a result, the workspace is reduced.
Figure 13 EEClass View
Other fields shown in Figure 13 are secondary and require no explanation in the context of MyClass (Figure 3). Let's look at the actual physical memory by dumping the EEClass using SOS. Run the program from Figure 3 after setting the breakpoint on the line mc.Method1. First, get the EEClass address for MyClass using the Name2EE command:
!Name2EE C:/Working/test/ClrInternals/Sample1.exe MyClass
MethodTable: 009552a0
EEClass: 02ca3508
Name: MyClass
The first argument to the Name2EE command is the name of the module, which can be obtained from the DumpDomain command. Now we know the address of the EEClass, and we get a dump of the EEClass class itself:
!DumpClass 02ca3508
Class Name : MyClass, mdToken : 02000004, Parent Class : 02c4c3e4
ClassLoader : 00163ad8, Method Table : 009552a0, Vtable Slots : 8
Total Method Slots : a, NumInstanceFields: 0,
NumStaticFields: 2,FieldDesc*: 00955224
      MT    Field   Offset  Type           Attr    Value    Name
009552a0  4000001   2c      CLASS          static 00a8198c  str
009552a0  4000002   30      System.UInt32  static aaaaaaaa  ui
Figure 13 and the output of the DumpClass look basically the same. The metadata token (mdToken) represents the MyClass index in the memory mapping metadata tables of the PE module of the file, the parent class points to System.Object. The twin chain (Figure 13) demonstrates that it is loaded as a result of loading the Program class.
MyClass has eight vtable slots (methods that can be distributed virtually). Despite the fact that Method1 Method2 methods are not virtual, they will be considered as virtual methods when performing distribution via interfaces and therefore are added to the list. Add .cctor and .ctor to the list, and you get only 10 (0xA) methods. The class has two static fields listed at the end. MyClass has no instance fields. The remaining fields require no explanation.
Conclusion
Our tour of some of the most important internal components of the CLR has ended. Obviously, there is much more left to be considered, and what should be considered more deeply, but we hope this will give you some impression of how it works. A lot of the information presented here will probably be changed in future releases of the CLR and the .NET Framework. But still, if the data structures discussed in this article are subject to change, the concepts will remain unchanged.