Verification of a Web-Based Busbar Loss and Heating Calculator According to GOST 35224
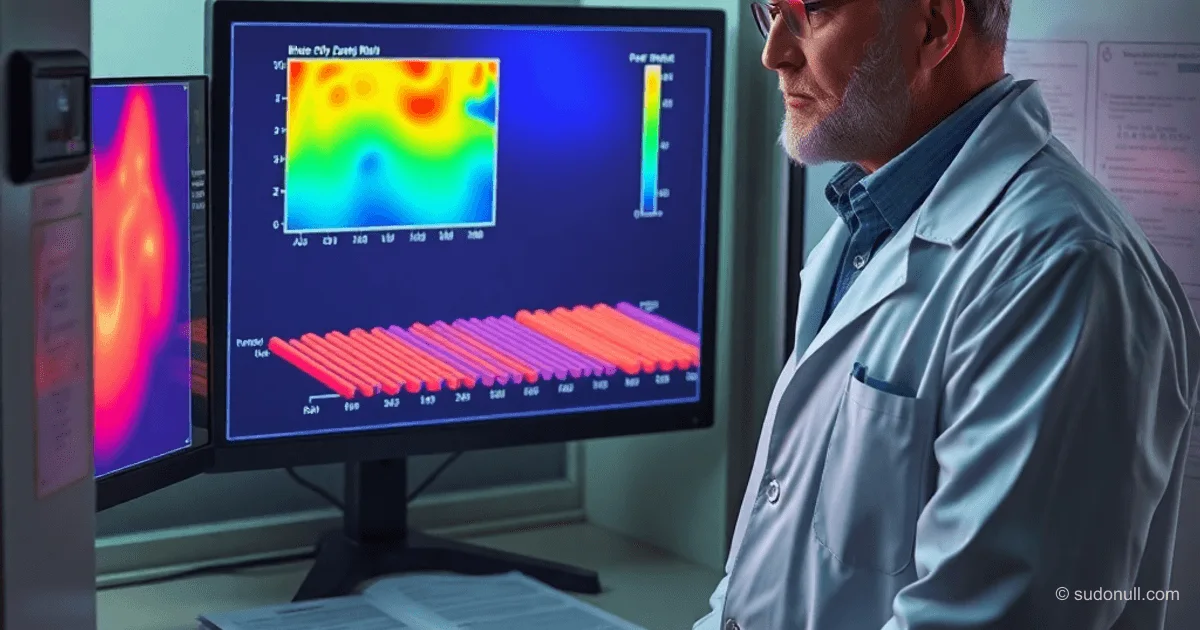
This web application for calculating losses in low-voltage switchgear (LVSG) busbars uses a client-server architecture. The JavaScript frontend handles input of cabinet, busbar, and device parameters, visualization of results, and a 2D thermogram of temperature distribution. The Python backend implements the physical calculation algorithms.
Users input parameters and instantly receive: power losses for busbars and devices, internal cabinet temperature, step-by-step calculations, and a color thermogram.
Physical Calculation Model
Heat Generation Accounting for Temperature
Joule-Lenz power is adjusted for the temperature dependence of resistance:
R(T) = R₂₀ × [1 + α × (T - 20°C)]
where α = 0.00393 1/°C for copper. This accounts for feedback: heating increases R, which in turn increases heat generation.
Alternating Current Effects
Skin effect and proximity effect are modeled with coefficients:
- k_skin: 1.0 for thickness ≤10 mm, up to 1.2–1.3 for greater thicknesses;
- k_prox: 1.1–1.6 depending on busbar arrangement.
Effective resistance: R_EFF = R₂₀ × (1 + αΔT) × k_skin × k_prox.
Heat Exchange Area
For a single busbar: A = 2 × (w × l + h × l + w × h).
In a busbar pack:
- Gap ≥ thickness: sum of individual areas;
- Tightly packed: external surfaces with a coefficient of 0.7.
Heat Dissipation Mechanisms
Convection: 6.5 W/(m²·K) vertically, 5.0 horizontally; +20–50% with ventilation. Radiation: +15% to the coefficient. This approach ensures accuracy for preliminary assessments, complementing IEC 60890.
Verification Conditions
Testing according to GOST 35224-2024 (IEC TR 60890:2022, Annex E):
| Parameter | Value |
|-----------|-------|
| T_air | 55°C |
| T_busbar | 70°C |
| Material | Copper |
| Shape | Rectangular |
| Orientation | Horizontal |
| Busbars/phase | 1–2 |
| Frequency | 50 Hz |
| Length | 1 m |
42 tests (21 per configuration) for cross-sections of 24–1200 mm².
Metrics: MAPE, RMSE, R².
Results for a Single Busbar
- MAPE: 4.3%;
- RMSE: 1.0 W/m;
- R²: 0.979.
Deviation ≤7%, physical dependency accurately reproduced. Suitable for GOST-based calculations.
Results for Two Busbars
- MAPE: 6.7%;
- RMSE: 1.1 W/m;
- R²: 0.987.
Conservative bias, maximum at medium cross-sections. Proximity effect modeling is correct.
Application Areas
The tool is useful for:
- Layout analysis;
- Assessing the impact of cross-section, material, orientation;
- Non-standard conditions (vertical busbars, aluminum, different ambient temperatures);
- Preliminary calculations with GOST-level accuracy.
Key Takeaways
- R² 0.979–0.987 confirms the physical adequacy of the model.
- MAPE 4–7% allows for engineering estimates without full simulation.
- Accounting for skin effect, proximity, and heat exchange extends applicability beyond GOST tables.
- Web-based format ensures speed and accessibility without software installation.
- Conservative results enhance selection safety.
— Editorial Team










No comments yet.