DevExtreme: filtering data on a chart
Filtering data by argument is one of the most common tasks when working with a chart. That is why it is so important to have simple and convenient filtering methods in each library designed for data visualization.
In this article, we will look at ways to filter data by argument in DevExtreme Data Visualization graphs , namely in the dxChart component . And here are the ways:
- use of options min and max;
- Using the API of the zoomArgument method
- using the built-in zooming and scrolling
Using the min and max options

This method of filtering data is the simplest because it is based on the use of graph options directly. It filters the data at the initial stage, when plotting. To do this, it is enough to write the corresponding fields min and max in the arguments axis options :
argumentAxis: {
   min: 1,
   max: 5
}
These options can also be used at later stages of the chart display using the option method's built-in API for dynamically changing options:
chartInstance = $(“.chartContainer”).dxChart(“instance”);
chartInstance.option(“argumentAxis”, { min: 1, max: 5 });
It is seen that this method is simple, but it is intended for the initial data filtering, and is inconvenient for the subsequent one. The following methods are more suitable for filtering in run-time mode.
Using the zoomArgument API
This API method is an improvement on the previous method and allows filtering data in run-time mode. The first argument this method takes a new minimum on the axis, and the second - a new maximum:
chartInstance = $(“.chartContainer”).dxChart(“instance”);
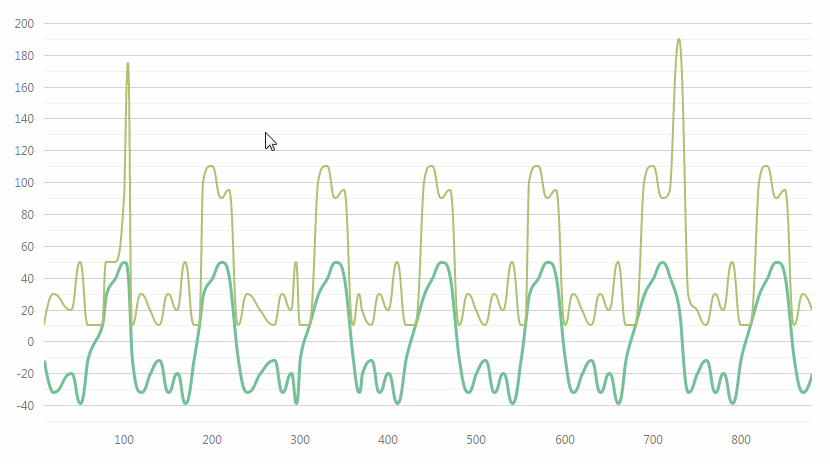
chartInstance.zoomArgument(1, 5);The method is very convenient for use in conjunction with filtering tools. For example, here is how it works with the dxRangeSlider component :
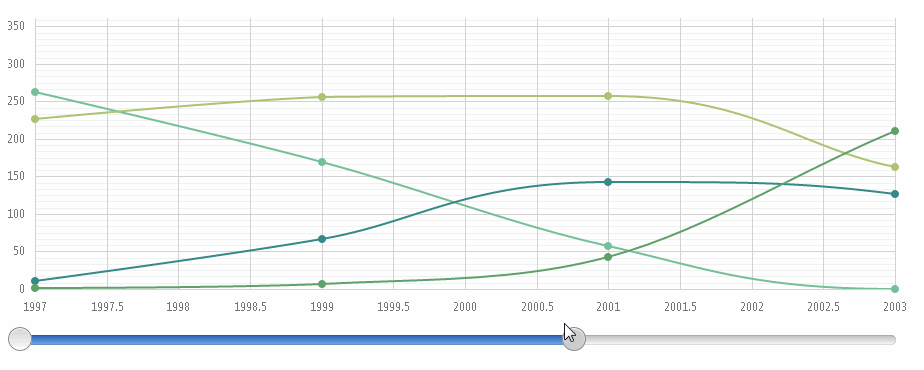
In order to achieve such work of the components, you need to register the connecting code to change the state of the slider:
onValueChanged: function (arg) {
chartInstance.zoomArgument(arg.start, arg.end);
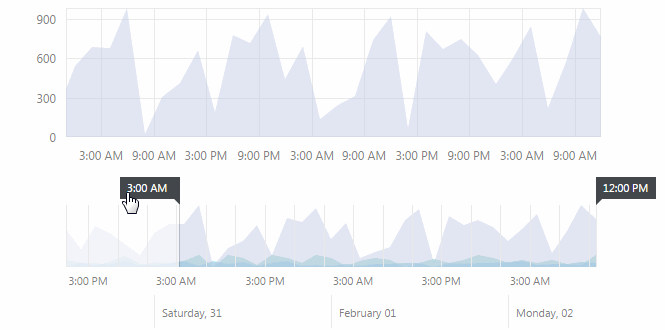
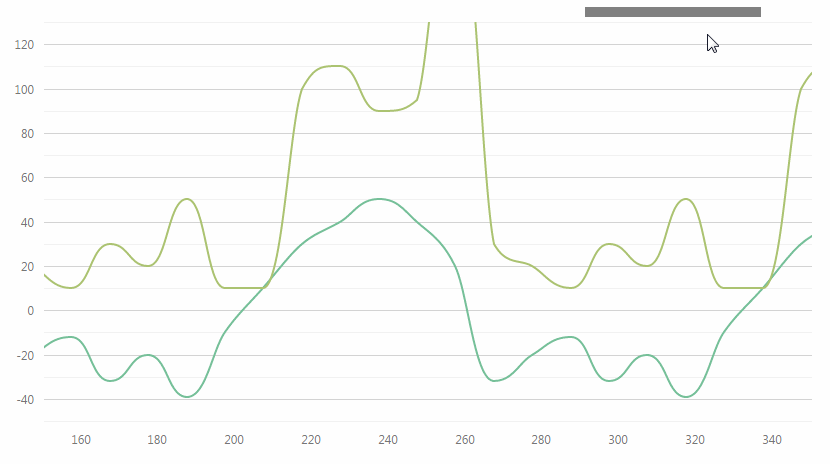
}You can go even further and use the special filtering tool in DevExtreme Data Visualization - the dxRangeSelector component .

Its difference from the slider is that you can display a filtered graph in the background of dxRangeSelector .

Here is the middleware between these components:
onSelectedRangeChanged: function (arg) {
   chartInstance.zoomArgument(arg.startValue, arg.endValue);
}
The zoomArgument method is great for working with filtering tools. If you do not plan to use such tools, then the following method is suitable.
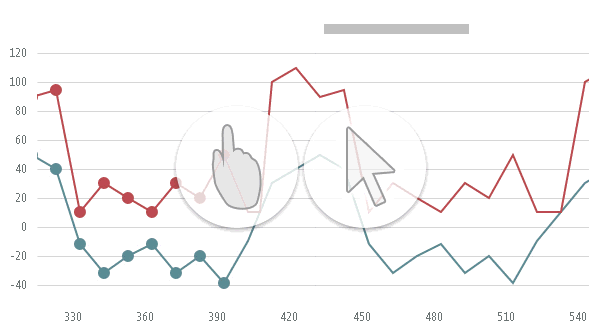
Using the built-in zooming and scrolling features
In the new version 14.2, it became possible to filter data “out of the box” by simply enabling a certain mode in the options.
You can enable the zooming mode for the graph, as well as the scrolling mode , which support both mouse and finger manipulations on touch devices:
zoomingMode: “all” | ”mouse” | ”touch” | ”none”,
scrollingMode: “all” | ”mouse” | ”touch” | ”none”
If desired, you can display the built-in scroll bar next to the chart, the appearance and position of which can be adjusted:
scrollBar: {
   visible: true
}
This “out of the box” method will help you filter data on a chart without too much effort.
Conclusion
There are several ways to filter data for the dxChart component . You can always choose the option that is convenient for you.

If you need to do this at the initial stage of the chart display, then use the min and max options . The zoomArgument API method is suitable if filtering tools such as dxRangeSlider or dxRangeSelector are used . If you need a simple way out of the box that supports both mouse and finger manipulation, the built-in zooming and scrolling capabilities are great.