Bezier de Casteljo curves. Canvas HTML5
Foreword
In my free time I decided to do an interesting thing. The idea came to my mind to write a small framework for canvas (although it’s a bicycle, it’s also interesting). It came to Bezier curves.
I decided to somehow embellish the built-in solution, but it has one drawback. The problem is that the functions of the quadratic and cubic curve give a ready-made result that cannot be edited. I needed to outline the curve gradually or to outline only part of the curve, not to mention the fact that I wanted to outline curves of a higher order than 2-3 degrees.
I started to google. Found an interesting article on Habré. But my knowledge of mathematics did not allow me to transform it to my needs, in addition, timers are used there, because of which it will not work to stop the animation on time.
I'm starting to write from scratch.
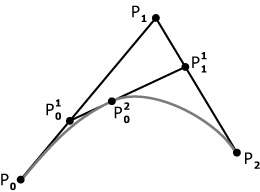
It turned out not so scary. The essence of the de Costeljo algorithm is simple in itself, so why use such an ingenious formula? So I will not.
I’ll briefly describe the algorithm, and then the code example.
The function that calculates the curve returns only a point by offset (that is, by the distance from the beginning of the curve in percent). Gradually increasing the offset we get more and more points. When you want, you can stop the algorithm, beauty! And you don’t need a bunch of timers, just one setInteval that will gradually query and outline the points.
The getPointOnCurve function recursively computes segments from points passed to it.
After calculating, by displacement it finds new points on these segments, which it passes on to itself. Continuing until a point is found on the curve that it returns.
//все нужные функции хранятся в объекте formula
formula.getPointOnCurve = function(shift,points){
        if(points.length == 2){
            return this.getPointOnLine(shift,points);
        }
        var pointsPP = [];
        for(var i = 1;i < points.length;i++){
 //функция getPointOnLine вычисляет точку на отрезке, по смещению. она рассмотрена ниже
            pointsPP.push(this.getPointOnLine(shift,[
                points[i - 1],
                points[i]
            ]));
        }
        return this.getPointOnCurve(shift,pointsPP);
};
Helper function getPointOnLine:
formula.getPointOnLine = function(shift,points){
//подразумевается, что в points передан массив вида: [[x0,y0],[x1,y1]]
        return [
            (points[1][0] - points[0][0]) * (shift / 100) + points[0][0],
            (points[1][1] - points[0][1]) * (shift / 100) + points[0][1]
        ];
};
And here is the drawing itself:
//создаем массив с контрольными точками
var points = [
        [10,50],
        [40,-40],
        [190,180],
        [40,-60],
        [80,130],
        [10,50]
];//так выглядит лепесток
var shift = 0;
var step = 1;//переменная shift будет изменяться с шагом step
var timer = setInterval(function(){
    context.beginPath();
    context.moveTo(points[0][0],points[0][1]);
    if(shift > 101){
        shift = 101;
    }
    for(var i = 0;i <= shift;i += step){
        var coord = formula.getPointOnCurve(i,points);
        context.lineTo(coord[0],coord[1]);
    }
    context.closePath();
    if(shift <= 100){
        shift += step;
    }
},fps)
And, of course, an example .
I hope someone helped, because I myself could not figure it out for a long time.