Forewarned is forearmed. Part 3
- Part 1: photosynthesis, all living things breathe, shock measurements .
- Part 2: ventilation of rooms, harm to assemblies, the advantage of two instruments for conducting experiments .
- Part 3: graphs, calibration, analysis of the device, principle of operation, fermentation.
Soon…
38 parrots
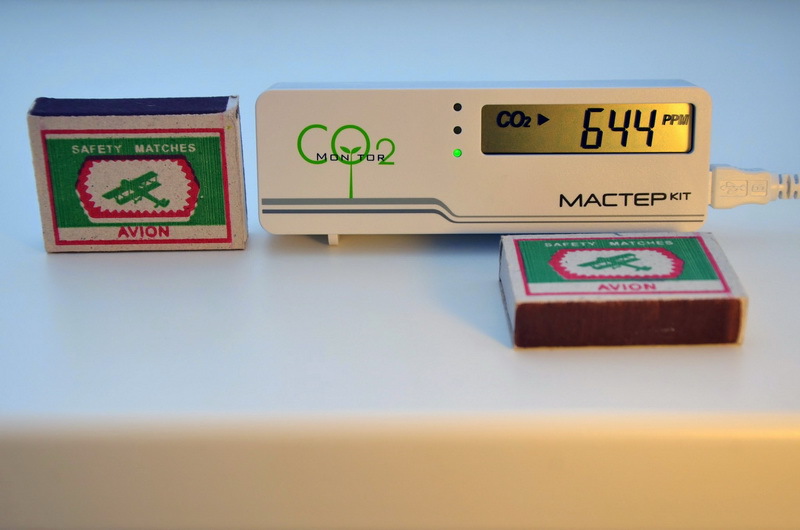
The boa constrictor in parrots looks much longer, but in our case it is a fairly large unit. To determine the dimensions of the MT8057 meter we use a classic matchbox or a familiar ruler: 116x38x24 mm.
I do not ask you where you were. I ask where are you coming from!
It turned out that the data from the device can be automatically written to a computer and plotted to determine exactly where a particular carbon dioxide concentration comes from.
It was discovered by chance. When connecting the power from the USB port, the computer said: “Jin-jin!”
The device, I thought, was not mistaken. The search for the driver led to two slightly different versions of the program for working with this device.
Using the program, you can see real and archived values, configure the program and calibrate the device, and obtain tabular values of the measured parameters.
The program has been tested on Windows XP and 7.
He knows little, but for sure!
There are many devices that differ in measurement accuracy, functionality and, accordingly, price.
Therefore, to please everyone is too expensive a pleasure! Using experiments and graphs as an example, it is shown that in most cases, accuracy of 100 ppm is sufficient for domestic use, especially since there are such phenomena as the lack of factory calibration on the instruments of some manufacturers, the natural departure of the sensor readings, the lack of access to the reference air for manual calibration, triggered automatic calibration in a room where ventilation is not performed, unstable carbon dioxide content in street air used for the reference * .
The influence of these factors in some cases, in total, exceeds the measurement accuracy of particularly accurate instruments and does not allow determining the true concentration after some time of operation. If there are doubts about the accuracy of the readings, then you can calibrate the device.
Calibration
As a result of natural care, the sensor readings with prolonged use of the device may deviate from the true value. To return them to normal, a calibration is performed - they inform the device that the value that he now “sees” is true. Deviation can be seen with good ventilation, when the concentration should drop to about 400 ppm * .
Calibration is manual and automatic.
Manual is done using the program.
As a reference source of carbon dioxide, a spray can be used with a concentration of 1000 ppm, any other source with a stable concentration (its value is indicated in the settings window) or street air - it is believed that it has about 400 ppm * .
You can calibrate using any other instrument that has high accuracy by placing them in one sealed bag. After the termination of the change in readings (approximately 30 minutes), using the program, the testimony of the reference instrument is recorded to the instrument under test.
If street or other air entering through openings in the device case is used, then calibrate about 30 minutes.
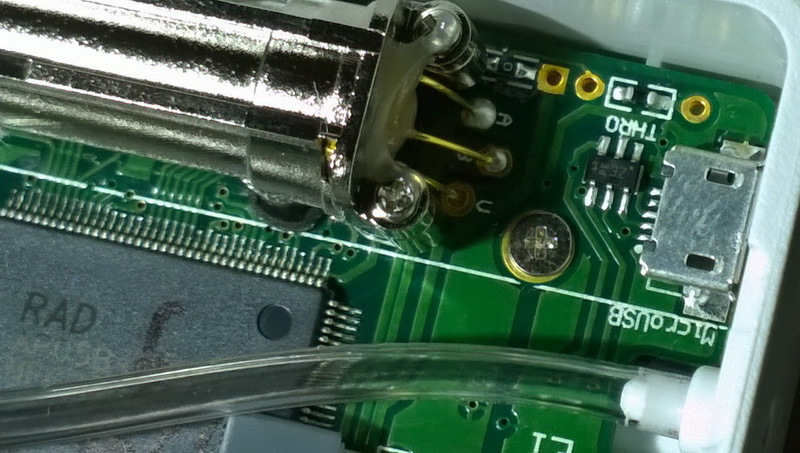
If the source of the reference gas is connected to the calibration hole (the input is located next to the USB connector on the device) and the gas enters directly into the sensor through a special tube, the calibration process continues for 5 minutes.
Automatic on / off in the device menu “8bc”. It is believed that at least once a week the room was ventilated and street air with a “reference” concentration of 400 ppm* reached the device. When this mode is switched on, the device counts the days of its operation and fixes the minimum measured value of carbon dioxide concentration. This minimum value is accepted as a reference. With large deviations of the former reference value and the newly measured, a significant jump in the readings is possible. To prevent this from happening, the former value is changed by no more than 30 or 50 ppm (the exact value can be obtained from the manufacturer or revealed by observing changes in readings).
If the room is not ventilated, it is advisable to turn off the automatic calibration. If the correction has already occurred, you can always reset to the factory settings and, if necessary, perform a manual calibration.
* Doubts about the 400 ppm benchmark.
1. The recently published results of changes in carbon dioxide concentrations over the course of the year, shown in NASA's “ A Year in the Life of Earth's CO2 ”, cast doubt on the feasibility of using street air as a 400 ppm reference, especially for instruments with high accuracy.
2. The concentration of carbon dioxide on the planet changes cyclically over the years, now we are on the rise.
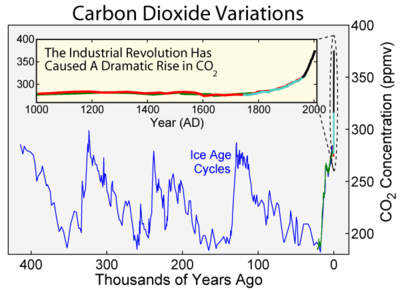
3. The Keeling graph in recent years has become quite dynamic, and the background concentration over the lifetime of the device can change significantly.

4. Measurements for the Keeling graph are made on Mount Mauna Loa, the island of Hawaii. But the concentration of carbon dioxide depends on the amount of air emissions in a particular place. Therefore, in rural areas, the background value is one, in small towns another, in large cities a third.
5. The level of carbon dioxide concentration depends on the direction and speed of the wind - this can explain the fluctuations in the background value in large cities.
If the car with the letter "U" turned on the wipers, then it will now turn
In the tested samples, the wipers never turned on.
The instrument screen for 15 seconds shows the carbon dioxide content, then 5 seconds the air temperature.
The traffic light to the left of the indicator lights its “red-yellow-green”, which is quite enough to assess the state of the air when monitoring from a long distance - a good solution for instantly assessing the concentration of carbon dioxide.
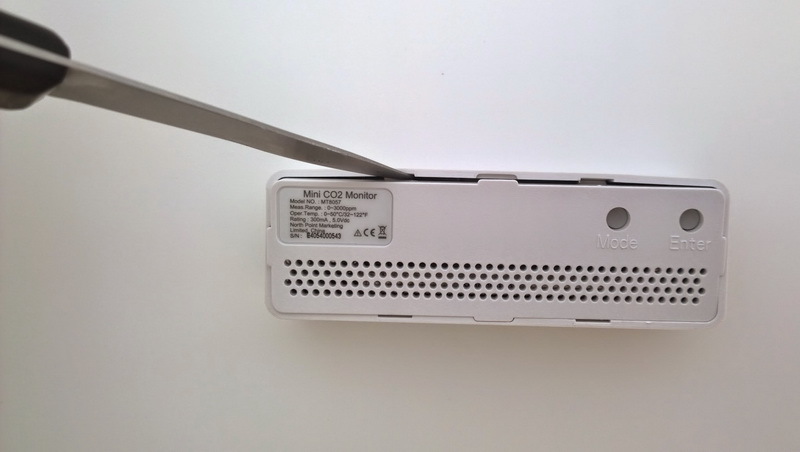
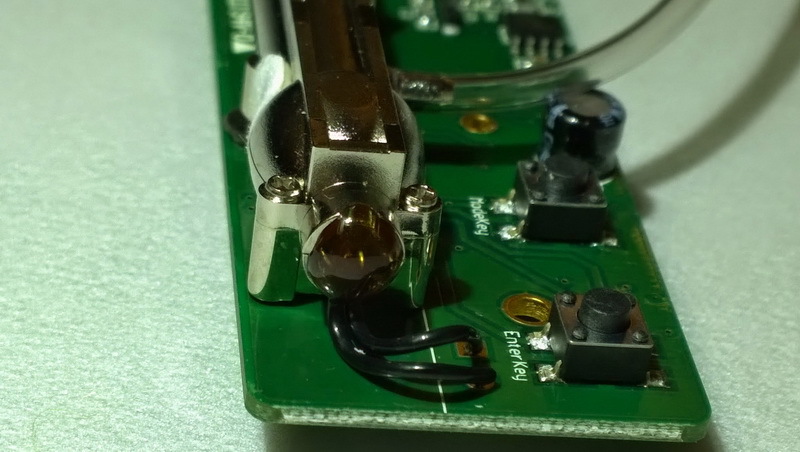
Using the “Mode” and “Enter” buttons located on the back of the device, various configuration information can be displayed on the screen:
“ ALEI ” - the height above sea level at the measurement point. Adjustment from 0 to 9900 m, tuning step 100 m, default h = 0 m.
Setting for a more accurate measurement, since when the pressure (altitude) changes, the readings must be corrected.
Example: the device was in a sealed bag and at h = 0 m showed a concentration of 664 ppm. After setting the height of 9900 m, the readings changed to 2050 ppm.
“ ALARM 1 ” - setting the first alarm level: yellow LED signal, default 800 ppm.
“ ALARM 2 ” - setting the second alarm level: red indicator light, default 1200 ppm.
“ 8bC ” - set automatic calibration of the sensor every 8 days, by default the mode is on. Installation options - enabled every 8 days, will only pass once after 8 days, disabled.
“ RcFS”- reset to factory settings.
But still, one remark in the description was noticed. Apparently, the device description was compiled for previous versions of the firmware, but for now it will be correct like this:
Display resolution: 1 ppm at 0 ~ 1,000 ppm, 5 ppm at 1001 ~ 2,000 ppm, 10 ppm at 2001 ~ 2,990 ppm.
That is, the device will show: ..., 998, 999, 1000, 1005, 1010, ... 1990, 1995, 2000, 2010, 2020, ... 2980, 2990, Hi.
When viewing data on a computer, the display resolution is higher.
Example. When the device displays 2930 ppm, the values 2931, 2936, 2939 can be seen on the computer. That is, the measured value is sent to the computer, and the indicator of the device itself resets the last digit.
For ease of viewing, the indicator housing due to the legs is tilted a little back - this is a plus. But it turned out to be a shifted center of gravity and as a result, at the initial dislocation, the power cord sometimes tries to drop the device “face up” because of its stiffness. To justify the cord, its significant length of 159 cm can be noted, which allows you to place the indicator on any convenient place on the table.
By the way, about the car with the letter “U”.
After obtaining a driver’s license, a student, a Komsomol member, an athlete (this is all one person), the first long trip was combined with a test of a carbon dioxide indicator. In the photograph taken 30 minutes after the start of the trip - concentration with the included windshield blower and 3 people in the cabin.

On the knees, the concentration reached 1400 ppm. When an unoccupied car was in the passenger compartment with the windows of one person closed, the concentration after 30 minutes was 1460 ppm - the advantages of cracks.
With an airtight cabin and poor ventilation system operation, an increased content of carbon dioxide can cause drowsiness - as a protective reaction of the body to reduce oxygen consumption in an uncomfortable environment. For testing, additional research and equipping the cabin with a similar device are necessary.
An autopsy revealed that the cause of death was an autopsy.
We will try to make sure that this phrase does not work.
The build quality was impressive.
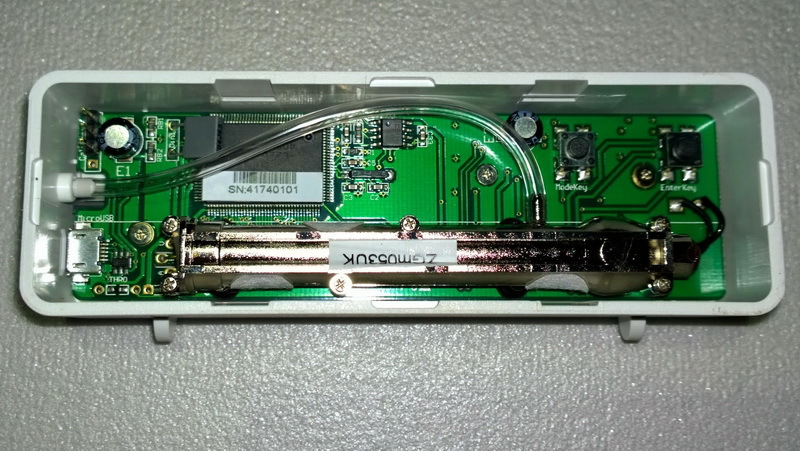
The brilliant cylinder in the far part of the picture, these are the eyes and ears of the device - an optical carbon dioxide sensor using non-dispersive infrared technology (NDIR).
This instrument uses the ZGm053UK sensor.
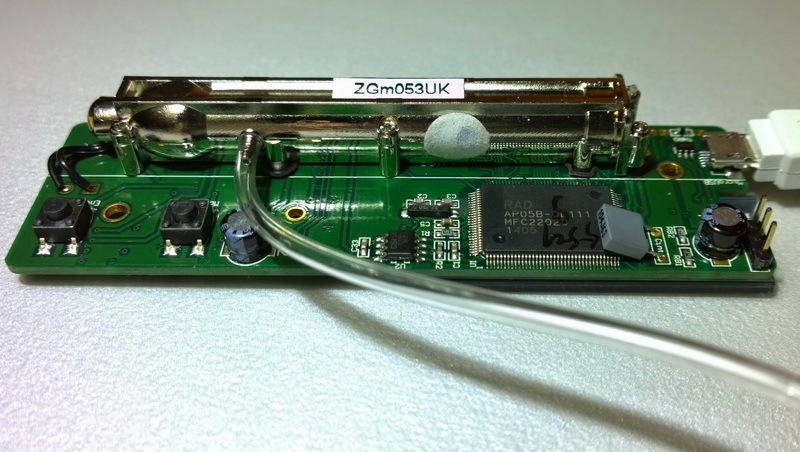
On the one side of the sensor is an infrared emitter (in this case, a lamp, but there is also an LED),
on the other - a photodetector.
For measurement, the lamp flashes every 5 seconds. In different models, the measurement period is different, for example, for high-speed devices, the time is reduced to 0.2 seconds.
You can watch the bewitching warm light of a lamp flash forever, but in the video “CO2 Meter. The emitter of the NDIR sensor ”there are only ten of them.
The lamp is a source of infrared light, which is passed through a filter that has a maximum transmission in the wavelength of interest to us (in some models, the filter is installed in front of the photosensor).
Next, the light is divided into two streams, one of which passes through the chamber with the reference gas, and the other through the chamber, into which air penetrates from the room.
The difference in the infrared radiation of the two streams reaching the photosensor determines the degree of absorption of light, which depends on the concentration of gas for which the device is designed. Since it is the difference that is measured, the method is considered quite accurate and stable.
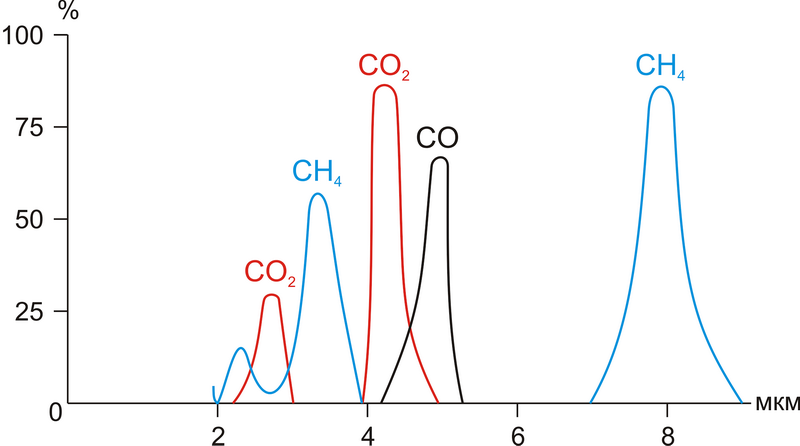
Each gas has its own absorption spectrum .
Carbon dioxide that enters the sensor chamber through three filters on the sensor housing or through a calibration tube absorbs radiation with a length of about 4.3 microns.
The device board is multilayer, parts are located on both sides, even under the indicator.

On the indicator side, the absence of several elements is noticeable, it is possible that this is a moisture sensor piping for another modification of the device.

In vino veritas, in aqua sanitas
After reading SkazochNik's comment on the first part of the article:
... I will try to let in wine.
thought why not? Moreover, apple wine was being prepared intensively , and fermentation is exactly that process, as a result of which, in addition to the necessary product, carbon dioxide is released for the next shock test of the device.
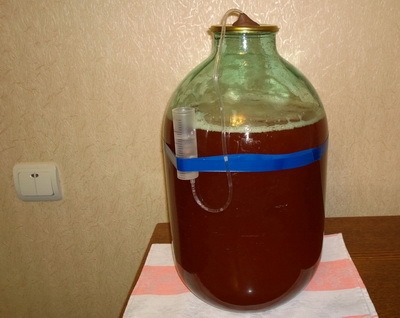
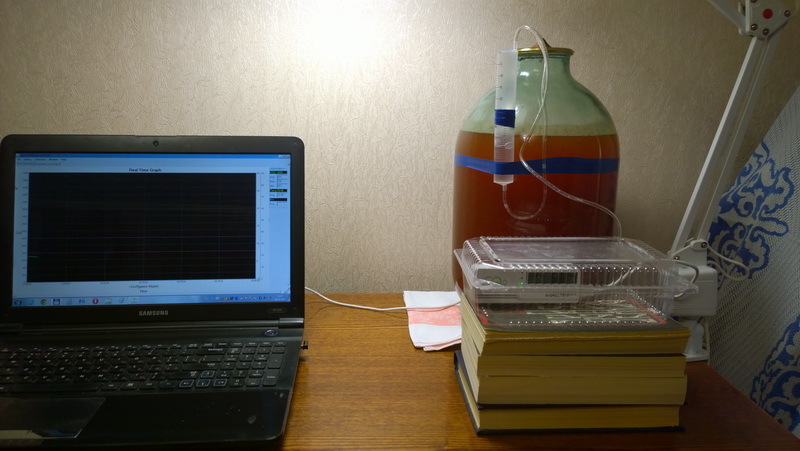
A small installation was assembled, in which the collection of gases passing through the water lock occurred. Gas flowed into a transparent container where the carbon dioxide meter was located. The meter was connected to a computer to record a process graph.
Before the experiment, it was assumed that the emitted carbon dioxide would fill the tank, and the schedule, like at the meeting, which was discussed in the second part of the article, would break the ceiling of the upper limit of measurement of the device.
The question was only how fast would this happen?
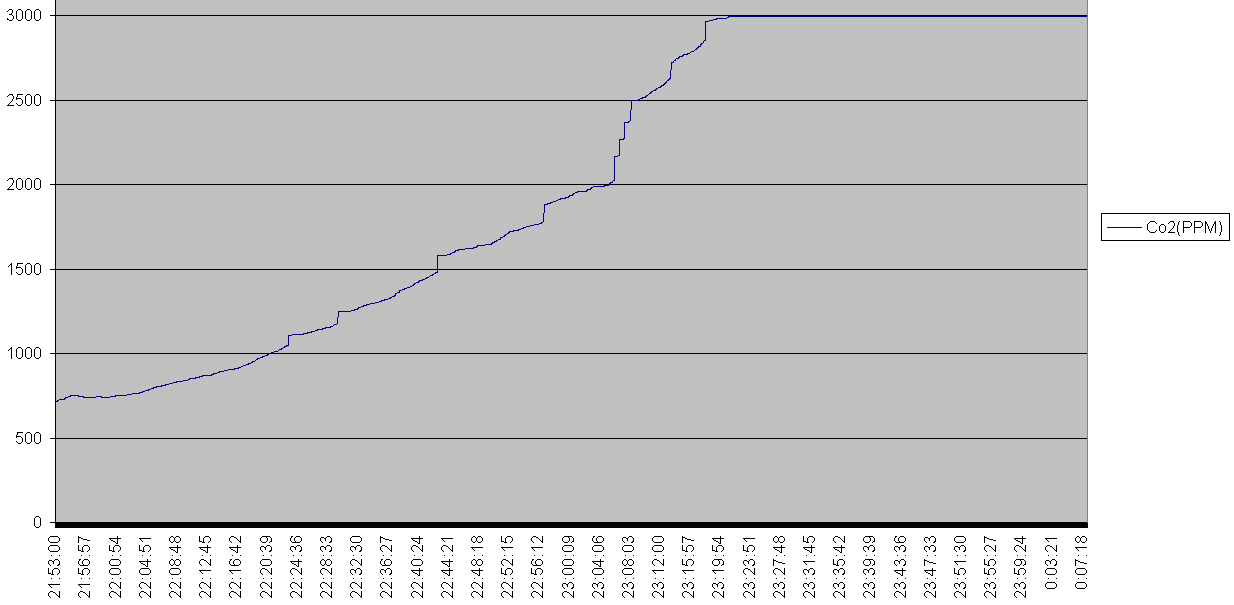
The room is ventilated, the meter is placed in the container, the program is running, the tube from the water shutter is connected to the container ... In
less than a minute, the chart rushed up. It became uninteresting, since with such a growth rate, it will go beyond the upper limit in 15 seconds. But then something strange happened. Just before the “ceiling”, the chart sharply changed direction and began a strictly horizontal movement at 2698 ppm.

Apparently, carbon dioxide “leaked” through a small hole in the place where the USB cable entered the container.

To reduce leakage, after 30 minutes of the experiment, “sealing” was carried out using a food film, after which the concentration should be at least slightly increased.

But, the level still did not change by one ppm and continued to remain strictly at a value of 2698 ppm.

Either the sealing was not quite high-quality, or not only carbon dioxide came out of the can. The second assumption is closer to the truth, since the escaping gas smells, and carbon dioxide has no smell.
At about one in the morning he went to bed, closing the door of the room, where only the bacteria remained in the wine.
Waking up at 4:18, he did not notice any changes in the schedule and removed the meter from the container, placing it on the table. Now he controls the concentration of carbon dioxide in the room. He closed the door to the room and continued to sleep.
In the morning, at about 6:50, the door to the room was opened, but they did not enter it. In this case, you can observe the average carbon dioxide background in the apartment.
At 7:29 the experiment was completed. The result is presented in the graph.

For lovers of exact sciences, in the text file “ Fermentation Data ” there are 3 second measurement results. File in the CSV format.
Conclusions.
1. The meter really works and allows you to see the invisible.
2. It is possible to determine the presence of respiration in many living organisms.
3. Thanks to the device, the concentration value is quite simple to determine and must be used in life. Both for the prevention of diseases, and for already sick, in order to identify the causes of malaise. Someone does not need this, but those who are interested in health, causes, and consequences will be interested.
The carbon dioxide concentration sensor allows you to improve the indoor microclimate or, at least, to exclude from the list of possible causes of poor health the effect of increased carbon dioxide concentration.
For many people, the sense organs and logic work perfectly, whoever does not have this, the device can become a good helper.
4. The indicator can be connected to a computer for recording measurement results for the purpose of further analysis.
According to the schedule, you can determine the characteristics of the room - the sufficiency of air volume, how quickly carbon dioxide is filled when one or several people appear, how quickly the air situation improves after a person leaves the room, what concentrations are achieved, etc.
By the nature of the change in the carbon dioxide concentration schedule, determine the quality of the ventilation system.
5. Carbon dioxide is necessary, but good should always be in moderation. Sensitivity to the concentration of carbon dioxide in people is individual and depends on many factors, including other air parameters and the state of the body. Some employees work (getting used to?) At a concentration of 1700 ppm, I have a desire to open a window at 600 ... 700 ppm. Someone faints when the others continue to stand.
6. Thanks to the measurements, you begin to realize the need for a normal volume of air and the correct operation of the ventilation system. Perhaps the saying that people behave prudently only when they have exhausted all other possibilities will cease to be valid?
7. The indicator can be used by gardeners and gardeners to monitor plants and create optimal conditions for their growth.
8. The devices that took part in the experiments have different serial numbers - a trifle that inspires confidence.
9. An old window with slots should be valued higher than a modern plastic one. Or in another way - the plastic window has much to strive for.
10. It is necessary to be closer to nature (where the concentration is in the region of 400 ppm). For a city dweller, you can arrange a healthy sleep on the balcony.
11. The largest producer of oxygen is phytoplankton, which performs photosynthesis in the seas and oceans. Therefore, one must be closer to this nature.
12. The simplest ways to improve ventilation:
- clean the mesh on the exhaust grill of the ventilation duct (the case a few days ago, when the level of carbon dioxide slowly decreased during ventilation);
- adjust the sash so that a small gap forms;
- use doors without a lower threshold;
- Do not completely close the doors;
- Do not close all windows when the air conditioner is in operation.
Many photos - instructions for using the device and its main technical characteristics, measurement results, printed circuit board and work schedules are given in the album “ Carbon Dioxide Meter ”.
Green lights at the traffic lights of your indicators!
Linkfor purchase, programs for connecting to a computer, description and technical characteristics of the MT8057 carbon dioxide detector.
PS The article “ A simple way to increase work efficiency and avoid“ wars for airing ”in the office ” was published on GT , where this indicator is described. I completely agree with the title of the article, since it is not easy to convince employees of the need to ventilate oh. I hope that with the device it will be much easier. PPS A letter came to the mail stating that there is a project on GitHub with a program for connecting the device to a computer with Linux. If anyone has the opportunity, please check the performance and unsubscribe. Link to the project: https://github.com/dmage/co2mon
Oleg Bulatov, the author of this project, is not registered on Habré, therefore, he can only answer via mail. If you have questions, ask.
Regarding the program, I wrote the following.
It works for me on Linux, but I can’t be objective, because it was written on my equipment :)
I did not find a normal specification, so something was written at random, something was spied on in the Windows version.
It does not look like a final product, then it wasn’t thought how it can be beautifully designed.
There is a program that displays something like
$ ./co2mon
04d9: a052 (bus 3, device 2) path: 1
[0x42] Temperature: 25.2250
And if you run it once a second, you get something like this:
[0x42] Temperature : 25.2250
[0x50] CO2: 1791
[0x56] (unknown):
9321 [0x41] (unknown): 0
[0x42] Temperature: 25.2250
[0x6d] (unknown): 1368
[0x50] CO2: 1791
[0x52] (unknown): 9304
[0x42] Temperature: 25.2250
[0x6d] (unknown): 1368
And next to them are scripts that draw graphs through RRDtool .
What is there for the unknown values come I did not understand. But the numbers of CO2 and temperature were plausible.
PPS Many readers ask about the place of purchase of the sensor.
In order not to find the answer as an advertisement, it is better to send everyone to the masterkit user’s PM .
About where to download programs for working with a computer. For Lunix, I advise you to try what is written in the previous addition to the article.
For Windows, the answer was given in a comment on the first article.
PPPS Anton Afanasyev confirms the operation of the meter under Lunix. This project was mentioned in PPS.
The measurement result can be viewed in real time via the Internet. Linkto the chart. When moving the cursor, data is displayed, the scale on the bottom allows you to scale the graph and move. Work in real time, printing in many formats. In general - interesting and beautiful!
Explanations
<I opened an account on rhcloud.com and did monitoring there.
+ forked the project of Oleg Bulatov and dopilil it so that in mysql inserted the data github.com/toxeh/co2mon .>
+ forked the project of Oleg Bulatov and dopilil it so that in mysql inserted the data github.com/toxeh/co2mon .>
Graph in the form of a picture at the time of receipt.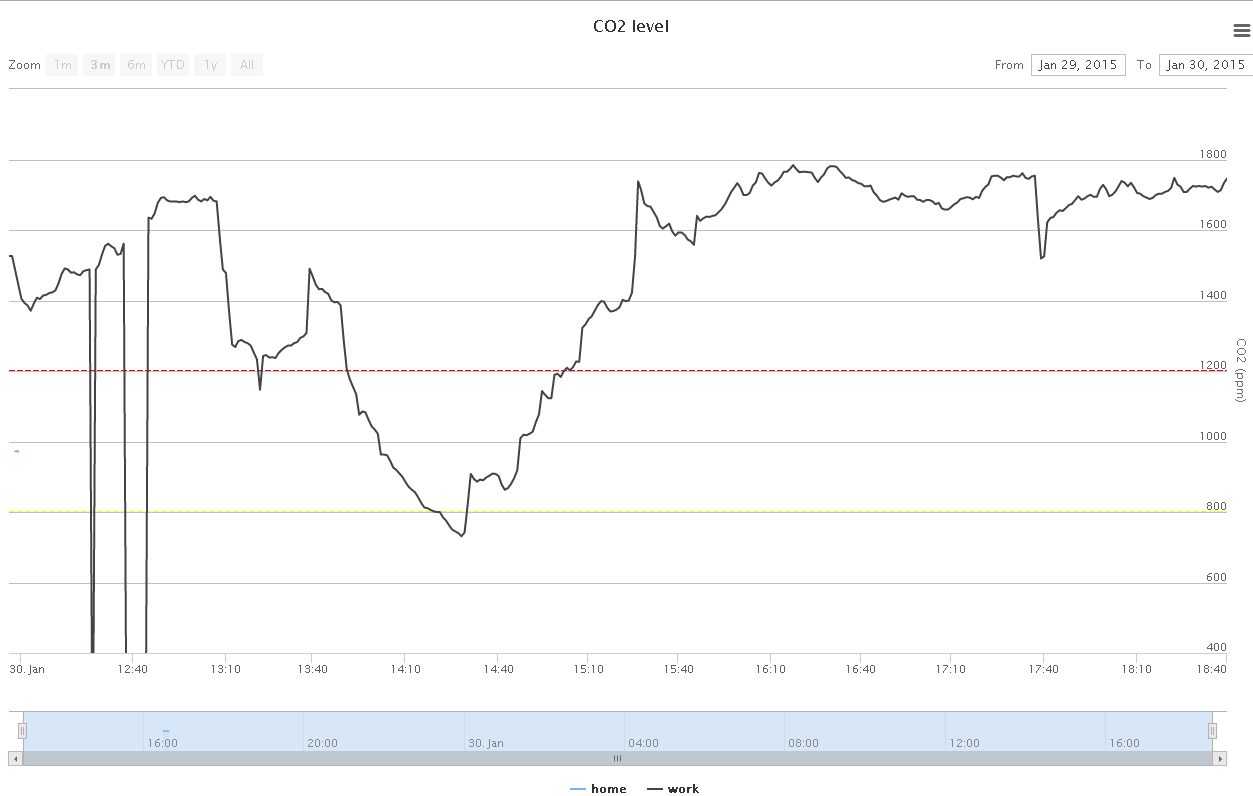
A few days later he is already different.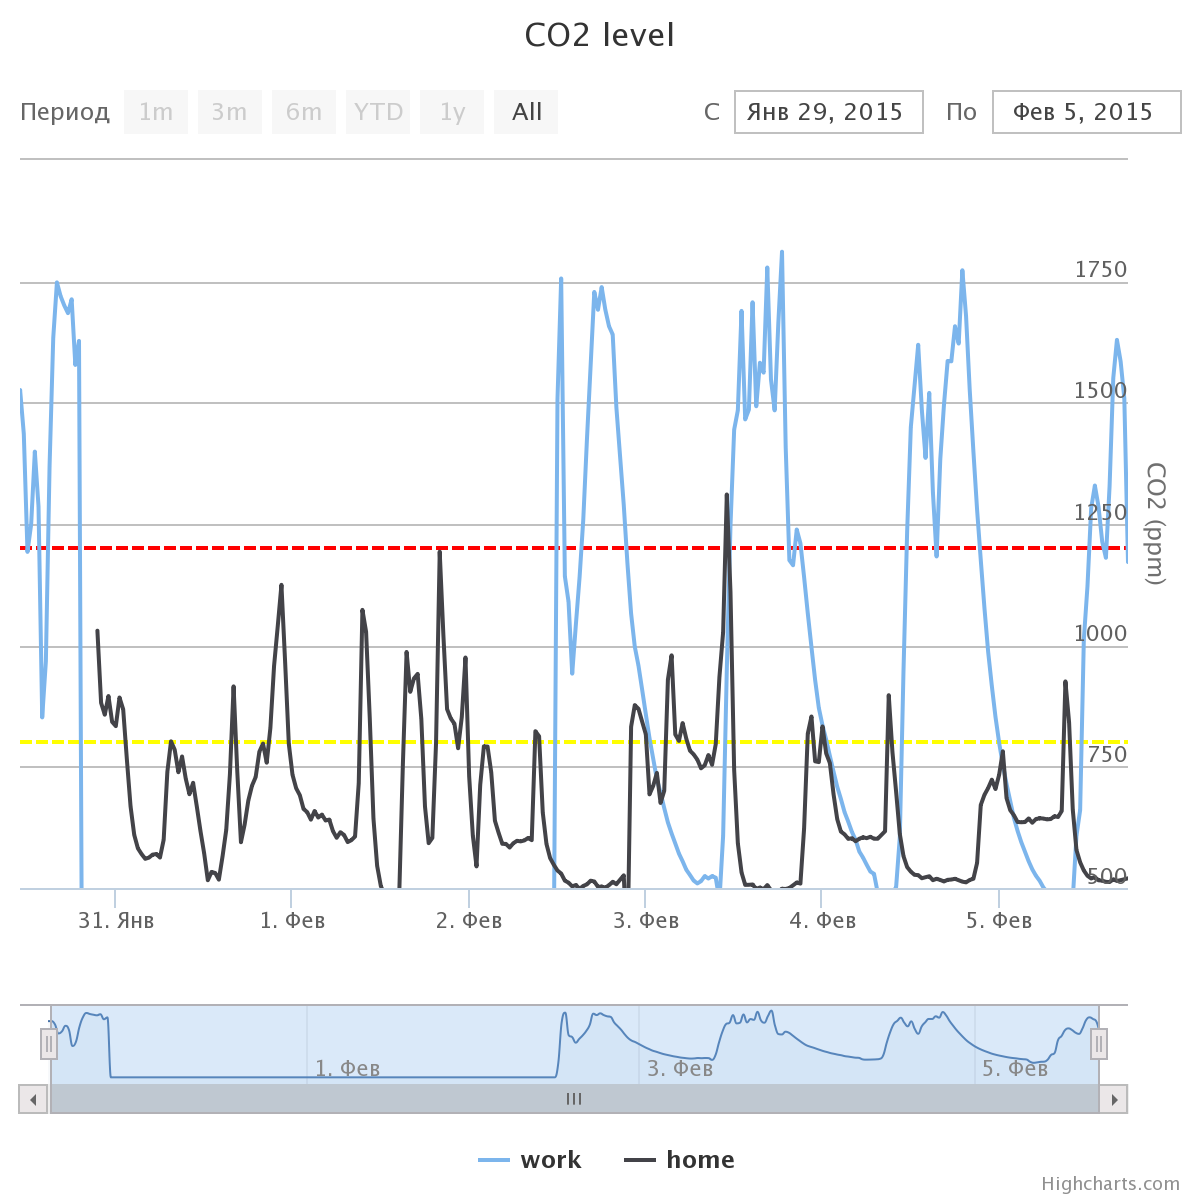
PPPPS Measurement of carbon dioxide after several days during fermentation.
On February 9, when the release of bubbles became very rare (from 4 to 15 minutes), a new measurement was made. This time the meter was placed in a plastic bag.
Photo installation.
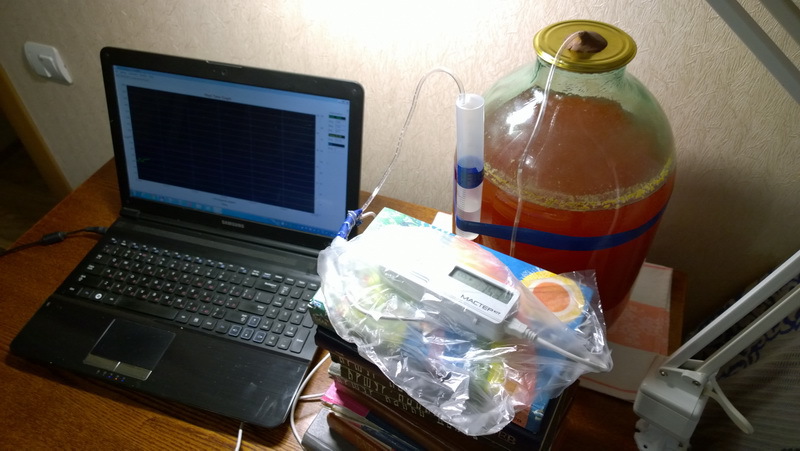
Graph with the measurement result.
← here there →