December 11, 2014 at 15:20
Assessing the effect of cache levels on I / O performance in the EMC VNX5400
Introduction
After testing and writing an article about the impact of caching mechanisms on performance in the junior model (entry level) of EMC VNXe3200 storage systems , hands began to itch periodically to do the same with its older counterparts VNX2 arrays. Recently, such an opportunity presented itself. I managed to run tests on the VNX5400. In addition to testing directly the VNX5400, we also managed to test the EMC ExtremCache solution (PCI-E SSD card EMC XtremSF700 on eMLC chips + software EMC XtremSW). But about EMC ExtremCache there will be the following article. In the meantime, let's talk about VNX2 arrays.
EMC 2 line of midrange level storage systemsupdated in the fall of 2013. The second-generation VNX arrays (VNX2) looked, in my opinion, as well-done work on the mistakes made in the first-generation VNX (VNX1). Vendor presented them as a cardinal and innovative update to the midrenge line. However, now, more than a year after they appeared on the market, VNX2 still has not lost its relevance. I will not dwell on the characteristics and capabilities of the arrays themselves, I will just give links to the official documents Data Sheet and Spec Sheet .
Description of the stand and tests
Under the spoiler
Testing was performed using IOMETER. The load profile is the same as when testing the VNXe3200 . Standard Database pattern (Intel / StorageReview.com).
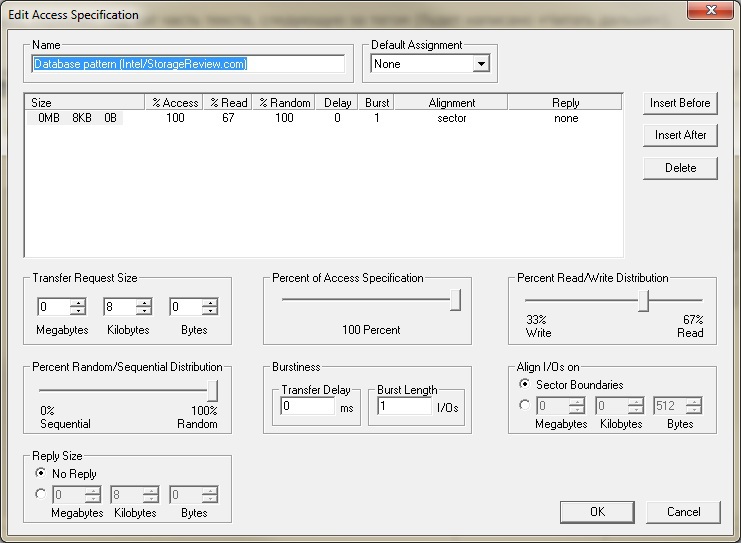
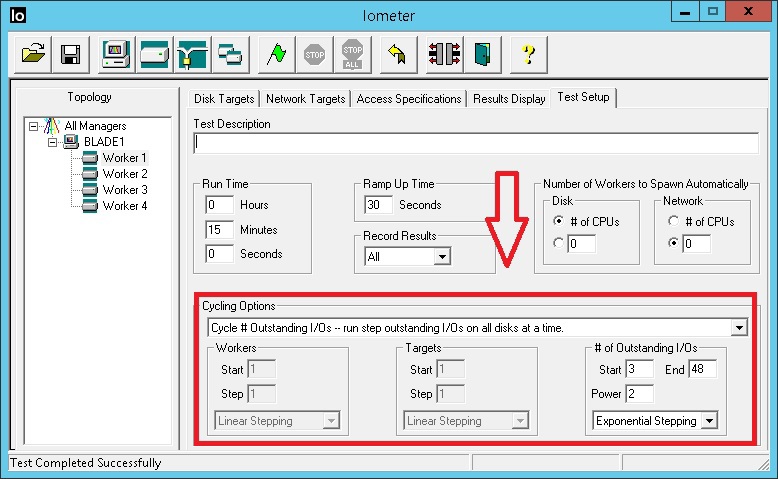
In the presence was an HP DL360 G5 server with 1 CPU (4-core) and 4GB RAM. The server has 2 PCI-E slots. The dual-port HBA Qlogic 4Gb / s, connected directly to the VNX5400, was installed in one of the slots. Since the physical cores in the CPU are much smaller than they were when testing the VNXe3200, we had to initially increase the number of input / output flows for each Worker IOMETER. The ratio of 1 Worker to 1 CPU core. For each Worker, 3 I / O streams were initially set with a “multiplier" of 2. That is, each subsequent run (15 min) of the test in the cycle increased the number of flows by 2 times. Only 5 consecutive runs and, accordingly, on Worker on 3/6/12/24/48 IO streams. In general, the test file received 12/24/48/96/192 streams. Those. the maximum is the same as for the VNXe3200. The time of each test is 15x5 = 75 minutes, not counting the “Rump up time”.
The VNX5400 already had a disk FastVP pool with moons on which the OSs were installed, so I didn’t try to invent and recreate everything. The pool included 3 100Gb SSD disks (Extreme Perfomance Tier) and 15 900Gb SAS 10K RPM disks in Raid5 4 + 1 (Perfomance tier), i.e. 3 private (not visible to the user) Raid Groups in 4 + 1 configuration. Test moons with the Lowest Available Tier policy were created on the pool, so that these moons could be entirely located on SAS disks and SSD disks from Extreme Perfomance Tier would not affect the results.

The server used OS Win2012R2 SP1 and software for managing PowerPath moon paths from EMC 2 .
EMC 2When calculating performance, it recommends that SAS 10k RPM disks use a value of 150 IOPS (FC / SAS 15k RPM - 180 IOPS, SATA / NL_SAS - 90 IOPS, SSD eMLS - 3500 IOPS, SSD SLC - 5000 IOPS). That is, as much as possible in theory, our 15 disks can give 150x15 = 2250 IOPS. We need to calculate how many IOPS will receive from these server disks, taking into account our read / write load profile in the percentage of 67/33 and the overhead of writing to RAID5. We get the following equation with one unknown 2250 = X * 0.33 * 4 + X * 0.67. Where X is with us those IOPS that will receive the server from our disks, and 4 is the size of the “penalty” on the record for Raid5. As a result, we get X = 2250 / 1.99 = ~ 1130 IOPS. Let me remind you that in practice, in peak loads, we usually get IOPS figures 1.5-2 times higher.
In the presence was an HP DL360 G5 server with 1 CPU (4-core) and 4GB RAM. The server has 2 PCI-E slots. The dual-port HBA Qlogic 4Gb / s, connected directly to the VNX5400, was installed in one of the slots. Since the physical cores in the CPU are much smaller than they were when testing the VNXe3200, we had to initially increase the number of input / output flows for each Worker IOMETER. The ratio of 1 Worker to 1 CPU core. For each Worker, 3 I / O streams were initially set with a “multiplier" of 2. That is, each subsequent run (15 min) of the test in the cycle increased the number of flows by 2 times. Only 5 consecutive runs and, accordingly, on Worker on 3/6/12/24/48 IO streams. In general, the test file received 12/24/48/96/192 streams. Those. the maximum is the same as for the VNXe3200. The time of each test is 15x5 = 75 minutes, not counting the “Rump up time”.
The VNX5400 already had a disk FastVP pool with moons on which the OSs were installed, so I didn’t try to invent and recreate everything. The pool included 3 100Gb SSD disks (Extreme Perfomance Tier) and 15 900Gb SAS 10K RPM disks in Raid5 4 + 1 (Perfomance tier), i.e. 3 private (not visible to the user) Raid Groups in 4 + 1 configuration. Test moons with the Lowest Available Tier policy were created on the pool, so that these moons could be entirely located on SAS disks and SSD disks from Extreme Perfomance Tier would not affect the results.
The server used OS Win2012R2 SP1 and software for managing PowerPath moon paths from EMC 2 .
Some calculations.
EMC 2When calculating performance, it recommends that SAS 10k RPM disks use a value of 150 IOPS (FC / SAS 15k RPM - 180 IOPS, SATA / NL_SAS - 90 IOPS, SSD eMLS - 3500 IOPS, SSD SLC - 5000 IOPS). That is, as much as possible in theory, our 15 disks can give 150x15 = 2250 IOPS. We need to calculate how many IOPS will receive from these server disks, taking into account our read / write load profile in the percentage of 67/33 and the overhead of writing to RAID5. We get the following equation with one unknown 2250 = X * 0.33 * 4 + X * 0.67. Where X is with us those IOPS that will receive the server from our disks, and 4 is the size of the “penalty” on the record for Raid5. As a result, we get X = 2250 / 1.99 = ~ 1130 IOPS. Let me remind you that in practice, in peak loads, we usually get IOPS figures 1.5-2 times higher.
Tests and Results
1. Test of Cache controllers (SP - storage processor) VNX5400 2Gb file
This test was conducted on a 2GB file (the size of the test LUN with NTFS is 10 Gb), so that it fits completely in SP Cache and as a result all input / output will be processed from the RAM of the storage controllers. That is, conditionally on the array a small “hot” data area has arisen. At the same time, FastCache on the array was turned off.
As a result, we got the following graph in the Unisphere Analyzer built into the array.

At the same time, the SP Cache was filled as follows (the cache works both for reading and writing):
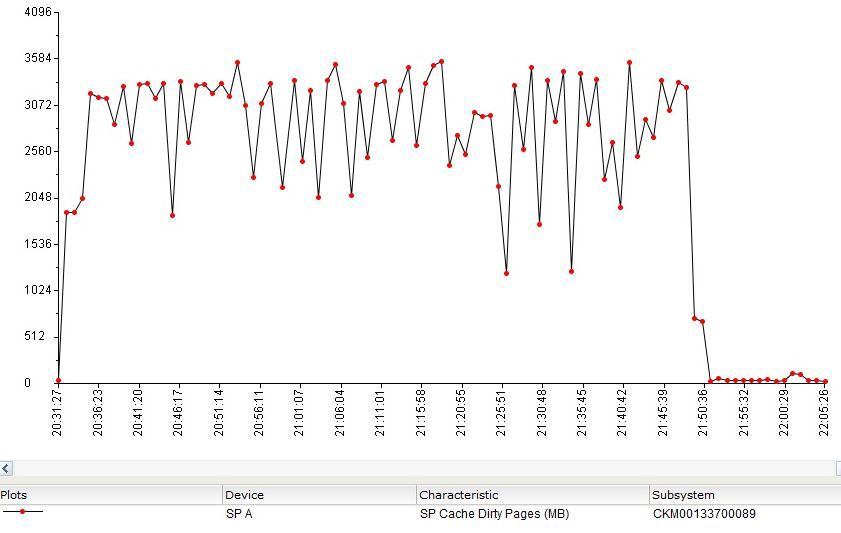
That is, within a few minutes after the start of the test, all 2Gb of the test file was loaded into Cache.
The graph of the dependence of the average IOPS on the number of input / output streams according to the results in IOMETER:

Graph of the dependence of the average values of the I / O response time on the number of I / O streams according to the results in IOMETER: I
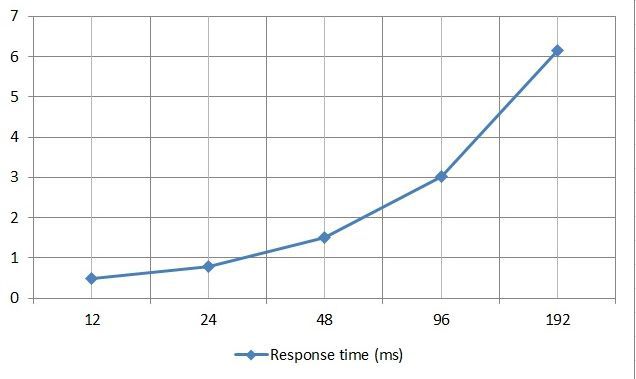
recall that it is generally accepted that the average response time for databases is considered to be comfortable up to 10 ms. The graph shows that with 192 IO streams, which is a rather large value, we got a slightly lower average response time than in the similar test on the VNXe3200 (it was 8 ms). In absolute terms, the difference is not significant, but nevertheless is one of the reasons for the large gap in the number of IOPS. The VNXe3200 had an average of about 23800 IOPS on 192 IO threads in a similar test. If we calculate the percentage difference for the response time and for IOPS, we get about the same 20-25% both there and there.
2. Test the work of Cache controllers (SP - storage processor) VNX5400 file 15Gb
The test was conducted on a 15GB file (LUN with NTFS - 20Gb). FastCache is still off. The size of RAM in the SP in the VNX5400 is 16 Gb. But if you rely on the logs from the array, then the actual RAM used for caching is about 4Gb for the VNX5400. Everything else is apparently used to ensure the operation of the most basic OS controllers and other, quite wide, storage functionality (tiering, thin provisioning, snapshots, clone, replication, fast cache, etc.).

Thus, our 15 Gb of highly loaded (hot) data does not fit in SP Cache. In general, this is exactly what is visible on the chart from Unisphere Analizer. Completely random input / output over all 15 Gb cannot be completely cached by controllers, that's why in this test physical spindles give the bulk of performance, i.e. directly drives.
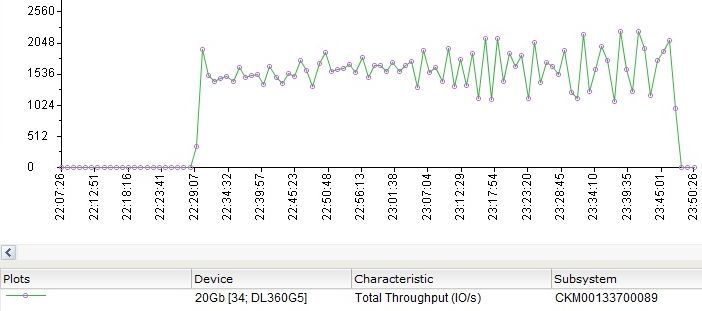
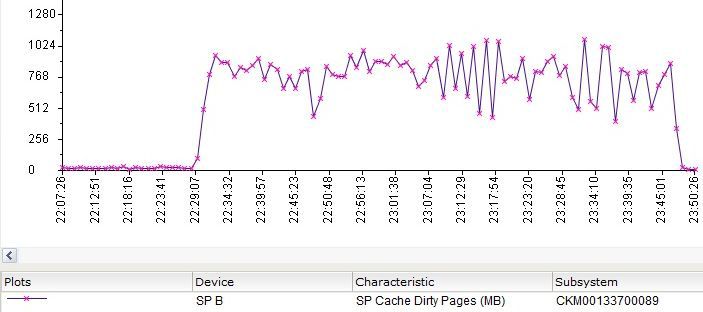
At the same time, SP Cache continues to work, although not as efficiently.
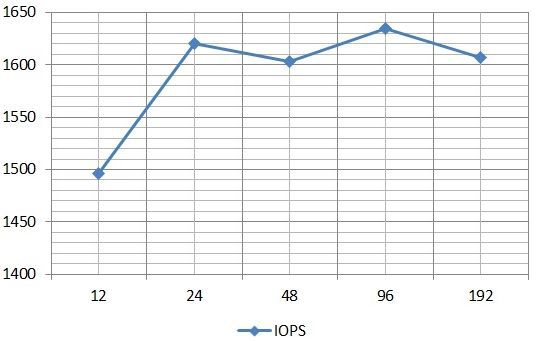
Graph of the dependence of the average IOPS on the number of input / output streams according to the results in IOMETER:
Graph of the average value of the I / O response time on the number of input / output streams according to the results in IOMETER:
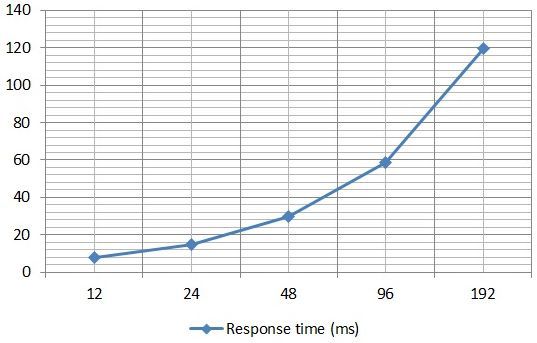
According to the graph, the response time already on 24 streams is about 14 ms, i.e. went beyond the comfort zone. I was also surprised that I missed so much with the estimation of peak disk performance and I “went” to sort it out. As a result, I found out that during the test, the load on not all private RGs in the Perfomance Tier is the same. Those. for performance reasons, our test file is not evenly distributed across all 3 RGs in Performance Tier. On the graph, it looks like this (drives 5, 6 and 7 are SSDs from Extreme Perfomance Tier).

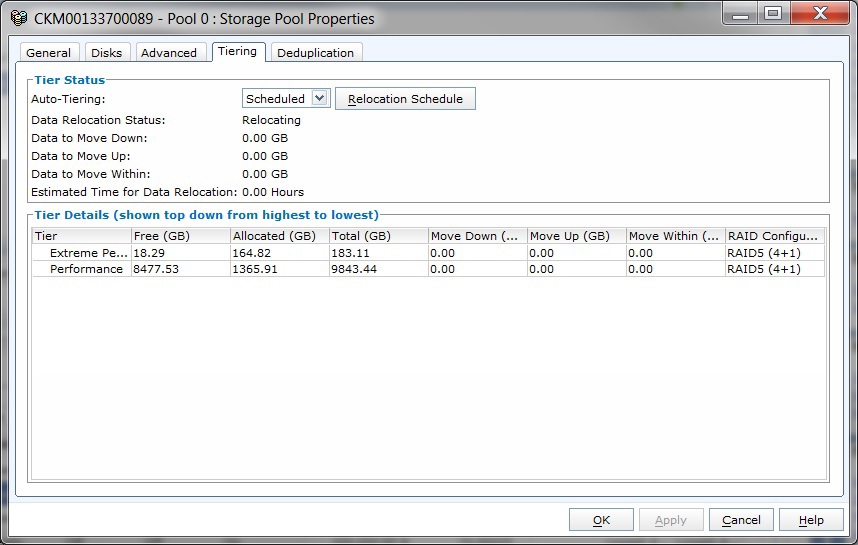
That is, not all 15 spindles were involved in the “full” test. To smooth out a similar effect in FastVP pools on VNX2 arrays, there is a technology that allows you to redistribute “hot” and “cold” data not only between disks with different capacities (SSD, SAS, NL_SAS), but also between private RGs within the same Tier. The redistribution of data between private RGs occurs at the same time as scheduled, as does the migration of data between Tiers. In the array interface, this can be seen in the pool properties on the Tiering tab. In particular, in my case, right after the test, it looked as follows.
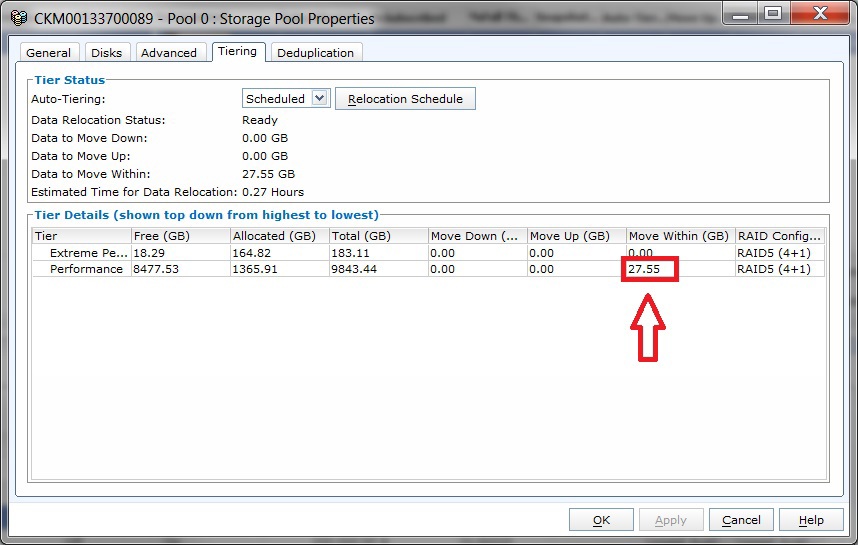
Let me remind you, when the array was idle, the window looked like this.

Another interesting picture can be seen by superimposing on each other the graphs of filling SP Cache and the overall performance of the tested LUN.
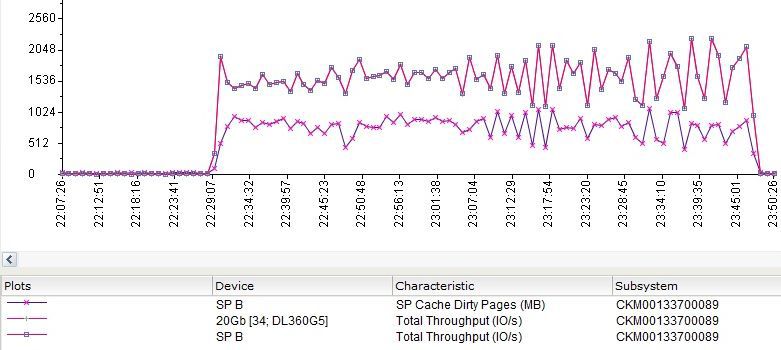
The graph shows that even in a rather unpleasant situation, SP Cache allows you to win "additional" IOPS.
3. Test FastCache in VNX5400 file 15Gb
After enabling FastCache on the array (two 100Gb SSDs in Raid1), a test was conducted on the same file in 15Gb (LUN with NTFS - 20Gb). FastCache in EMC 2 arrays is an additional level of caching based on SSD disks that is built in between SP Cache and the array disks themselves. A file in 15Gb (or the conditionally “hot” data area) should completely fit in 100Gb FastCache, which should improve the results of the previous test.
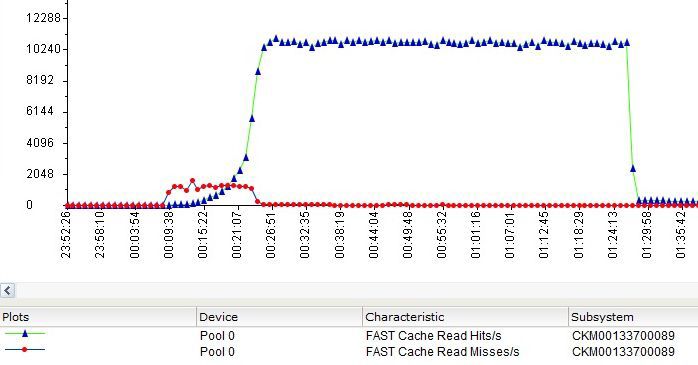
Got the following graph from Unisphere Analizer (in IOPS).

FastCache populated as follows (in%).
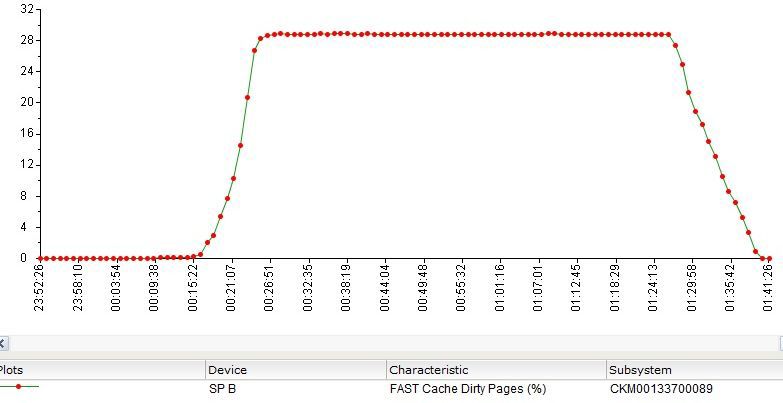
Read Hits / s - read operations that were worked out from FastCache.
Read Misses / s - operations for which data were not found in FastCache and were requested from array disks.
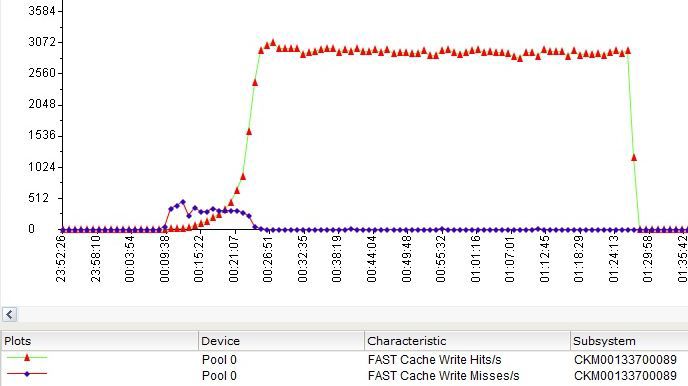
Write Hits / s - write operations in FastCache, which did not require the preliminary dumping of "outdated" data on disks (preliminary clearing of the place in the cache), or operations that requested data written to the cache, but not yet transferred to the disks.
Write Misses / s - write operations not worked out through FastCache or requiring forced (emergency) release of cache space.
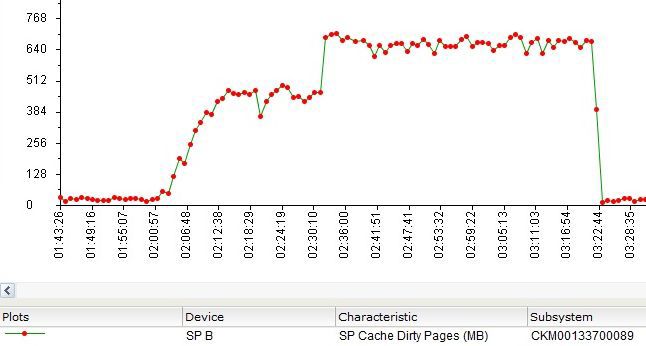
SP Cache also did not stand idle and worked out part of the input / output.
On the server side, IOMETR looked as follows.
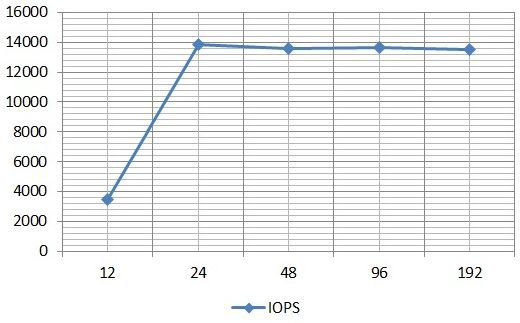
Graph of the dependence of the average IOPS on the number of input / output streams according to the results in IOMETER:
Graph of the average value of the I / O response time on the number of input / output streams according to the results in IOMETER:

The latest graph shows that after loading the "hot" area in FastCache, the response time even decreases and begins to grow only as the input / output flows increase. At the same time, the graph “breaks through” the ceiling of 10 ms far beyond the value of 100 IO streams.
4. Test FastCache in VNX5400 file 150Gb
The next test was conducted on a 150Gb file (Test LUN with NTFS 200Gb). Those. our “hot” data area in this test exceeded the size of FastCache on the array by about 1.5 times. The following results were obtained.
Graph from Unisphere Analizer (in IOPS).
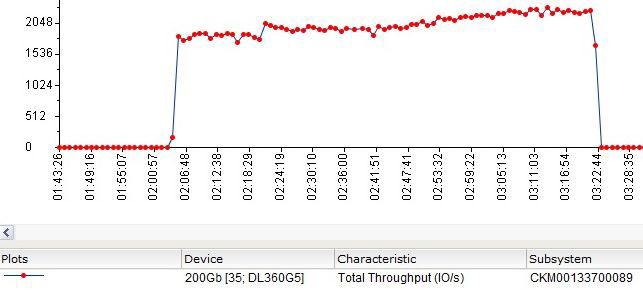
Filling FastCache with data was going on, but rather slowly. By the end of the 75 minute test, about 20% was filled (roughly 20Gb out of the 150Gb test file).

Charts of hits and not hits of read operations in FastCache.

Charts hits / s and misses / s for write operations in FastCache.
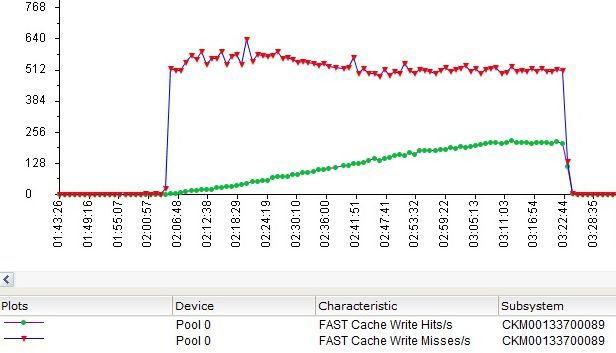
SP Cache was not idle either.
How it looked from the server side and IOMETR.
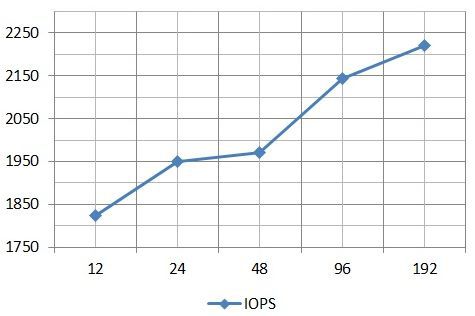
The graph of the dependence of the average IOPS on the number of input / output streams according to the results in IOMETER:
The graph of the dependence of the average values of the I / O response time on the number of I / O streams according to the results in IOMETER:

The graphs show that the IOPS values are slightly higher than they were when testing a 15Gb file without FastCache. So, we could conclude that in this uncomfortable situation FastCache helps to squeeze additional IOPS from the configuration. But in practice, everything turned out to be not quite so.
First, in this test, all private Raid Group (Raid5 4 + 1) in the "Perfomance Tier" were loaded more evenly.

Secondly, I decided to conduct an additional test with a 150Gb file but FastCache turned off. I will not paint it in detail, here are the graphs from IOMETR (I did not believe it at first and conducted the test twice).
Graph of the dependence of the average IOPS on the number of input / output streams according to the results in IOMETER:

Graph of the average value of the I / O response time on the number of input / output streams according to the results in IOMETER:
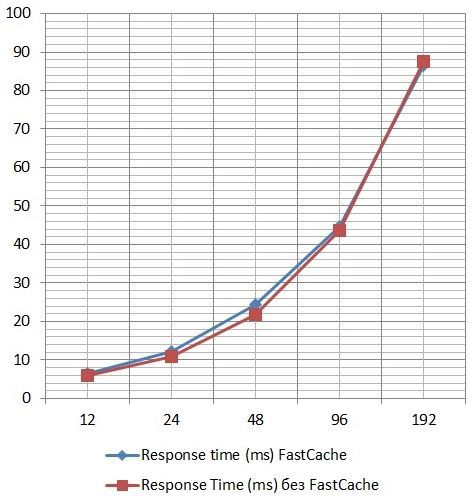
That is, in a situation where the amount of hot data exceeds the size of FastCache and with a high percentage of random requests, filling FastCache takes some time. In such situations, FastCache introduces, albeit a small, but nonetheless additional delay in Response time. In this situation, you can offer to use the optional Extreme Performance Tier on SSD disks in the pool. In this case, part of the hot data will “settle” on it and will not be processed through FastCache. Accordingly, the volume of hot data processed through FastCache will decrease and will be in a more comfortable range. In order not to be unfounded, I conducted another test.
5. Test FastCache in VNX5400 80Gb file
This test was conducted on a 80Gb file (Test LUN with NTFS 100Gb), which is close enough to the FastCache volume in the array under test. That is, the "hot" data area was quite large, but nonetheless completely fit in FastCache.
Graph from Unisphere Analizer (in IOPS).

FastCache populated more actively than on a 150Gb file.
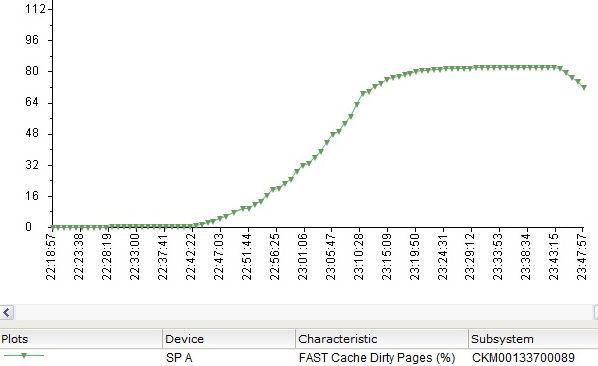
SP Cache also worked out part of the I / O.

From the server side and IOMETR everything looked the same much more rosy than on a 150Gb file.
Graph of the dependence of the average IOPS on the number of input / output streams according to the results in IOMETER:

Graph of the average value of the I / O response time on the number of input / output streams according to the results in IOMETER:

Starting with about 24 IO streams (about 15 minutes from the start of the test), data began to increasingly get into FastCache. Accordingly, the overall performance in the test began to grow as well, while the response time, as the IO streams increased, did not grow as much as in the test with a 150Gb file.
A small digression about disk pools
Under the spoiler
При проектировании диского пула, если вы не знаете реальные размеры области «горячих» и «теплых» данных, то EMC рекомендует придерживаться следующих пропорций для трехуровнего пула:
10% — SSD диски
20% — SAS диски
70% — NL-SAS диски
Кроме того нужно учитывать, что при добавлении flash tier в пул автоматически все метаданные thin лунов, созданных на пуле, будут размещены на SSD. Если там хватает для них места. Это позволяет поднять общую производительность thin лунов и пула. Под эти метаданные нужно планировать дополнительно место на SSD из расчета 3Gb объема на каждый 1Tb реально занятый тонкими лунами на пуле. При всем этом луны имеющие политику тиринга «highest available tier» будут иметь приоритет при размещении на SSD-тире перед любыми другими данными.
Использование политики «lowest available tier» для thin, deduplicated, или compressed лунов приводит к размещению их метаданных на самых медленных дисках. Что негативно сказывается на производительности данных лунов.
Для корректной работы тиринга нужно свободное пространство в пуле. Рекомендуется не менее 10% свободного места на каждом тире. Иначе система не сможет «перекладывать» куски (чанки) данных между разными типами дисков в пуле.
10% — SSD диски
20% — SAS диски
70% — NL-SAS диски
Кроме того нужно учитывать, что при добавлении flash tier в пул автоматически все метаданные thin лунов, созданных на пуле, будут размещены на SSD. Если там хватает для них места. Это позволяет поднять общую производительность thin лунов и пула. Под эти метаданные нужно планировать дополнительно место на SSD из расчета 3Gb объема на каждый 1Tb реально занятый тонкими лунами на пуле. При всем этом луны имеющие политику тиринга «highest available tier» будут иметь приоритет при размещении на SSD-тире перед любыми другими данными.
Использование политики «lowest available tier» для thin, deduplicated, или compressed лунов приводит к размещению их метаданных на самых медленных дисках. Что негативно сказывается на производительности данных лунов.
Для корректной работы тиринга нужно свободное пространство в пуле. Рекомендуется не менее 10% свободного места на каждом тире. Иначе система не сможет «перекладывать» куски (чанки) данных между разными типами дисков в пуле.
Выводы
Based on the tests we can say the following. No matter how strange it may sound, FastCache is not always good. In an improperly designed system, it can affect performance, including in the direction of deterioration. In order not to miss at the design stage, it is better to drive a copy or part of your real loads on the demo array. A demo array can be requested from the vendor. If this is not possible, then you need to proceed from the hot / warm / cold data ratios that the same vendor proposes to use in the calculations (based on statistical data and some other considerations). The first option with a demo array, in my opinion, is preferable. In general, on a properly designed array, an additional level of caching (FastCache) on VNX2 gives a decent performance boost.
The performance of the VNX5400 does not greatly exceed the performance of the VNXe3200, at least in small and comparable configurations (number of disks, FastCache size). Perhaps this is due to the fact that the younger array was released only in this year 2014. The same conclusions can be applied to the VNX5200, in which the SP (controllers) are no different from the VNX5400 (the service part number for the replacement is the same). The VNX5200 has only a limit on the maximum number of disks (125 pcs. Vs 250 pcs. On the VNX5400), a limit on the maximum FastCache size (600Gb vs 1000Gb on the VNX5400) and has one less slot for an additional expansion card with ports for connecting servers.
All tests performed are “synthetics” that have nothing to do with your real workloads. However, in my opinion, such modeling helps to understand the general trends in the behavior of storage systems in certain situations.
Like PS
If you need storage for streaming load (Nr: recording and processing large video streams), then no cache will help you here. There will come a time when it overflows and the number of spindles (disks) in your data storage system will decide in this situation.
If you have a very high transactional load. A large OLTP database or VDI for thousands or tens of thousands of users, then you probably need an all flash array, rather than a classic storage and Tiering.