Research software at universities in the UK
From the translator
In this note, briefly about:
You will also find a link to a file with “raw” and detailed research results, such as a list of universities studied, the number of people surveyed from each university, their area of work, and so on. This will be especially useful for those who wish to independently analyze the results.
This note is a translation of the publication “It is impossible to conduct research without software, said 7 out of ten researchers in the United Kingdom” (English It’s impossible to conduct research without software, say 7 out of 10 UK researchers ) by Simon Hettrick), in which he briefly talked about the results of a statistical study of software used in research at several universities in the United Kingdom. Simon is the deputy director of the Software Sustainability Institute , on behalf of whom the University of Edinburgh conducted the research (The University of Edinburgh on behalf of the Software Sustainability Institute).
This literary translation from English into Russian. If there are tips (or see an error), then please inform me about them. After publishing this translation, I will send Simon a link to this publication (I already have permission from the author to translate and use the diagrams from his report).
Acknowledgments
I would like to thank Simon Hitrik of supported EPSRC Institute software compatibility for its assistance in preparing the material (English I of Would like to acknowledge the assistance of Simon Hettrick from the EPSRC supported. Software Sustainability Institute ").
Hereinafter - translation fasting Simon Hitrik.
No one knows how much software (software) is used in scientific research. Look in any laboratory and you will find both standard and specially written software that is used in all disciplines and by researchers at all levels. Software is clearly a fundamental component of research, but we cannot confirm this without evidence. And this lack of evidence is the reason why we conducted a study of used research software in fifteen universities of the Russell group (Eng. Russell Group - approx. Translator).
The data collected from this statistical study is available for download and licensed under a Creative Commons by Attribution license (attribution to the University of Edinburgh on behalf of the Institute for Software Compatibility).
If we don’t know how much we rely on software, then we can’t be sure that the researchers have the tools and skills necessary to remain leaders in research. For the first time, on such a scale, we have collected data on the use of research software, its development and the level of training of researchers. In addition, we have collected demographic data so that we can answer a question such as “Is software development more likely for males than females?” (The answer, as it turned out, is “yes”, but women and men equally use research software )
Thanks to Mario Antonioletti (Eng. Mario Antonio - approx. Translator), Neil Chue Hong (Eng. Neil Chue Hong - approx. Translator), Steve Crouch (Eng. Steve Crouch - approx. Translator), Devasena Inupakutika (Eng. Devasena Inupakutika - translator's comment) and Tim Parkinson (Eng. Tim Parkinson - approx. translator) for their help in building the survey, developing the necessary program codes and analyzing the results. Thanks also to the full members (Institute - approx. Translator) for being "guinea pigs" while working with drafts of this survey.
The survey results described here are based on the responses of 417 researchers who were randomly selected from fifteen universities from the Russell group. We have achieved good representativeness among various disciplines, levels of researchers and sexes. This number of respondents is statistically significant in order to represent the opinions of employees of those British universities in which scientific activity is at a high level.
The main problem of a “blind” survey is that it must be short so that we can get the maximum number of responses from respondents. This means that we had the opportunity to uncover the facts about the use of software, but we did not have a place to study individual cases. We will conduct further research to achieve this goal.
Note translator to the diagrams above:
in the upper left corner - the percentage of use or non-use of research software;
in the upper right - the frequency of answers to the proposed variants of the question “What can happen if research software cannot be used?”;
in the lower left - the percentage of respondents who develop or do not develop their research software;
in the lower right - the percentage of those developers who received or did not receive training in software development.
It is no exaggeration to say that software is vital for research. If software magically disappeared from research, 7 out of 10 researchers would be left without work.
92% of respondents said they used research software. Moreover, 70% of respondents said "that carrying out my work would be impractical if there were no such software."
The use of research software weakly depends on the professional level of the respondents.
It is difficult to measure a professional level. Therefore, we simply asked the respondents how many years they had worked in the field of research. Variation for different groups is not significant and amounts to 12%.
98% of those who worked in research for 6-10 years, noted that they most used research software and of those who worked more than 20 years noted the least use at the level of 86%.
The first two categories are those who worked less than a year and those who worked from one year to five years noted that 91-92% of them use such software. The use of software in research reaches its maximum for the next ten years and then decreases in groups of researchers with work experience of 15-20 years or longer.
There are several ways to explain this variation. Unfortunately, they cannot be confirmed by our results. It seems that researchers with primary and secondary professional levels are the “workhorses” in conducting research and, most likely, can generate the most results, and, therefore, are most likely to use research software. As soon as a researcher reaches a higher level, there is a tendency to carry out managerial functions, which reduces the likelihood of using research software.
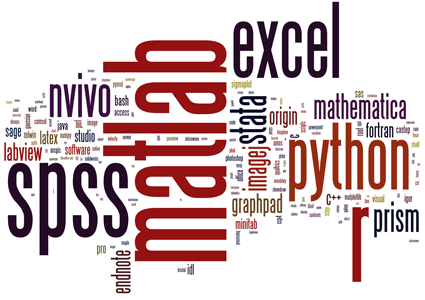
Many different products are used: we registered 566 different softwares, some of which were mentioned only once by the respondents, but some were mentioned more often. The most popular packages are Matlab (20% of respondents use it), R (16%), SPSS (15%) and Excel (12%). In order to show the list of used software packages in the form of a diagram, we have compiled a tag cloud shown at the top of this page.
Not only proprietary products are used. Many researchers write their own codes - 56% of them. This is great news because the real power of software is under development with the goal of doing more work in less time and making new research possible.
Many researchers develop their research software, but is this development safe?
55% of respondents received some training in the field of software development (15% through self-training and 40% by attending relevant courses). It is worrying that 21% of respondents from among developers do not have training in software development. This is one in five.
Computer programs that are developed without adequate training will most likely not be the kind that you can rely on. Researchers, by nature, are intelligent people who absorb new skills quickly. But there are many pitfalls in developing good programs (for example, the results of the software used in the future will not lead to the recall of already published works). And this is only about reliability! We need results that can be protected in the future, which require a lot of skills related to writing recreated code. We also want to protect investments in research that require even more skills for writing programs that can be used in the future.
Information about the main funding organization of a particular study is a convenient way to divide respondents into separate disciplines. About half of the respondents were funded by the organization EPSRC (Council of Engineering and Physical Research - approx. Translator), from university funds and from other sources (which are a wide range of funding organizations from private to foreign). The other half of the respondents were divided in fairly equal shares between the remaining research councils, EU funds and large charitable organizations.
The use of research software is almost uniform among the respondents and regardless of their funding is approximately in the range of 87-100%. A marked exception was shown by respondents whose main funding organization is AHRC (Council of Arts and Humanities - approx. Translator), of which only 60% use research software.
Discrepancies in the results begin to appear when we look at respondents who write their own programs. These respondents can be divided into three groups. The leaders are researchers sponsored by STFC (Council of Scientific and Technological Infrastructures - approx. Translator), NERC(Council for Environmental Research - approx. Translator) and EPSRC , among which, respectively, 93%, 90% and 79% develop their own research software. The next software development group is around 50%. This group includes researchers who are funded from other sources. The third group consists of respondents funded by the National Institute for Health Research (31%), industrial organizations (17%) and AHRC (10%).
It is probably not surprising that the percentage of researchers who received training in software development, in some form, follows the percentage of those who develop software. The variation between these two categories is within ± 10%.
Many researchers believe that including software development costs in a project proposal will make this proposal weaker. We have received feedback from research councils which says that this is not so - that is what we are trying to convince the researchers of. But we can surrender in this pursuit.
When we asked those researchers who are responsible for writing project proposals whether they included software development costs, 22% said that they did it, 57% said that they didn’t, and 20% said that they didn’t even think that software development can be part of the budget! (note that rounding errors lead to the fact that the sum of the percentages of these groups is 99%.)
36% of the respondents were female and 62% were male. The remainder went to those who chose their gender as “other,” “prefer not to report,” or left this question unanswered (the answer to the question about the respondents' gender was optional).
There is no difference in the percentage of software use between male and female respondents - 92% for both groups. This is invigorating news!
Although there is no difference in the use of research software among representatives of different sexes, there is a huge difference when it comes to its development. 70% of male respondents develop their research software, while only 30% of female respondents do this.
This male dominance in development is reflected, as you might expect, in the scope of the training. Only 39% of female respondents received training in software development, compared with 63% of male respondents.
There is a difference, though not significant, in those cases when it comes to simply using research software: 88% of users of the Windows operating system family are also users of research software, compared with 93% for OS X and a noticeable 98% for Linux.
When it comes to research software development, the difference becomes noticeable. Only 41% of Windows users develop research software, which again falls behind the number of users of OS X with 53%. Users of the Linux family of OSs themselves: 90% of them develop their own research software.
There is a potentially important lesson for the software development community. If you want users to use your software, then it is better to be sure that it works in OS X and Windows, as well as in the "native" Linux environment.
We needed results that could represent a society of researchers. So we did the research and contacted thousands of randomly selected researchers at each of Russell’s 15 universities. After 15,000 invitations to conduct the study, we received 417 responses, which represents 3%, which in turn is quite normal for a “blind” study.
We asked respondents about “research software,” which was defined as follows:
We used Google Forms to collect responses from respondents. Subsequently, the results were transferred to Excel format files for analysis and uploaded to Google Drive for further distribution.
In this note, briefly about:
- how many researchers use scientific research software (software) at universities in the UK?
- which software is used?
- how many researchers develop their research software, how many are users of research software, how does it depend on discipline, gender and other factors?
- what computer operating system is chosen by developers and users of research software?
You will also find a link to a file with “raw” and detailed research results, such as a list of universities studied, the number of people surveyed from each university, their area of work, and so on. This will be especially useful for those who wish to independently analyze the results.
This note is a translation of the publication “It is impossible to conduct research without software, said 7 out of ten researchers in the United Kingdom” (English It’s impossible to conduct research without software, say 7 out of 10 UK researchers ) by Simon Hettrick), in which he briefly talked about the results of a statistical study of software used in research at several universities in the United Kingdom. Simon is the deputy director of the Software Sustainability Institute , on behalf of whom the University of Edinburgh conducted the research (The University of Edinburgh on behalf of the Software Sustainability Institute).
This literary translation from English into Russian. If there are tips (or see an error), then please inform me about them. After publishing this translation, I will send Simon a link to this publication (I already have permission from the author to translate and use the diagrams from his report).
Acknowledgments
I would like to thank Simon Hitrik of supported EPSRC Institute software compatibility for its assistance in preparing the material (English I of Would like to acknowledge the assistance of Simon Hettrick from the EPSRC supported. Software Sustainability Institute ").
Hereinafter - translation fasting Simon Hitrik.
No one knows how much software (software) is used in scientific research. Look in any laboratory and you will find both standard and specially written software that is used in all disciplines and by researchers at all levels. Software is clearly a fundamental component of research, but we cannot confirm this without evidence. And this lack of evidence is the reason why we conducted a study of used research software in fifteen universities of the Russell group (Eng. Russell Group - approx. Translator).
Highlights
- 92% of respondents use research software;
- 69% of them said that their study would be impractical without such software;
- 56% develop their own software (but the concern is that 21% of them do not have training in software development);
- 70% of male researchers develop their software and only 30% of female researchers do it.
Data
The data collected from this statistical study is available for download and licensed under a Creative Commons by Attribution license (attribution to the University of Edinburgh on behalf of the Institute for Software Compatibility).
Software is significantly more important to research than anyone knows.
If we don’t know how much we rely on software, then we can’t be sure that the researchers have the tools and skills necessary to remain leaders in research. For the first time, on such a scale, we have collected data on the use of research software, its development and the level of training of researchers. In addition, we have collected demographic data so that we can answer a question such as “Is software development more likely for males than females?” (The answer, as it turned out, is “yes”, but women and men equally use research software )
our team
Thanks to Mario Antonioletti (Eng. Mario Antonio - approx. Translator), Neil Chue Hong (Eng. Neil Chue Hong - approx. Translator), Steve Crouch (Eng. Steve Crouch - approx. Translator), Devasena Inupakutika (Eng. Devasena Inupakutika - translator's comment) and Tim Parkinson (Eng. Tim Parkinson - approx. translator) for their help in building the survey, developing the necessary program codes and analyzing the results. Thanks also to the full members (Institute - approx. Translator) for being "guinea pigs" while working with drafts of this survey.
Poll scale
The survey results described here are based on the responses of 417 researchers who were randomly selected from fifteen universities from the Russell group. We have achieved good representativeness among various disciplines, levels of researchers and sexes. This number of respondents is statistically significant in order to represent the opinions of employees of those British universities in which scientific activity is at a high level.
Limitations
The main problem of a “blind” survey is that it must be short so that we can get the maximum number of responses from respondents. This means that we had the opportunity to uncover the facts about the use of software, but we did not have a place to study individual cases. We will conduct further research to achieve this goal.
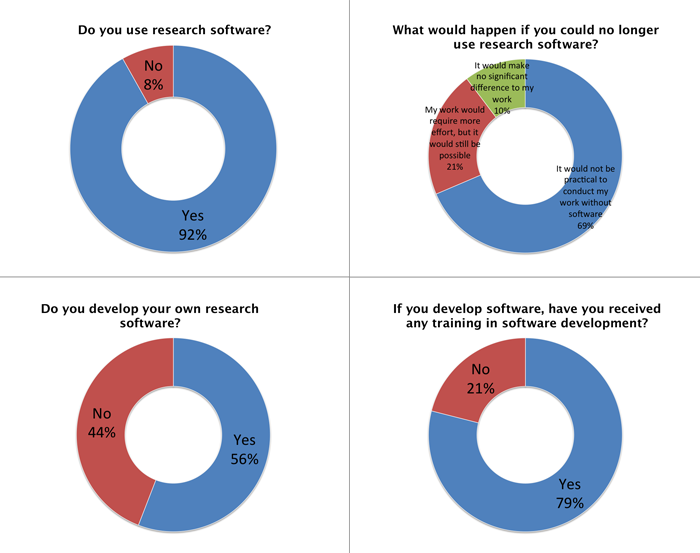
Note translator to the diagrams above:
in the upper left corner - the percentage of use or non-use of research software;
in the upper right - the frequency of answers to the proposed variants of the question “What can happen if research software cannot be used?”;
in the lower left - the percentage of respondents who develop or do not develop their research software;
in the lower right - the percentage of those developers who received or did not receive training in software development.
How many researchers use software in research?
It is no exaggeration to say that software is vital for research. If software magically disappeared from research, 7 out of 10 researchers would be left without work.
92% of respondents said they used research software. Moreover, 70% of respondents said "that carrying out my work would be impractical if there were no such software."
Dependence on the level of respondents
The use of research software weakly depends on the professional level of the respondents.
It is difficult to measure a professional level. Therefore, we simply asked the respondents how many years they had worked in the field of research. Variation for different groups is not significant and amounts to 12%.
98% of those who worked in research for 6-10 years, noted that they most used research software and of those who worked more than 20 years noted the least use at the level of 86%.
The first two categories are those who worked less than a year and those who worked from one year to five years noted that 91-92% of them use such software. The use of software in research reaches its maximum for the next ten years and then decreases in groups of researchers with work experience of 15-20 years or longer.
There are several ways to explain this variation. Unfortunately, they cannot be confirmed by our results. It seems that researchers with primary and secondary professional levels are the “workhorses” in conducting research and, most likely, can generate the most results, and, therefore, are most likely to use research software. As soon as a researcher reaches a higher level, there is a tendency to carry out managerial functions, which reduces the likelihood of using research software.
What software is used?
Many different products are used: we registered 566 different softwares, some of which were mentioned only once by the respondents, but some were mentioned more often. The most popular packages are Matlab (20% of respondents use it), R (16%), SPSS (15%) and Excel (12%). In order to show the list of used software packages in the form of a diagram, we have compiled a tag cloud shown at the top of this page.
Many researchers develop their software products, even without a sufficient level of training.
Not only proprietary products are used. Many researchers write their own codes - 56% of them. This is great news because the real power of software is under development with the goal of doing more work in less time and making new research possible.
Many researchers develop their research software, but is this development safe?
55% of respondents received some training in the field of software development (15% through self-training and 40% by attending relevant courses). It is worrying that 21% of respondents from among developers do not have training in software development. This is one in five.
Computer programs that are developed without adequate training will most likely not be the kind that you can rely on. Researchers, by nature, are intelligent people who absorb new skills quickly. But there are many pitfalls in developing good programs (for example, the results of the software used in the future will not lead to the recall of already published works). And this is only about reliability! We need results that can be protected in the future, which require a lot of skills related to writing recreated code. We also want to protect investments in research that require even more skills for writing programs that can be used in the future.
Discipline to Discipline Variation
Information about the main funding organization of a particular study is a convenient way to divide respondents into separate disciplines. About half of the respondents were funded by the organization EPSRC (Council of Engineering and Physical Research - approx. Translator), from university funds and from other sources (which are a wide range of funding organizations from private to foreign). The other half of the respondents were divided in fairly equal shares between the remaining research councils, EU funds and large charitable organizations.
The use of research software is almost uniform among the respondents and regardless of their funding is approximately in the range of 87-100%. A marked exception was shown by respondents whose main funding organization is AHRC (Council of Arts and Humanities - approx. Translator), of which only 60% use research software.
Discrepancies in the results begin to appear when we look at respondents who write their own programs. These respondents can be divided into three groups. The leaders are researchers sponsored by STFC (Council of Scientific and Technological Infrastructures - approx. Translator), NERC(Council for Environmental Research - approx. Translator) and EPSRC , among which, respectively, 93%, 90% and 79% develop their own research software. The next software development group is around 50%. This group includes researchers who are funded from other sources. The third group consists of respondents funded by the National Institute for Health Research (31%), industrial organizations (17%) and AHRC (10%).
It is probably not surprising that the percentage of researchers who received training in software development, in some form, follows the percentage of those who develop software. The variation between these two categories is within ± 10%.
Software development costs are not included in the project budget.
Many researchers believe that including software development costs in a project proposal will make this proposal weaker. We have received feedback from research councils which says that this is not so - that is what we are trying to convince the researchers of. But we can surrender in this pursuit.
When we asked those researchers who are responsible for writing project proposals whether they included software development costs, 22% said that they did it, 57% said that they didn’t, and 20% said that they didn’t even think that software development can be part of the budget! (note that rounding errors lead to the fact that the sum of the percentages of these groups is 99%.)
Gender differences in software use
36% of the respondents were female and 62% were male. The remainder went to those who chose their gender as “other,” “prefer not to report,” or left this question unanswered (the answer to the question about the respondents' gender was optional).
There is no difference in the percentage of software use between male and female respondents - 92% for both groups. This is invigorating news!
Gender Differences in Software Development
Although there is no difference in the use of research software among representatives of different sexes, there is a huge difference when it comes to its development. 70% of male respondents develop their research software, while only 30% of female respondents do this.
This male dominance in development is reflected, as you might expect, in the scope of the training. Only 39% of female respondents received training in software development, compared with 63% of male respondents.
What can I say based on information about choosing the operating system of the computers of developers?
There is a difference, though not significant, in those cases when it comes to simply using research software: 88% of users of the Windows operating system family are also users of research software, compared with 93% for OS X and a noticeable 98% for Linux.
When it comes to research software development, the difference becomes noticeable. Only 41% of Windows users develop research software, which again falls behind the number of users of OS X with 53%. Users of the Linux family of OSs themselves: 90% of them develop their own research software.
There is a potentially important lesson for the software development community. If you want users to use your software, then it is better to be sure that it works in OS X and Windows, as well as in the "native" Linux environment.
How did we collect the data?
We needed results that could represent a society of researchers. So we did the research and contacted thousands of randomly selected researchers at each of Russell’s 15 universities. After 15,000 invitations to conduct the study, we received 417 responses, which represents 3%, which in turn is quite normal for a “blind” study.
We asked respondents about “research software,” which was defined as follows:
Software that is used to generate, process or analyze the results that you plan to place in publications (in a journal, conference publication, monograph, book or abstract). Research software can be anything from a few lines of code written independently to a professionally designed software package. Software that does not generate, process or analyze results, such as text editors, or used to search the Internet, is not considered research software as part of this study.
We used Google Forms to collect responses from respondents. Subsequently, the results were transferred to Excel format files for analysis and uploaded to Google Drive for further distribution.